
Reports
Reports
End users in the IT robotic automation market are leveraging robotic process automation (RPA) tools and techniques to automate a wide range of business tasks. Over the years, CIOs in businesses and enterprises are embracing new RPA tools to meet the different scenarios. Financial services firms, in particular, have been early adopters of IT robotic automation; the adoption of bots to drive customer value is a case in point. The gains of IT robotic automation for such firms drove the prospects. For instance, reduced human errors and staffing costs are key market propositions. A wide assortment of cognitive technologies expanded the avenue in the IT robotic automation.
Growing trend of intelligent automation has helped industry players carve out new niche propositions in recent years. Extensive adoption of RPA software tool by large enterprises is a case in point where new RPA scenarios are expanding the canvas for proponents in the IT robotic automation market. Advances made in cognitive computing are expanding the capabilities of IT process automation tools.
The high cost and complexity of the technological environments has made navigation difficult in different RPA scenarios. Regulations have also proved to impediment to adoption of IT robotic automation. More importantly, robotic programs lack acceptance due to human conundrum of job loss and lack of technical expertise in teaching bots new customer value. These fears have held back enterprises to scale up RPAs. Nevertheless, in the recent epidemic of Covid-19, robotic process automation witnessed a newfound optimism, the reason having to do with the vast significance of RPAs in consumer connect.
Further, need to address surge in consumer queries in the last few months’ also added impetus to the demand for IT robotic automation. On the other hand, enterprises who have adopted RPAs are zealously training them to work alongside human staff and fuel the benefits of automation. Also, companies are adopting new approaches to smoothen change management in this regard. All these trends will boost the IT robotic automation market.
IT Robotic Automation Market - Snapshot
The global IT robotic automation market was valued at US$ 1,108.4 Mn in 2017 and is expected to expand at a CAGR of 40.1% during forecast period from 2018 to 2026. Organizations that are investing on labor on a large scale are likely to boost their capabilities while saving time and money with robotic automation. Robotic automation has revolutionized the way to administer business processes, IT management and support processes, workflow processes, and back-office work. Furthermore, automation enables improvements in accuracy and increased productivity in process transaction while elevating the nature of work by eliminating employees from doing dull and repetitive tasks.
IT robotic automation can be utilized in a wide range of industry sectors to improve production rates while not hampering the quality. The factors leading to the expanding adoption of robotic automation includes reduction of cost and enhanced efficiency offered by robotic automation over manual processes in the IT industry. Robotic automation has observed significant adoption across various IT applications such as business process outsourcing (BPO) management, infrastructure management, and application management due to these benefits. Furthermore, growing implementation of cloud-based solutions is likely to boost the IT robotic automation market during the forecast period. Also, organizations are seeking alternate technologies to address the challenges arising from dynamic environments. Ever growing complexities in IT operations and management demanding the need for robotic interference is another factor fueling the growth of the IT robotic automation market.
Although there are factors supporting the growth of the market, increased security concerns of the technology is impacting the growth of the market. Additionally, existing outsourcing contracts in the BPO sector is hampering the adoption of IT robotic automation due to complexities involving long contract durations.
The report categorizes the IT robotic automation market into three major segments and their sub – segments. The IT robotic automation market is categorized into tools and services. The tools are further segmented into model based tools and process based tools. Services are segmented intoprofessional and training services. There are three more categories of professional services which includes consulting, integration and development, and BPO.
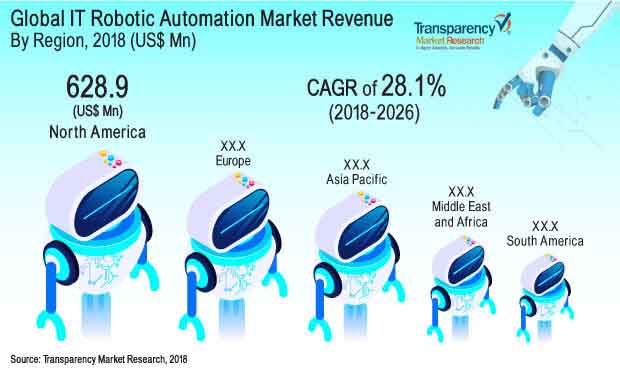
North America remained the dominant region in the IT robotic automation market in 2017.The region accounted for almost one-third of the global market revenue share and is expected to continue its leading position throughout the forecast period. This is due to the fact that a large number of mid-sized and small enterprises are leaning toward automation software. Europe captured the second largest market share in 2017. Asia Pacific witnessed significant growth in 2017, buoyed by rising adoption rate of digitalization and automation over the years. Factors such as different regulatory compliances and limited availability of efficient infrastructure are seen as key reasons for the potential growth slag.
IT services providers are looking forward to leverage robotic process automation to enhance their capabilities and sustain in the competitive IT industry. Time savings and reduction in operational cost particularly are major factors while responding to the evolving consumer needs and these are key factors impacting the overall growth of IT enterprises.
The major providers of IT robotic automation solutions include Blue Prism, Be Informed B.V., Appian, IPSoft, Inc., Tata Consultancy Services Limited., Infosys Limited, Cognizant Technology Solutions Corp., Atos SE, Capgemini, Genfour, Genpact Ltd., Automation Anywhere, Inc., Sutherland Global Services, Inc., and UiPathSRL. As the need for more interactive and user friendly automation solutions increases in future, the market is likely to witness wider changes with intense competition. Furthermore, owing to tight training and development budgets, organizations prefer cost-effective solutions to offer training resources, thus enabling substantial growth opportunities in developing regions in the coming years.
The IT Robotic Automation market growth will increase by $11,417.4 million by the end of 2026.
IT Robotic Automation Market is projected to expand at a CAGR of 40.1% from 2018 to 2026
IT robotic automation market is categorized into tools and services. The tools are further segmented into model based tools and process based tools. Services are segmented into professional and training services.
The top companies that hold the market share in the IT Robotic Automation market include UiPathSRL, Capgemini, Genpact Ltd., Cognizant Technology Solutions Corp., Infosys Limited, Tata Consultancy Services Limited., and Blue Prism.
North America is growing at the highest CAGR over 2018 to 2026.
1. Preface
1.1. Market Definition and Scope
1.2. Market Segmentation
1.3. Key Research Objectives
1.4. Research Highlights
2. Assumptions and Research Methodology
3. Executive Summary : Global IT Robotic Automation Market
4. Market Overview
4.1. Introduction
4.2. Market Dynamics
4.2.1. Drivers
4.2.2. Restraints
4.2.3. Opportunities
4.3. Global IT Robotic Automation Market Analysis and Forecasts, 2016 - 2026
4.3.1. Market Revenue Projections (US$ Mn)
4.4. Impact Analysis of IT Robotic Automation on Global IT Industry
4.5. Market Outlook
5. Global IT Robotic Automation Market Analysis and Forecasts, By Application
5.1. Key Findings
5.2. Market Size (US$ Mn) Forecast By Application, 2016 - 2026
5.2.1. Tools
5.2.1.1. Model based
5.2.1.2. Process based
5.2.2. Services
5.2.2.1. Professional
5.2.2.1.1. Consulting
5.2.2.1.2. Integration and Development
5.2.2.1.3. BPO
5.2.2.2. Training
5.3. Market Attractiveness
5.3.1. By Application
5.3.2. By Tools
5.3.3. By Services
6. Global IT Robotic Automation Market Analysis and Forecasts, By Region
6.1. Key Findings
6.2. IT Robotic Automation Market Size (US$ Mn) Forecast By Region, 2016 - 2026
6.2.1. North America
6.2.2. Europe
6.2.3. Asia Pacific
6.2.4. Middle East &Africa
6.2.5. South America
6.3. Market Attractiveness, by Country/Region
7. North America IT Robotic Automation Market Analysis and Forecast
7.1. Key Findings
7.2. Market Size (US$ Mn) Forecast By Application, 2016 - 2026
7.2.1. Tools
7.2.1.1. Model based
7.2.1.2. Process based
7.2.2. Services
7.2.2.1. Professional
7.2.2.1.1. Consulting
7.2.2.1.2. Integration and Development
7.2.2.1.3. BPO
7.2.2.2. Training
7.3. Market Attractiveness
7.3.1. By Application
7.3.2. By Tools
7.3.3. By Services
8. Europe IT Robotic Automation Market Analysis and Forecast
8.1. Key Findings
8.2. Market Size (US$ Mn) Forecast By Application, 2016 - 2026
8.2.1. Tools
8.2.1.1. Model based
8.2.1.2. Process based
8.2.2. Services
8.2.2.1. Professional
8.2.2.1.1. Consulting
8.2.2.1.2. Integration and Development
8.2.2.1.3. BPO
8.2.2.2. Training
8.3. Market Attractiveness
8.3.1. By Application
8.3.2. By Tools
8.3.3. By Services
9. Asia Pacific IT Robotic Automation Equipment Market Analysis and Forecast
9.1. Key Findings
9.2. Market Size (US$ Mn) Forecast By Application, 2016 - 2026
9.2.1. Tools
9.2.1.1. Model based
9.2.1.2. Process based
9.2.2. Services
9.2.2.1. Professional
9.2.2.1.1. Consulting
9.2.2.1.2. Integration and Development
9.2.2.1.3. BPO
9.2.2.2. Training
9.3. Market Attractiveness
9.3.1. By Application
9.3.2. By Tools
9.3.3. By Services
10. Middle East &Africa (MEA) IT Robotic Automation Market Analysis and Forecast
10.1. Key Findings
10.2. Market Size (US$ Mn) Forecast By Application, 2016 - 2026
10.2.1. Tools
10.2.1.1. Model based
10.2.1.2. Process based
10.2.2. Services
10.2.2.1. Professional
10.2.2.1.1. Consulting
10.2.2.1.2. Integration and Development
10.2.2.1.3. BPO
10.2.2.2. Training
10.3. Market Attractiveness
10.3.1. By Application
10.3.2. By Tools
10.3.3. By Services
11. South America IT Robotic Automation Market Analysis and Forecast
11.1. Key Findings
11.2. Market Size (US$ Mn) Forecast By Application, 2016 - 2026
11.2.1. Tools
11.2.1.1. Model based
11.2.1.1. Process based
11.2.2. Services
11.2.2.1. Professional
11.2.2.1.1. Consulting
11.2.2.1.2. Integration and Development
11.2.2.1.3. BPO
11.2.2.2. Training
11.3. Market Attractiveness
11.3.1. By Application
11.3.2. By Tools
11.3.3. By Services
12. Competition Landscape
12.1. Market Player – Competition Matrix
12.2. Market Positioning By Company (2017)
12.3. Company Profiles
12.3.1. Blue Prism
1.1.1.1. Product Portfolio
1.1.1.2. Geographical Presence
1.1.1.3. SWOT
1.1.1.4. Financial Overview
1.1.1.5. Strategy
12.3.2. Be Informed B.V.
1.1.1.6. Product Portfolio
1.1.1.7. Geographical Presence
1.1.1.8. SWOT
1.1.1.9. Financial Overview
1.1.1.10. Strategy
12.3.3. Appian
1.1.1.11. Product Portfolio
1.1.1.12. Geographical Presence
1.1.1.13. SWOT
1.1.1.14. Financial Overview
1.1.1.15. Strategy
12.3.4. IPSoft, Inc.
1.1.1.16. Product Portfolio
1.1.1.17. Geographical Presence
1.1.1.18. SWOT
1.1.1.19. Financial Overview
1.1.1.20. Strategy
12.3.5. Tata Consultancy Services Limited.
1.1.1.21. Product Portfolio
1.1.1.22. Geographical Presence
1.1.1.23. SWOT
1.1.1.24. Financial Overview
1.1.1.25. Strategy
12.3.6. Infosys Limited
1.1.1.26. Product Portfolio
1.1.1.27. Geographical Presence
1.1.1.28. SWOT
1.1.1.29. Financial Overview
1.1.1.30. Strategy
12.3.7. Cognizant Technology Solutions Corp
1.1.1.31. Product Portfolio
1.1.1.32. Geographical Presence
1.1.1.33. SWOT
1.1.1.34. Financial Overview
1.1.1.35. Strategy
12.3.8. Atos SE
1.1.1.36. Product Portfolio
1.1.1.37. Geographical Presence
1.1.1.38. SWOT
1.1.1.39. Financial Overview
1.1.1.40. Strategy
12.3.9. Capgemini
1.1.1.41. Product Portfolio
1.1.1.42. Geographical Presence
1.1.1.43. SWOT
1.1.1.44. Financial Overview
1.1.1.45. Strategy
12.3.10. Genfour
1.1.1.46. Product Portfolio
1.1.1.47. Geographical Presence
1.1.1.48. SWOT
1.1.1.49. Financial Overview
1.1.1.50. Strategy
12.3.11. Genpact Ltd.
1.1.1.51. Product Portfolio
1.1.1.52. Geographical Presence
1.1.1.53. SWOT
1.1.1.54. Financial Overview
1.1.1.55. Strategy
12.3.12. Automation Anywhere, Inc.
1.1.1.56. Product Portfolio
1.1.1.57. Geographical Presence
1.1.1.58. SWOT
1.1.1.59. Financial Overview
1.1.1.60. Strategy
12.3.13. Sutherland Global Services, Inc.
1.1.1.61. Product Portfolio
1.1.1.62. Geographical Presence
1.1.1.63. SWOT
1.1.1.64. Financial Overview
1.1.1.65. Strategy
12.3.14. UiPath SRL
1.1.1.66. Product Portfolio
1.1.1.67. Geographical Presence
1.1.1.68. SWOT
1.1.1.69. Financial Overview
1.1.1.70. Strategy
13. Key Takeaways
List of Tables
Table 1: Global IT Robotic Automation Market Forecast, by Type, 2016–2026 (US$ Mn)
Table 2: Global IT Robotic Automation Market Forecast, by Tools, 2016–2026 (US$ Mn)
Table 3: Global IT Robotic Automation Market Forecast, by Services, 2016–2026 (US$ Mn)
Table 4: Global IT Robotic Automation Market Forecast, by Professional Services, 2016–2026 (US$ Mn)
Table 5: Global IT Robotic Automation Market Forecast, by Consulting, 2016–2026 (US$ Mn)
Table 6: Global IT Robotic Automation Market Forecast, by Integration and Development, 2016–2026 (US$ Mn)
Table 7: Global IT Robotic Automation Market Forecast, by Region, 2016–2026 (US$ Mn)
Table 8: North America IT Robotic Automation Market Forecast, by Type, 2016–2026 (US$ Mn)
Table 9: North America IT Robotic Automation Market Forecast, by Tools, 2016–2026 (US$ Mn)
Table 10: North America IT Robotic Automation Market Forecast, by Services, 2016–2026 (US$ Mn)
Table 11: North America IT Robotic Automation Market Forecast, by Professional Services, 2016–2026 (US$ Mn)
Table 12: North America IT Robotic Automation Market Forecast, by Consulting, 2016–2026 (US$ Mn)
Table 13: North America IT Robotic Automation Market Forecast, by Integration and Development, 2016–2026 (US$ Mn)
Table 14: North America IT Robotic Automation Market Forecast, by Country, 2016–2026 (US$ Mn)
Table 15: Europe IT Robotic Automation Market Forecast, by Type, 2016–2026 (US$ Mn)
Table 16: Europe IT Robotic Automation Market Forecast, by Tools, 2016–2026 (US$ Mn)
Table 17: Europe IT Robotic Automation Market Forecast, by Services, 2016–2026 (US$ Mn)
Table 19: Europe IT Robotic Automation Market Forecast, by Professional Services, 2016–2026 (US$ Mn)
Table 20: Europe IT Robotic Automation Market Forecast, by Consulting, 2016–2026 (US$ Mn)
Table 21: Europe IT Robotic Automation Market Forecast, by Integration and Development, 2016–2026 (US$ Mn)
Table 22: Europe IT Robotic Automation Market Forecast, by Country, 2016–2026 (US$ Mn)
Table 23: Asia Pacific IT Robotic Automation Market Forecast, by Type, 2016–2026 (US$ Mn)
Table 24: Asia Pacific IT Robotic Automation Market Forecast, by Tools, 2016–2026 (US$ Mn)
Table 25: Asia Pacific IT Robotic Automation Market Forecast, by Services, 2016–2026 (US$ Mn)
Table 26: Asia Pacific IT Robotic Automation Market Forecast, by Professional Services, 2016–2026 (US$ Mn)
Table 27: Asia Pacific IT Robotic Automation Market Forecast, by Consulting, 2016–2026 (US$ Mn)
Table 28: Asia Pacific IT Robotic Automation Market Forecast, by Integration and Development, 2016–2026 (US$ Mn)
Table 29: Asia Pacific IT Robotic Automation Market Forecast, by Country, 2016–2026 (US$ Mn)
Table 30: Middle East & Africa IT Robotic Automation Market Forecast, by Type, 2016–2026 (US$ Mn)
Table 31: Middle East & Africa IT Robotic Automation Market Forecast, by Tools, 2016–2026 (US$ Mn)
Table 32: Middle East & Africa IT Robotic Automation Market Forecast, by Services, 2016–2026 (US$ Mn)
Table 33: Middle East & Africa IT Robotic Automation Market Forecast, by Professional Services, 2016–2026 (US$ Mn)
Table 34: Middle East & Africa IT Robotic Automation Market Forecast, by Consulting, 2016–2026 (US$ Mn)
Table 35: Middle East & Africa IT Robotic Automation Market Forecast, by Integration and Development, 2016–2026 (US$ Mn)
Table 36: Middle East & Africa IT Robotic Automation Market Forecast, by Country, 2016–2026 (US$ Mn)
Table 37: South America IT Robotic Automation Market Forecast, by Type, 2016–2026 (US$ Mn)
Table 38: South America IT Robotic Automation Market Forecast, by Tools, 2016–2026 (US$ Mn)
Table 39: South America IT Robotic Automation Market Forecast, by Services, 2016–2026 (US$ Mn)
Table 40: South America IT Robotic Automation Market Forecast, by Professional Services, 2016–2026 (US$ Mn)
Table 41: South America IT Robotic Automation Market Forecast, by Consulting, 2016–2026 (US$ Mn)
Table 42: South America IT Robotic Automation Market Forecast, by Integration and Development, 2016–2026 (US$ Mn)
Table 43: Middle East and Africa IT Robotic Automation Market Forecast, by Country, 2016–2026 (US$ Mn)
List of Figures
Figure 1: Global IT Robotic Automation Market Revenue and Forecasts, 2016 - 2026 (US$ Mn)
Figure 2: Market Forecast, by Type (2018)
Figure 3: Market Forecast, by Tools (2018)
Figure 4: Market Forecast, by Services (2018)
Figure 5: Market Forecast, by Region (2018)
Figure 6: Global IT Robotic Automation Market Forecast and Analysis, by Type, 2017 and 2026
Figure 7: Global IT Robotic Automation Market Forecast and Analysis, by Tools, 2017 and 2026
Figure 8: Global IT Robotic Automation Market Forecast and Analysis, by Services, 2017 and 2026
Figure 9: Global IT Robotic Automation Market Forecast and Analysis, by Professional Services, 2017 and 2026
Figure 10: Global IT Robotic Automation Market Forecast and Analysis, by Consulting, 2017 and 2026
Figure 11: Global IT Robotic Automation Market Forecast and Analysis, by Integration and Development, 2017 and 2026
Figure 12: Global IT Robotic Automation Market Forecast and Analysis, By Region, 2017 and 2026
Figure 13: Global IT Robotic Automation Market Attractiveness, by Type
Figure 14: Global IT Robotic Automation Market Attractiveness, By Tools
Figure 15: Global IT Robotic Automation Market Attractiveness, By Services
Figure 16: Global IT Robotic Automation Market Attractiveness, By Professional
Figure 17: Global IT Robotic Automation Market Market: Market Attractiveness, By Region
Figure 18: North America IT Robotic Automation Market Forecast and Analysis, by Type, 2017 and 2026
Figure 19: North America IT Robotic Automation Market Forecast and Analysis, by Tools, 2017 and 2026
Figure 20: North America IT Robotic Automation Market Forecast and Analysis, by Services, 2017 and 2026
Figure 21: North America IT Robotic Automation Market Forecast and Analysis, by Professional Services, 2017 and 2026
Figure 22: North America IT Robotic Automation Market Forecast and Analysis, by Consulting, 2017 and 2026
Figure 23: North America IT Robotic Automation Market Forecast and Analysis, by Integration and Development, 2017 and 2026
Figure 24: North America IT Robotic Automation Market Forecast and Analysis, by Country, 2017 and 2026
Figure 25: North America IT Robotic Automation Market: Market Attractiveness, by Type
Figure 26: North America IT Robotic Automation Market: Market Attractiveness, By Tools
Figure 27: North America IT Robotic Automation Market: Market Attractiveness, By Services
Figure 28: North America IT Robotic Automation Market: Market Attractiveness, By Professional
Figure 29: Europe IT Robotic Automation Market Forecast and Analysis, by Type, 2017 and 2026
Figure 30: Europe IT Robotic Automation Market Forecast and Analysis, by Tools, 2017 and 2026
Figure 31: Europe IT Robotic Automation Market Forecast and Analysis, by Services, 2017 and 2026
Figure 32: Europe IT Robotic Automation Market Forecast and Analysis, by Professional Services, 2017 and 2026
Figure 33: Europe IT Robotic Automation Market Forecast and Analysis, by Consulting, 2017 and 2026
Figure 34: Europe IT Robotic Automation Market Forecast and Analysis, by Integration and Development, 2017 and 2026
Figure 35: Europe IT Robotic Automation Market Forecast and Analysis, by Country, 2017 and 2026
Figure 36: Europe IT Robotic Automation Market: Market Attractiveness, by Type
Figure 37: Europe IT Robotic Automation Market: Market Attractiveness, By Tools
Figure 38: Europe IT Robotic Automation Market: Market Attractiveness, By Services
Figure 39: Europe IT Robotic Automation Market: Market Attractiveness, By Professional
Figure 40: Asia Pacific IT Robotic Automation Market Forecast and Analysis, by Type, 2017 and 2026
Figure 41: Asia Pacific IT Robotic Automation Market Forecast and Analysis, by Tools, 2017 and 2026
Figure 42: Asia Pacific IT Robotic Automation Market Forecast and Analysis, by Services, 2017 and 2026
Figure 43: Asia Pacific IT Robotic Automation Market Forecast and Analysis, by Professional Services, 2017 and 2026
Figure 44: Asia Pacific IT Robotic Automation Market Forecast and Analysis, by Consulting, 2017 and 2026
Figure 45: Asia Pacific IT Robotic Automation Market Forecast and Analysis, by Integration and Development, 2017 and 2026
Figure 46: Asia Pacific IT Robotic Automation Market Forecast and Analysis, by Country, 2017 and 2026
Figure 47: Asia Pacific IT Robotic Automation Market: Market Attractiveness, by Type
Figure 48: Asia Pacific IT Robotic Automation Market: Market Attractiveness, By Tools
Figure 49: Asia Pacific IT Robotic Automation Market: Market Attractiveness, By Services
Figure 50: Asia Pacific IT Robotic Automation Market: Market Attractiveness, By Professional
Figure 51: Middle East &Africa IT Robotic Automation Market Forecast and Analysis, by Type, 2017 and 2026
Figure 52: Middle East &Africa IT Robotic Automation Market Forecast and Analysis, by Tools, 2017 and 2026
Figure 53: Middle East &Africa IT Robotic Automation Market Forecast and Analysis, by Services, 2017 and 2026
Figure 54: Middle East &Africa IT Robotic Automation Market Forecast and Analysis, by Professional Services, 2017 and 2026
Figure 55: Middle East &Africa IT Robotic Automation Market Forecast and Analysis, by Consulting, 2017 and 2026
Figure 56: Middle East &Africa IT Robotic Automation Market Forecast and Analysis, by Integration and Development, 2017 and 2026
Figure 57: Middle East &Africa IT Robotic Automation Market Forecast and Analysis, by Country, 2017 and 2026
Figure 58: Middle East &Africa IT Robotic Automation Market: Market Attractiveness, by Type
Figure 59: Middle East &Africa IT Robotic Automation Market: Market Attractiveness, By Tools
Figure 60: Middle East &Africa IT Robotic Automation Market: Market Attractiveness, By Services
Figure 61: Middle East &Africa IT Robotic Automation Market: Market Attractiveness, By Professional
Figure 62: South America IT Robotic Automation Market Forecast and Analysis, by Type, 2017 and 2026
Figure 63: South America IT Robotic Automation Market Forecast and Analysis, by Tools, 2017 and 2026
Figure 64: South America IT Robotic Automation Market Forecast and Analysis, by Services, 2017 and 2026
Figure 65: South America IT Robotic Automation Market Forecast and Analysis, by Professional Services, 2017 and 2026
Figure 66: South America IT Robotic Automation Market Forecast and Analysis, by Consulting, 2017 and 2026
Figure 67: South America IT Robotic Automation Market Forecast and Analysis, by Integration and Development, 2017 and 2026
Figure 68: South America IT Robotic Automation Market Forecast and Analysis, by Country, 2017 and 2026
Figure 69: South America IT Robotic Automation Market: Market Attractiveness, by Type
Figure 70: South America IT Robotic Automation Market: Market Attractiveness, By Tools
Figure 71: South America IT Robotic Automation Market: Market Attractiveness, By Services
Figure 72: South America IT Robotic Automation Market: Market Attractiveness, By Professional
Figure 73: Positioning Analysis of Robotic Process Automation Tool Providers
Copyright © Transparency Market Research, Inc. All Rights reserved
Trust Online

IT Robotic Automation Market Insights, 2018 – 2026