
Reports
Reports
Increased Cloud Assets Create New Playing Field for ITOSM Service Providers
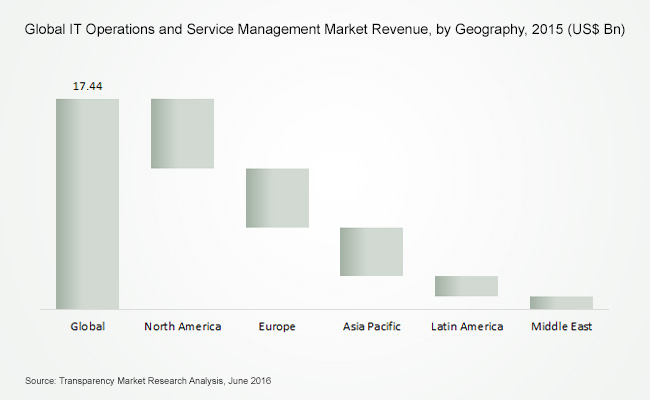
The global IT operations and service management (ITOSM) market had reached US$17.44 bn in 2015. The market is on pace to exhibit a 6.5% CAGR between 2016 and 2024. Although the adoption of enterprise IT has palpably been on the rise in larger organizations, small and mid-sized businesses are still not entirely sold on the idea of investing in IT operations and service management because they continue to remain skeptical about the return on investment. While this challenges the growth of the ITOSM market’s growth, it is also where untapped opportunities lie, TMR expects.
Nevertheless, as more organizations in the manufacturing and IT and telecom sectors vie to keep abreast of the latest trends in enterprise IT, particularly cloud computing, the deployment of IT operations and service management solutions is bound to increase, says TMR. The need for IT application management, workload management, and configuration will continue to mount, enabling the ITOSM market to be worth US$30.96 bn by the end of 2024.
Digital Service Management is a Trend Worth Taking Note Of
Digitization is making inroads into virtually every industry vertical leading multibillion-dollar opportunities to spring up for companies in the IT enterprise solutions and services business. The value of virtually each solution is being measured based on how agile, scalable, and responsive it is – especially in the context of cloud-based systems. Against this backdrop, investment sentiment relating to IT operations and service management is expected to remain positive.
This has resulted in a greater assortment of services being offered by companies competing for a larger share of the pie in the ITOSM market. A case in point would be BMC Software’s announcement in February 2016 that it would be adding digital service management services and solutions to its existing mix of ITOSM offerings. Companies are also exploring takeovers and mergers to acquire digital service management (DSM) capabilities. Cisco Systems, Inc., for instance, has adopted this strategy by announcing an interest in DSM provider, DiviTech A/S.
Asia Pacific to Exhibit Fastest Growth as Organizations Pursue a Public Cloud Strategy
Asia Pacific will be front and center of the global IT operations and service management (ITOSM) market in terms of growth rate. Countries such as China, India, Japan, and South Korea are witnessing rising investor interest in enterprise IT and, subsequently, ITOSM. This trend will manifest in the form of an 8.1% CAGR for the Asia Pacific ITOSM market through the report’s forecast period. As the number of internet users in Asia Pacific rises and technologies such as 4G LTE make inroads in emerging economies, the amount of data generated is expected to soar. This factor will augur well for the growth of the ITOSM market. SMEs represent a massive untapped opportunity in the APAC region.
In 2015, ITOSM represented a US$5.70-bn opportunity in North America. The traditional ITOSM market is on the cusp of a sweeping digital transformation in North America, where enterprises want to be more agile and mobile. Innovation thus remains the cornerstone of growth for companies operating in the U.S. and Canada. This trend will add value to conventional suite of ITOSM services and put the North America ITOSM market firmly on the growth track.
In the Middle East and Africa, upcoming big-ticket events such as the 2022 FIFA World Cup in Qatar and the Dubai World Expo 2020 has prompted enterprises to invest more in analytics, rich media, and smart devices. This will lead to greater demand for ITOSM services and solutions in the Middle East and Africa.
Brazil leads in Latin America, in terms of technology adoption. The country is followed by others such as Mexico, Argentina, and Chile. The overall increase in IT expenditure and the launch of secure mobile platforms for enterprises will benefit the growth of the ITOSM market in Latin America.
Companies at the forefront of the global ITOSM market include: Microsoft Corporation, BMC Software Inc., Oracle Corp., IBM Corporation, HP Inc., CA Technology, Inc., and Dell, Inc.
Table of Contents
1. Preface
1.1. Research Scope
1.2. Market Segmentation
1.3. Research Methodology
2. Executive Summary
2.1. Global IT Operations and Services Management Market Snapshot
2.2. Global IT Operations and Services Management Market Revenue, 2014 – 2024 (US$ Mn) and Year-on-Year Growth (%)
3. Global IT Operations and Services Management Market Analysis, 2014 – 2024 (US$ Mn)
3.1. Key Trends Analysis
3.2. Market Dynamics
3.2.1. Drivers
3.2.2. Restraints
3.2.3. Opportunities
3.3. Global IT Operations and Services Management Market Analysis, By Type, 2014-2024 (US$ Mn)
3.3.1. ITSM
3.3.2. ITOM
3.4. Global IT Operations Management Market Analysis, By Type, 2014-2024 (US$ Mn)
3.4.1. Configuration Automation and Discovery
3.4.2. Event Management
3.4.3. Cloud Provisioning
3.4.4. Workload and IT Automation
3.5. Global IT Operations and Services Management Market Analysis, By Industry Vertical, 2014 – 2024 (US$ Mn)
3.5.1. Banking, Financial Services & Insurance (BFSI)
3.5.2. Telecom and IT
3.5.3. Government
3.5.4. Healthcare/Medical/Pharmaceutical
3.5.5. Aerospace/Defence
3.5.6. Retail/Wholesale/Distribution
3.5.7. Manufacturing
3.5.8. Education
3.5.9. Hospitality/Entertainment/Recreation/Travel
3.5.10. Energy and Utilities
3.5.11. Others
3.6. Competitive Landscape
3.6.1. Market Share of Key Players, 2015
3.6.2. Market Positioning of Key Players, 2015
3.6.3. Competitive Strategies Adopted by Leading Players
4. North America IT Operations and Services Management Market Analysis, 2014 – 2024 (US$ Mn)
4.1. Key Trends Analysis
4.2. North America IT Operations and Services Management Market Analysis, By Type, 2014-2024 (US$ Mn)
4.2.1. ITSM
4.2.2. ITOM
4.3. North America IT Operations Management Market Analysis, By Type, 2014-2024 (US$ Mn)
4.3.1. Configuration Automation and Discovery
4.3.2. Event Management
4.3.3. Cloud Provisioning
4.3.4. Workload and IT Automation
4.4. North America IT Operations and Services Management Market Analysis, By Industry Vertical, 2014 – 2024 (US$ Mn)
4.4.1. Banking, Financial Services & Insurance (BFSI)
4.4.2. Telecom and IT
4.4.3. Government
4.4.4. Healthcare/Medical/Pharmaceutical
4.4.5. Aerospace/Defence
4.4.6. Retail/Wholesale/Distribution
4.4.7. Manufacturing
4.4.8. Education
4.4.9. Hospitality/Entertainment/Recreation/Travel
4.4.10. Energy and Utilities
4.4.11. Others
4.5. North America IT Operations and Services Management Market Analysis, By Country, 2014 - 2024 (US$ Mn)
4.5.1. U.S.
4.5.2. Rest of North America
5. Europe IT Operations and Services Management Market Analysis, 2014 – 2024 (US$ Mn)
5.1. Key Trends Analysis
5.2. Europe IT Operations and Services Management Market Analysis, By Type, 2014-2024 (US$ Mn)
5.2.1. ITSM
5.2.2. ITOM
5.3. Europe IT Operations Management Market Analysis, By Type, 2014-2024 (US$ Mn)
5.3.1. Configuration Automation and Discovery
5.3.2. Event Management
5.3.3. Cloud Provisioning
5.3.4. Workload and IT Automation
5.4. Europe IT Operations and Services Management Market Analysis, By Industry Vertical, 2014 – 2024 (US$ Mn)
5.4.1. Banking, Financial Services & Insurance (BFSI)
5.4.2. Telecom and IT
5.4.3. Government
5.4.4. Healthcare/Medical/Pharmaceutical
5.4.5. Aerospace/Defence
5.4.6. Retail/Wholesale/Distribution
5.4.7. Manufacturing
5.4.8. Education
5.4.9. Hospitality/Entertainment/Recreation/Travel
5.4.10. Energy and Utilities
5.4.11. Others
5.5. Europe IT Operations and Services Management Market Analysis, By Country, 2014 - 2024 (US$ Mn)
5.5.1. EU5 (UK, Germany, France, Italy and Spain)
5.5.2. CIS
5.5.3. Rest of Europe
6. Asia Pacific IT Operations and Services Management Market Analysis, 2014 – 2024 (US$ Mn)
6.1. Key Trends Analysis
6.2. Asia Pacific IT Operations and Services Management Market Analysis, By Type, 2014-2024 (US$ Mn)
6.2.1. ITSM
6.2.2. ITOM
6.3. Asia Pacific IT Operations Management Market Analysis, By Type, 2014-2024 (US$ Mn)
6.3.1. Configuration Automation and Discovery
6.3.2. Event Management
6.3.3. Cloud Provisioning
6.3.4. Workload and IT Automation
6.4. Asia Pacific IT Operations and Services Management Market Analysis, By Industry Vertical, 2014 – 2024 (US$ Mn)
6.4.1. Banking, Financial Services & Insurance (BFSI)
6.4.2. Telecom and IT
6.4.3. Government
6.4.4. Healthcare/Medical/Pharmaceutical
6.4.5. Aerospace/Defence
6.4.6. Retail/Wholesale/Distribution
6.4.7. Manufacturing
6.4.8. Education
6.4.9. Hospitality/Entertainment/Recreation/Travel
6.4.10. Energy and Utilities
6.4.11. Others
6.5. Asia Pacific IT Operations and Services Management Market Analysis, By Country, 2014 - 2024 (US$ Mn)
6.5.1. China
6.5.2. Japan
6.5.3. Australasia
6.5.4. South Asia
6.5.5. Rest of Asia Pacific
7. Middle East and Africa (MEA) IT Operations and Services Management Market Analysis, 2014 – 2024 (US$ Mn)
7.1. Key Trends Analysis
7.2. MEA IT Operations and Services Management Market Analysis, By Type, 2014-2024 (US$ Mn)
7.2.1. ITSM
7.2.2. ITOM
7.3. MEA IT Operations Management Market Analysis, By Type, 2014-2024 (US$ Mn)
7.3.1. Configuration Automation and Discovery
7.3.2. Event Management
7.3.3. Cloud Provisioning
7.3.4. Workload and IT Automation
7.4. MEA IT Operations and Services Management Market Analysis, By Industry Vertical, 2014 – 2024 (US$ Mn)
7.4.1. Banking, Financial Services & Insurance (BFSI)
7.4.2. Telecom and IT
7.4.3. Government
7.4.4. Healthcare/Medical/Pharmaceutical
7.4.5. Aerospace/Defence
7.4.6. Retail/Wholesale/Distribution
7.4.7. Manufacturing
7.4.8. Education
7.4.9. Hospitality/Entertainment/Recreation/Travel
7.4.10. Energy and Utilities
7.4.11. Others
7.5. MEA IT Operations and Services Management Market Analysis, By Country, 2014 - 2024 (US$ Mn)
7.5.1. GCC Region
7.5.2. North Africa
7.5.3. Southern Africa
7.5.4. Rest of Middle East and Africa
8. Latin America IT Operations and Services Management Market Analysis, 2014 – 2024 (US$ Mn)
8.1. Key Trends Analysis
8.2. Latin America IT Operations and Services Management Market Analysis, By Type, 2014-2024 (US$ Mn)
8.2.1. ITSM
8.2.2. ITOM
8.3. Latin America IT Operations Management Market Analysis, By Type, 2014-2024 (US$ Mn)
8.3.1. Configuration Automation and Discovery
8.3.2. Event Management
8.3.3. Cloud Provisioning
8.3.4. Workload and IT Automation
8.4. Latin America IT Operations and Services Management Market Analysis, By Industry Vertical, 2014 – 2024 (US$ Mn)
8.4.1. Banking, Financial Services & Insurance (BFSI)
8.4.2. Telecom and IT
8.4.3. Government
8.4.4. Healthcare/Medical/Pharmaceutical
8.4.5. Aerospace/Defence
8.4.6. Retail/Wholesale/Distribution
8.4.7. Manufacturing
8.4.8. Education
8.4.9. Hospitality/Entertainment/Recreation/Travel
8.4.10. Energy and Utilities
8.4.11. Others
8.5. Latin America IT Operations and Services Management Market Analysis, By Country, 2014 - 2024 (US$ Mn)
8.5.1. Brazil
8.5.2. Rest of Latin America
9. Company Profiles
9.1. IBM Corporation
9.1.1. Company Details (HQ, Foundation Year, Employee Strength)
9.1.2. Market Presence, By Segment and Geography
9.1.3. Key Developments
9.1.4. Strategy and Historical Roadmap
9.1.5. Revenue and Operating Profits
9.2. Oracle Corporation
9.2.1. Company Details (HQ, Foundation Year, Employee Strength)
9.2.2. Market Presence, By Segment and Geography
9.2.3. Key Developments
9.2.4. Strategy and Historical Roadmap
9.2.5. Revenue and Operating Profits
9.3. HP Inc.
9.3.1. Company Details (HQ, Foundation Year, Employee Strength)
9.3.2. Market Presence, By Segment and Geography
9.3.3. Key Developments
9.3.4. Strategy and Historical Roadmap
9.3.5. Revenue and Operating Profits
9.4. Compuware Corporation
9.4.1. Company Details (HQ, Foundation Year, Employee Strength)
9.4.2. Market Presence, By Segment and Geography
9.4.3. Key Developments
9.4.4. Strategy and Historical Roadmap
9.4.5. Revenue and Operating Profits
9.5. ServiceNow, Inc.
9.5.1. Company Details (HQ, Foundation Year, Employee Strength)
9.5.2. Market Presence, By Segment and Geography
9.5.3. Key Developments
9.5.4. Strategy and Historical Roadmap
9.5.5. Revenue and Operating Profits
9.6. LANDESK Software
9.6.1. Company Details (HQ, Foundation Year, Employee Strength)
9.6.2. Market Presence, By Segment and Geography
9.6.3. Key Developments
9.6.4. Strategy and Historical Roadmap
9.6.5. Revenue and Operating Profits
9.7. Cherwell Software Inc.
9.7.1. Company Details (HQ, Foundation Year, Employee Strength)
9.7.2. Market Presence, By Segment and Geography
9.7.3. Key Developments
9.7.4. Strategy and Historical Roadmap
9.7.5. Revenue and Operating Profits
9.8. BMC Software, Inc.
9.8.1. Company Details (HQ, Foundation Year, Employee Strength)
9.8.2. Market Presence, By Segment and Geography
9.8.3. Key Developments
9.8.4. Strategy and Historical Roadmap
9.8.5. Revenue and Operating Profits
9.9. ASG Software Solutions
9.9.1. Company Details (HQ, Foundation Year, Employee Strength)
9.9.2. Market Presence, By Segment and Geography
9.9.3. Key Developments
9.9.4. Strategy and Historical Roadmap
9.9.5. Revenue and Operating Profits
9.10. CA Technology, Inc.
9.10.1. Company Details (HQ, Foundation Year, Employee Strength)
9.10.2. Market Presence, By Segment and Geography
9.10.3. Key Developments
9.10.4. Strategy and Historical Roadmap
9.10.5. Revenue and Operating Profits
List of Tables
Table 1 Global ITOSM Market Revenue, By Type, 2014 - 2024 (US$ Bn)
Table 2 Global ITOM Market Revenue, By Type, 2014 - 2024 (US$ Bn)
Table 3 Global ITOSM Market Revenue, By Industry Verticals, 2014 - 2024 (US$ Bn)
Table 4 North America ITOSM Market Share Analysis, By Type, 2014 - 2024 (US$ Bn)
Table 5 North America ITOM Market Share Analysis, By Type, 2014 - 2024 (US$ Bn)
Table 6 North America ITOSM Market Analysis, By Industry Verticals, 2014 - 2024 (US$ Bn)
Table 7 Europe ITOSM Market Share Analysis, By Type, 2014 - 2024 (US$ Bn)
Table 8 Europe ITOM Market Share Analysis, By Type, 2014 - 2024 (US$ Bn)
Table 9 Europe ITOSM Market Analysis, By Industry Verticals, 2014 - 2024 (US$ Bn)
Table 10 Asia Pacific ITOSM Market Share Analysis, By Type, 2014 - 2024 (US$ Bn)
Table 11 Asia Pacific ITOM Market Share Analysis, By Type, 2014 - 2024 (US$ Bn)
Table 12 Asia Pacific ITOSM Market Analysis, By Industry Verticals, 2014 - 2024 (US$ Bn)
Table 13 MEA ITOSM Market Share Analysis, By Type, 2014 - 2024 (US$ Bn)
Table 14 MEA ITOM Market Share Analysis, By Type, 2014 - 2024 (US$ Bn)
Table 15 MEA ITOSM Market Analysis, By Industry Verticals, 2014 - 2024 (US$ Bn)
Table 16 Latin America ITOSM Market Share Analysis, By Type, 2014 - 2024 (US$ Bn)
Table 17 Latin America ITOM Market Share Analysis, By Type, 2014 - 2024 (US$ Bn)
Table 18 Latin America ITOSM Market Analysis, By Industry Verticals, 2014 - 2024 (US$ Bn)
Table 19 North America ITOSM Market Analysis, By Country Snippets, 2014 - 2024 (US$ Bn)
Table 20 Europe ITOSM Market Analysis, By Country Snippets, 2014 - 2024 (US$ Bn)
Table 21 Asia Pacific ITOSM Market Analysis, By Country Snippets, 2014 - 2024 (US$ Bn)
Table 22 MEA ITOSM Market Analysis, By Country Snippets, 2014 - 2024 (US$ Bn)
Table 23 Latin America ITOSM Market Analysis, By Country Snippets, 2014 - 2024 (US$ Bn
List of Figures
Figure 1 Global ITOSM Market Revenue, 2015–2024 (US$ Bn) and Year-on-Year Growth (%)
Figure 2 Global ITOSM Market Share Analysis, By Type, 2015 and 2024 (%)
Figure 3 Global ITOM Market Share Analysis, By Type, 2015 and 2024 (%)
Figure 4 Global ITOSM Market Analysis, By Industry Verticals, 2015 and 2024 (%)
Figure 5 Company Share (%)
Figure 6 North America ITOSM Market Revenue, 2015 and 2024 (US$ Bn) and Y-o-Y Growth (%)
Figure 7 North America ITOSM Market Share Analysis, By Type, 2015 and 2024 (%)
Figure 8 North America ITOM Market Share Analysis, By Type, 2015 and 2024 (%)
Figure 9 North America ITOSM Market Analysis, By Industry Verticals, 2015 and 2024 (%)
Figure 10 Europe ITOSM Market Revenue, 2015 and 2024 (US$ Bn) and Y-o-Y Growth (%)
Figure 11 Europe ITOSM Market Share Analysis, By Type, 2015 and 2024 (%)
Figure 12 Europe ITOM Market Share Analysis, By Type, 2015 and 2024 (%)
Figure 13 Europe ITOSM Market Analysis, By Industry Verticals, 2015 and 2024 (%)
Figure 14 Asia Pacific ITOSM Market Revenue, 2015 and 2024 (US$ Bn) and Y-o-Y Growth (%)
Figure 15 Asia Pacific ITOSM Market Share Analysis, By Type, 2015 and 2024 (%)
Figure 16 Asia Pacific ITOM Market Share Analysis, By Type, 2015 and 2024 (%)
Figure 17 Asia Pacific ITOSM Market Analysis, By Industry Verticals, 2015 and 2024 (%)
Figure 18 MEA ITOSM Market Revenue, 2015 and 2024 (US$ Bn) and Y-o-Y Growth (%)
Figure 19 MEA ITOSM Market Share Analysis, By Type, 2015 and 2024 (%)
Figure 20 MEA ITOM Market Share Analysis, By Type, 2015 and 2024 (%)
Figure 21 MEA ITOSM Market Analysis, By Industry Verticals, 2015 and 2024 (%)
Figure 22 Latin America ITOSM Market Revenue, 2015 and 2024 (US$ Bn) and Y-o-Y Growth (%)
Figure 23 Latin America ITOSM Market Share Analysis, By Type, 2015 and 2024 (%)
Figure 24 Latin America ITOM Market Share Analysis, By Type, 2015 and 2024 (%)
Figure 25 Latin America ITOSM Market Share Analysis, By Industry Verticals, 2015 and 2024 (%)
Figure 26 North America ITOSM Market Share Analysis, Country Snippets, 2015 and 2024 (%)
Figure 27 Europe ITOSM Market Share Analysis, By Country Snippets, 2015 and 2024 (%)
Figure 28 Asia Pacific ITOSM Market Share Analysis, By Country Snippets, 2015 and 2024 (%)
Figure 29 MEA ITOSM Market Share Analysis, By Country Snippets, 2015 and 2024 (%)
Figure 30 Latin America ITOSM Market Share Analysis, By Country Snippets, 2015 and 2024 (%)
Copyright © Transparency Market Research, Inc. All Rights reserved
Trust Online

IT Operations and Service Management (ITOSM) Market