
Reports
Reports
Global Interactive Projectors Market: Snapshot
With the rising trend of interactive learning in the education sector, the demand for interactive projectors has increased substantially across the sales of interactive projectors, globally, leading to noticeable rise in the global market for interactive projectors. Over the coming years, the constant technological advancements in the education, as well as the corporate sectors will continue to support this market considerably. The increasing trend to optimize the training costs among companies, in a bid to improve employee productivity, is also projected to add to the growth of this market over the next few years.
The global interactive projectors market stood at US$0.99 bn in 2016. Progressing at a robust CAGR of 21.80% between 2017 and 2025, the market is likely to reach US$5.97 bn by 2025 end.
Demand for Ultra-short Throw to Remain Strong
The global market for interactive projectors is analyzed on the basis of the product type and the application. Based on the product type the market has been classified into ultra-short throw, short throw, and standard throw. The demand for ultra-short throw is greater than other products and the trend is expected to continue in the years to come.
Based on the Application, the market is segmented into the education, corporate, and the government sector. Among these, the education sector holds the leading position and is projected to remain doing so over the forthcoming years, thanks to the increasing uptake of advanced technologies by educational institutes and the rising trend of interactive learning.
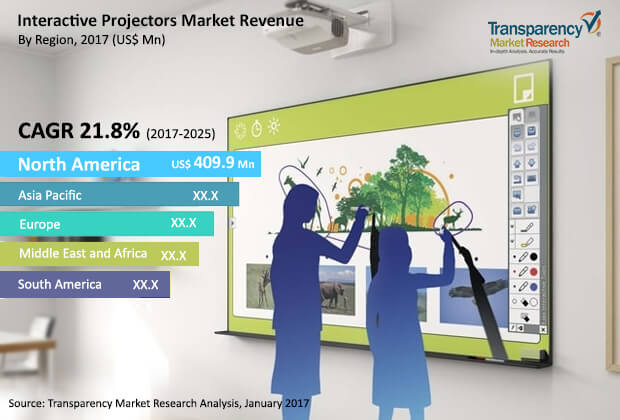
North America to Continue on Top
The worldwide interactive projectors market has been classified into five geographical segments, namely, North America, Europe, Asia Pacific, the Middle East and Africa, and South America. Among these, North America has been the leader and is expected to remain dominant over the forecast period, thanks to the presence of a number of technologically advanced and feature-rich products in a bid to improve the productivity and the meeting room experience. The presence of a large pool of interactive projector providers in the region is also supporting the North America market for interactive projectors.
In addition, the rising demand for interactive projectors and the increasing technological developments are expected to boost this regional market in the years to come. The advent of faster telecommunication technologies and networking and the increasing government support to education sector, in terms of funding, are also projected to boost the interactive projectors market in the region over the next few years. Among others, the Asia Pacific market for interactive projectors is anticipated to report a significant growth over the forthcoming years, rising at a CAGR of 24.30% between 2017 and 2025. The increasing consumer awareness and the gradual increase in government spending on the education sector are expected to aid this regional market in the near future.
The global market for interactive projectors is highly competitive. The leading companies are emphasizing on technological advancements to strengthen their position in this market. Dell Technologies Inc., Optoma Technology Inc., Hitachi Ltd., BenQ Corp., Sony Corp., Touchjet Inc., Seiko Epson Corp., Boxlight Mimio, Panasonic Corp., and NEC Display Solutions are some of the prominent vendors of interactive projectors across the world.
1. Preface
1.1. Market Definition and Scope
1.2. Market Segmentation
1.3. Key Research Objectives
1.4. Research Highlights
2. Assumptions and Research Methodology
3. Executive Summary : Global Interactive projectors Market
4. Market Overview
4.1. Introduction
4.2. Market Dynamics
4.2.1. Drivers
4.2.2. Restraints
4.2.3. Opportunities
4.3. Market Indicators
4.4. Global Interactive projectors Market Analysis and Forecasts, 2015 – 2025
4.4.1. Market Revenue Projections (US$ Mn & Thousand Units)
4.4.2. Market Volume Projections (Thousand Units)
4.5. Porter’s Five Force Model
4.6. Ecosystem Analysis
4.7. Market Outlook
5. Global Interactive projectors Market Analysis and Forecasts, By Product Type
5.1. Overview & Definitions
5.2. Market Size (US$ Mn & Thousand Units) Forecast By Product Type, 2015 – 2025
5.2.1. Ultra Short Throw
5.2.2. Short Throw
5.2.3. Standard Throw
5.3. Market Attractiveness By Product Type
6. Global Interactive projectors Market Analysis and Forecasts, By Application
6.1. Overview & Definitions
6.2. Market Size (US$ Mn & Thousand Units) Forecast By Application, 2015 – 2025
6.2.1. Education
6.2.2. Corporate
6.2.3. Government
6.3. Market Attractiveness By Application
7. Global Interactive projectors Market Analysis and Forecasts, By Region
7.1. Key Findings
7.2. Market Size (US$ Mn & Thousand Units) Forecast By Region, 2015 – 2025
7.2.1. North America
7.2.2. Europe
7.2.3. Asia Pacific
7.2.4. Middle East and Africa
7.2.5. South America
7.3. Market Attractiveness By Country/Region
8. North America Interactive projectors Market Analysis and Forecast
8.1. Key Trends
8.2. Market Size (US$ Mn & Thousand Units) Forecast By Product Type, 2015 – 2025
8.2.1. Ultra Short Throw
8.2.2. Short Throw
8.2.3. Standard Throw
8.3. Market Size (US$ Mn & Thousand Units) Forecast By Application, 2015 – 2025
8.3.1. Education
8.3.2. Corporate
8.3.3. Government
8.4. Market Size (US$ Mn & Thousand Units) Forecast By Country, 2015 – 2025
8.4.1. The U.S.
8.4.2. Canada
8.4.3. Rest of North America
8.5. The U.S. Interactive projectors Market Analysis and Forecast
8.5.1. Market Size (US$ Mn & Thousand Units) Forecast By Product Type, 2015 – 2025
8.5.1.1. Ultra Short Throw
8.5.1.2. Short Throw
8.5.1.3. Standard Throw
8.5.2. Market Size (US$ Mn & Thousand Units) Forecast By Application, 2015 – 2025
8.5.2.1. Education
8.5.2.2. Corporate
8.5.2.3. Government
8.6. Canada Interactive projectors Market Analysis and Forecast
8.6.1. Market Size (US$ Mn & Thousand Units) Forecast By Product Type, 2015 – 2025
8.6.1.1. Ultra Short Throw
8.6.1.2. Short Throw
8.6.1.3. Standard Throw
8.6.2. Market Size (US$ Mn & Thousand Units) Forecast By Application, 2015 – 2025
8.6.2.1. Education
8.6.2.2. Corporate
8.6.2.3. Government
8.7. Rest of North America Interactive projectors Market Analysis and Forecast
8.7.1. Market Size (US$ Mn & Thousand Units) Forecast By Product Type, 2015 – 2025
8.7.1.1. Ultra Short Throw
8.7.1.2. Short Throw
8.7.1.3. Standard Throw
8.7.2. Market Size (US$ Mn & Thousand Units) Forecast By Application, 2015 – 2025
8.7.2.1. Education
8.7.2.2. Corporate
8.7.2.3. Government
8.8. North America Market Attractiveness Analysis
8.8.1.1. By Product Type
8.8.1.2. By Application
8.8.1.3. By Country
9. Europe Interactive projectors Market Analysis and Forecast
9.1. Key Trends
9.2. Market Size (US$ Mn & Thousand Units) Forecast By Product Type, 2015 – 2025
9.2.1. Ultra Short Throw
9.2.2. Short Throw
9.2.3. Standard Throw
9.3. Market Size (US$ Mn & Thousand Units) Forecast By Application, 2015 – 2025
9.3.1. Education
9.3.2. Corporate
9.3.3. Government
9.4. Market Size (US$ Mn & Thousand Units) Forecast By Country, 2015 – 2025
9.4.1. The U.K.
9.4.2. Germany
9.4.3. France
9.4.4. Rest of Europe
9.5. The U.K. Interactive projectors Market Analysis and Forecast
9.5.1. Market Size (US$ Mn & Thousand Units) Forecast By Product Type, 2015 – 2025
9.5.1.1. Ultra Short Throw
9.5.1.2. Short Throw
9.5.1.3. Standard Throw
9.5.2. Market Size (US$ Mn & Thousand Units) Forecast By Application, 2015 – 2025
9.5.2.1. Education
9.5.2.2. Corporate
9.5.2.3. Government
9.6. Germany Interactive projectors Market Analysis and Forecast
9.6.1. Market Size (US$ Mn & Thousand Units) Forecast By Product Type, 2015 – 2025
9.6.1.1. Ultra Short Throw
9.6.1.2. Short Throw
9.6.1.3. Standard Throw
9.6.2. Market Size (US$ Mn & Thousand Units) Forecast By Application, 2015 – 2025
9.6.2.1. Education
9.6.2.2. Corporate
9.6.2.3. Government
9.7. France Interactive projectors Market Analysis and Forecast
9.7.1. Market Size (US$ Mn & Thousand Units) Forecast By Product Type, 2015 – 2025
9.7.1.1. Ultra Short Throw
9.7.1.2. Short Throw
9.7.1.3. Standard Throw
9.7.2. Market Size (US$ Mn & Thousand Units) Forecast By Application, 2015 – 2025
9.7.2.1. Education
9.7.2.2. Corporate
9.7.2.3. Government
9.8. Rest of Europe Interactive projectors Market Analysis and Forecast
9.8.1. Market Size (US$ Mn & Thousand Units) Forecast By Product Type, 2015 – 2025
9.8.1.1. Ultra Short Throw
9.8.1.2. Short Throw
9.8.1.3. Standard Throw
9.8.2. Market Size (US$ Mn & Thousand Units) Forecast By Application, 2015 – 2025
9.8.2.1. Education
9.8.2.2. Corporate
9.8.2.3. Government
9.9. Europe Market Attractiveness Analysis
9.9.1. By Product Type
9.9.2. By Application
9.9.3. By Country
10. Asia Pacific Interactive projectors Market Analysis and Forecast
10.1. Key Trends
10.2. Market Size (US$ Mn & Thousand Units) Forecast By Product Type, 2015 – 2025
10.2.1. Ultra Short Throw
10.2.2. Short Throw
10.2.3. Standard Throw
10.3. Market Size (US$ Mn & Thousand Units) Forecast By Application, 2015 – 2025
10.3.1. Education
10.3.2. Corporate
10.3.3. Government
10.4. Market Size (US$ Mn & Thousand Units) Forecast By Country, 2015 – 2025
10.4.1. China
10.4.2. India
10.4.3. Japan
10.4.4. Rest of Asia Pacific
10.5. China Interactive projectors Market Analysis and Forecast
10.5.1. Market Size (US$ Mn & Thousand Units) Forecast By Product Type, 2015 – 2025
10.5.1.1. Ultra Short Throw
10.5.1.2. Short Throw
10.5.1.3. Standard Throw
10.5.2. Market Size (US$ Mn & Thousand Units) Forecast By Application, 2015 – 2025
10.5.2.1. Education
10.5.2.2. Corporate
10.5.2.3. Government
10.6. India Interactive projectors Market Analysis and Forecast
10.6.1. Market Size (US$ Mn & Thousand Units) Forecast By Product Type, 2015 – 2025
10.6.1.1. Ultra Short Throw
10.6.1.2. Short Throw
10.6.1.3. Standard Throw
10.6.2. Market Size (US$ Mn & Thousand Units) Forecast By Application, 2015 – 2025
10.6.2.1. Education
10.6.2.2. Corporate
10.6.2.3. Government
10.7. Japan Interactive projectors Market Analysis and Forecast
10.7.1. Market Size (US$ Mn & Thousand Units) Forecast By Product Type, 2015 – 2025
10.7.1.1. Ultra Short Throw
10.7.1.2. Short Throw
10.7.1.3. Standard Throw
10.7.2. Market Size (US$ Mn & Thousand Units) Forecast By Application, 2015 – 2025
10.7.2.1. Education
10.7.2.2. Corporate
10.7.2.3. Government
10.8. Rest of Asia Pacific Interactive projectors Market Analysis and Forecast
10.8.1. Market Size (US$ Mn & Thousand Units) Forecast By Product Type, 2015 – 2025
10.8.1.1. Ultra Short Throw
10.8.1.2. Short Throw
10.8.1.3. Standard Throw
10.8.2. Market Size (US$ Mn & Thousand Units) Forecast By Application, 2015 – 2025
10.8.2.1. Education
10.8.2.2. Corporate
10.8.2.3. Government
10.9. Asia Pacific Market Attractiveness Analysis
10.9.1. By Product Type
10.9.2. By Application
10.9.3. By Country
11. Middle East and Africa (MEA) Interactive projectors Market Analysis and Forecast
11.1. Key Trends
11.2. Market Size (US$ Mn & Thousand Units) Forecast By Product Type, 2015 – 2025
11.2.1. Ultra Short Throw
11.2.2. Short Throw
11.2.3. Standard Throw
11.3. Market Size (US$ Mn & Thousand Units) Forecast By Application, 2015 – 2025
11.3.1. Education
11.3.2. Corporate
11.3.3. Government
11.4. Market Size (US$ Mn & Thousand Units) Forecast By Country, 2015 – 2025
11.4.1. GCC
11.4.2. South Africa
11.4.3. Rest of Middle East and Africa
11.5. GCC Interactive projectors Market Analysis and Forecast
11.5.1. Market Size (US$ Mn & Thousand Units) Forecast By Product Type, 2015 – 2025
11.5.1.1. Ultra Short Throw
11.5.1.2. Short Throw
11.5.1.3. Standard Throw
11.5.2. Market Size (US$ Mn & Thousand Units) Forecast By Application, 2015 – 2025
11.5.2.1. Education
11.5.2.2. Corporate
11.5.2.3. Government
11.6. South Africa Interactive projectors Market Analysis and Forecast
11.6.1. Market Size (US$ Mn & Thousand Units) Forecast By Product Type, 2015 – 2025
11.6.1.1. Ultra Short Throw
11.6.1.2. Short Throw
11.6.1.3. Standard Throw
11.6.2. Market Size (US$ Mn & Thousand Units) Forecast By Application, 2015 – 2025
11.6.2.1. Education
11.6.2.2. Corporate
11.6.2.3. Government
11.7. Rest of Middle East and Africa Interactive projectors Market Analysis and Forecast
11.7.1. Market Size (US$ Mn & Thousand Units) Forecast By Product Type, 2015 – 2025
11.7.1.1. Ultra Short Throw
11.7.1.2. Short Throw
11.7.1.3. Standard Throw
11.7.2. Market Size (US$ Mn & Thousand Units) Forecast By Application, 2015 – 2025
11.7.2.1. Education
11.7.2.2. Corporate
11.7.2.3. Government
11.8. Middle East and Africa Market Attractiveness Analysis
11.8.1. By Product Type
11.8.2. By Application
11.8.3. By Country
12. South America Interactive projectors Market Analysis and Forecast
12.1. Key Trends
12.2. Market Size (US$ Mn & Thousand Units) Forecast By Product Type, 2015 – 2025
12.2.1. Ultra Short Throw
12.2.2. Short Throw
12.2.3. Standard Throw
12.3. Market Size (US$ Mn & Thousand Units) Forecast By Application, 2015 – 2025
12.3.1. Education
12.3.2. Corporate
12.3.3. Government
12.4. Market Size (US$ Mn & Thousand Units) Forecast By Country, 2015 – 2025
12.4.1. Brazil
12.4.2. Rest of South America
12.5. Brazil Interactive projectors Market Analysis and Forecast
12.5.1. Market Size (US$ Mn & Thousand Units) Forecast By Product Type, 2015 – 2025
12.5.1.1. Ultra Short Throw
12.5.1.2. Short Throw
12.5.1.3. Standard Throw
12.5.2. Market Size (US$ Mn & Thousand Units) Forecast By Application, 2015 – 2025
12.5.2.1. Education
12.5.2.2. Corporate
12.5.2.3. Government
12.6. Rest of South America Interactive projectors Market Analysis and Forecast
12.7.1. Market Size (US$ Mn & Thousand Units) Forecast By Product Type, 2015 – 2025
12.7.1.1. Ultra Short Throw
12.7.1.2. Short Throw
12.7.1.3. Standard Throw
12.7.2. Market Size (US$ Mn & Thousand Units) Forecast By Application, 2015 – 2025
12.7.2.1. Education
12.7.2.2. Corporate
12.7.2.3. Government
12.8. South America Market Attractiveness Analysis
12.8.1. By Product Type
12.8.2. By Application
12.8.3. By Country
13. Competition Landscape
13.7. Market Player – Competition Matrix
13.8. Market Share Analysis By Company (2016)
13.9. Company Profiles (Details – Overview, Financials, Recent Developments, SWOT, Strategy)
13.9.1. Seiko Epson Corporation
13.9.2. BenQ Corporation
13.9.3. Touchjet Inc.
13.9.4. Dell Technologies Inc.
13.9.5. Optoma Technology Inc.
13.9.6. Panasonic Corporation
13.9.7. Hitachi Ltd.
13.9.8. Sony Corporation
13.9.9. Boxlight Mimio
13.9.10. NEC Display Solutions
14. Key Takeaways
List of Tables
Table 01: Global Interactive projectors Market Size (US$ Mn & Thousand Units) Forecast, By Product Type, 2015–2025
Table 02: Global Interactive projectors Market Size (US$ Mn & Thousand Units) Forecast, By Industry Vertical, 2015–2025
Table 03: Global Interactive projectors Market Size (US$ Mn & Thousand Units) Forecast, By Industry Vertical, 2015–2025
Table 04: Global Interactive projectors Market Size (US$ Mn & Thousand Units) Forecast, By Region, 2015–2025
Table 05: North America Interactive projectors Market Size (US$ Mn & Thousand Units) Forecast, By Product Type, 2015–2025
Table 06: North America Interactive projectors Market Size (US$ Mn & Thousand Units) Forecast, By Industry Vertical, 2015–2025
Table 07: North America Interactive projectors Market Size (US$ Mn & Thousand Units) Forecast, By Industry Vertical, 2015–2025
Table 08: North America Interactive projectors Market Size (US$ Mn & Thousand Units) Forecast, By Country/Region, 2015–2025
Table 09: The U.S. Interactive projectors Market Size (US$ Mn & Thousand Units) Forecast, By Product Type, 2015–2025
Table 10: The U.S. Interactive projectors Market Size (US$ Mn & Thousand Units) Forecast, By Industry Vertical, 2015–2025
Table 11: The U.S. Interactive projectors Market Size (US$ Mn & Thousand Units) Forecast, By Industry Vertical, 2015–2025
Table 12: Canada Interactive projectors Market Size (US$ Mn & Thousand Units) Forecast, By Product Type, 2015–2025
Table 13: Canada Interactive projectors Market Size (US$ Mn & Thousand Units) Forecast, By Industry Vertical, 2015–2025
Table 14: Canada Interactive projectors Market Size (US$ Mn & Thousand Units) Forecast, By Industry Vertical, 2015–2025
Table 15: Rest of North America Interactive projectors Market Size (US$ Mn & Thousand Units) Forecast, By Product Type, 2015–2025
Table 16: Rest of North America Interactive projectors Market Size (US$ Mn & Thousand Units) Forecast, By Industry Vertical, 2015–2025
Table 17: Rest of North America Interactive projectors Market Size (US$ Mn & Thousand Units) Forecast, By Industry Vertical, 2015–2025
Table 18: Europe Interactive projectors Market Size (US$ Mn & Thousand Units) Forecast, By Product Type, 2015–2025
Table 19: Europe Interactive projectors Market Size (US$ Mn & Thousand Units) Forecast, By Industry Vertical, 2015–2025
Table 20: Europe Interactive projectors Market Size (US$ Mn & Thousand Units) Forecast, By Industry Vertical, 2015–2025
Table 21: Europe Interactive projectors Market Size (US$ Mn & Thousand Units) Forecast, By Country/Region, 2015–2025
Table 22: The U.K. Interactive projectors Market Size (US$ Mn & Thousand Units) Forecast, By Product Type, 2015–2025
Table 23: The U.K. Interactive projectors Market Size (US$ Mn & Thousand Units) Forecast, By Industry Vertical, 2015–2025
Table 24: The U.K. Interactive projectors Market Size (US$ Mn & Thousand Units) Forecast, By Industry Vertical, 2015–2025
Table 25: Germany Interactive projectors Market Size (US$ Mn & Thousand Units) Forecast, By Product Type, 2015–2025
Table 26: Germany Interactive projectors Market Size (US$ Mn & Thousand Units) Forecast, By Industry Vertical, 2015–2025
Table 27: Germany Interactive projectors Market Size (US$ Mn & Thousand Units) Forecast, By Industry Vertical, 2015–2025
Table 28: France Interactive projectors Market Size (US$ Mn & Thousand Units) Forecast, By Product Type, 2015–2025
Table 29: France Interactive projectors Market Size (US$ Mn & Thousand Units) Forecast, By Industry Vertical, 2015–2025
Table 30: France Interactive projectors Market Size (US$ Mn & Thousand Units) Forecast, By Industry Vertical, 2015–2025
Table 31: Rest of Europe Interactive projectors Market Size (US$ Mn & Thousand Units) Forecast, By Product Type, 2015–2025
Table 32: Rest of Europe Interactive projectors Market Size (US$ Mn & Thousand Units) Forecast, By Industry Vertical, 2015–2025
Table 33: Rest of Europe Interactive projectors Market Size (US$ Mn & Thousand Units) Forecast, By Industry Vertical, 2015–2025
Table 34: Asia Pacific Interactive projectors Market Size (US$ Mn & Thousand Units) Forecast, By Product Type, 2015–2025
Table 35: Asia Pacific Interactive projectors Market Size (US$ Mn & Thousand Units) Forecast, By Industry Vertical, 2015–2025
Table 36: Asia Pacific Interactive projectors Market Size (US$ Mn & Thousand Units) Forecast, By Industry Vertical, 2015–2025
Table 37: Asia Pacific Interactive projectors Market Size (US$ Mn & Thousand Units) Forecast, By Country/Region, 2015–2025
Table 38: China Interactive projectors Market Size (US$ Mn & Thousand Units) Forecast, By Product Type, 2015–2025
Table 39: China Interactive projectors Market Size (US$ Mn & Thousand Units) Forecast, By Industry Vertical, 2015–2025
Table 40: China Interactive projectors Market Size (US$ Mn & Thousand Units) Forecast, By Industry Vertical, 2015–2025
Table 41: India Interactive projectors Market Size (US$ Mn & Thousand Units) Forecast, By Product Type, 2015–2025
Table 42: India Interactive projectors Market Size (US$ Mn & Thousand Units) Forecast, By Industry Vertical, 2015–2025
Table 43: India Interactive projectors Market Size (US$ Mn & Thousand Units) Forecast, By Industry Vertical, 2015–2025
Table 44: Japan Interactive projectors Market Size (US$ Mn & Thousand Units) Forecast, By Product Type, 2015–2025
Table 45: Japan Interactive projectors Market Size (US$ Mn & Thousand Units) Forecast, By Industry Vertical, 2015–2025
Table 46: Japan Interactive projectors Market Size (US$ Mn & Thousand Units) Forecast, By Industry Vertical, 2015–2025
Table 47: Rest of Asia Pacific Interactive projectors Market Size (US$ Mn & Thousand Units) Forecast, By Product Type, 2015–2025
Table 48: Rest of Asia Pacific Interactive projectors Market Size (US$ Mn & Thousand Units) Forecast, By Industry Vertical, 2015–2025
Table 49: Rest of Asia Pacific Interactive projectors Market Size (US$ Mn & Thousand Units) Forecast, By Industry Vertical, 2015–2025
Table 50: Middle East and Africa Interactive projectors Market Size (US$ Mn & Thousand Units) Forecast, By Product Type, 2015–2025
Table 51: Middle East and Africa Interactive projectors Market Size (US$ Mn & Thousand Units) Forecast, By Industry Vertical, 2015–2025
Table 52: Middle East and Africa Interactive projectors Market Size (US$ Mn & Thousand Units) Forecast, By Industry Vertical, 2015–2025
Table 53: Middle East and Africa Interactive projectors Market Size (US$ Mn & Thousand Units) Forecast, By Country/Region, 2015–2025
Table 54: GCC Interactive projectors Market Size (US$ Mn & Thousand Units) Forecast, By Product Type, 2015–2025
Table 55: GCC Interactive projectors Market Size (US$ Mn & Thousand Units) Forecast, By Industry Vertical, 2015–2025
Table 56: GCC Interactive projectors Market Size (US$ Mn & Thousand Units) Forecast, By Industry Vertical, 2015–2025
Table 57: South Africa Interactive projectors Market Size (US$ Mn & Thousand Units) Forecast, By Product Type, 2015–2025
Table 58: South Africa Interactive projectors Market Size (US$ Mn & Thousand Units) Forecast, By Industry Vertical, 2015–2025
Table 59: South Africa Interactive projectors Market Size (US$ Mn & Thousand Units) Forecast, By Industry Vertical, 2015–2025
Table 60: Rest of Middle East and Africa Interactive projectors Market Size (US$ Mn & Thousand Units) Forecast, By Product Type, 2015–2025
Table 61: Rest of Middle East and Africa Interactive projectors Market Size (US$ Mn & Thousand Units) Forecast, By Industry Vertical, 2015–2025
Table 62: Rest of Middle East and Africa Interactive projectors Market Size (US$ Mn & Thousand Units) Forecast, By Industry Vertical, 2015–2025
Table 63: South America Interactive projectors Market Size (US$ Mn & Thousand Units) Forecast, By Product Type, 2015–2025
Table 64: South America Interactive projectors Market Size (US$ Mn & Thousand Units) Forecast, By Industry Vertical, 2015–2025
Table 65: South America Interactive projectors Market Size (US$ Mn & Thousand Units) Forecast, By Industry Vertical, 2015–2025
Table 66: South America Interactive projectors Market Size (US$ Mn & Thousand Units) Forecast, By Country/Region, 2015–2025
Table 67: Brazil Interactive projectors Market Size (US$ Mn & Thousand Units) Forecast, By Product Type, 2015–2025
Table 68: Brazil Interactive projectors Market Size (US$ Mn & Thousand Units) Forecast, By Industry Vertical, 2015–2025
Table 69: Brazil Interactive projectors Market Size (US$ Mn & Thousand Units) Forecast, By Industry Vertical, 2015–2025
Table 70: Rest of South America Interactive projectors Market Size (US$ Mn & Thousand Units) Forecast, By Product Type, 2015–2025
Table 71: Rest of South America Interactive projectors Market Size (US$ Mn & Thousand Units) Forecast, By Industry Vertical, 2015–2025
Table 72: Rest of South America Interactive projectors Market Size (US$ Mn & Thousand Units) Forecast, By Industry Vertical, 2015–2025
List of Figures
Figure 01: Global Interactive projectors Market Size (US$ Mn & Thousand Units) Forecast, 2015 - 2025
Figure 02: Global Interactive projectors Market Y-o-Y Growth (Value %) Forecast, 2016 - 2025
Figure 03: Market Revenue (US$ Mn & Thousand Units) Growth Analysis By Product Type, 2017-2025
Figure 04: Market Revenue (US$ Mn & Thousand Units) Growth Analysis By Industry Vertical, 2017-2025
Figure 05: Market Revenue (US$ Mn & Thousand Units) Growth Analysis By Region, 2017-2025
Figure 06: Global Interactive projectors Market Revenue Share Analysis, By Product Type, 2017 and 2025
Figure 07: Global Interactive projectors Market Attractiveness Analysis By, Product Type
Figure 08: Global Interactive projectors Market Revenue Share Analysis, By Industry Vertical, 2017 and 2025
Figure 09: Global Connected Logistics Market Attractiveness Analysis, By Industry Vertical
Figure 10: Global Interactive projectors Market Revenue Share Analysis, By Region, 2017 and 2025
Figure 11: Global Interactive projectors Market Attractiveness Analysis, By Region
Figure 12: North America Interactive projectors Market Size (US$ Mn & Thousand Units) Forecast, 2015–2025
Figure 13: North America Interactive projectors Market Size Y-o-Y Growth Projections, 2016–2025
Figure 14: North America Interactive projectors Market Revenue Share Analysis, By Product Type, 2017 and 2025
Figure 15: North America Interactive projectors Market Revenue Share Analysis, By Industry Vertical, 2017 and 2025
Figure 16: North America Interactive projectors Market Revenue Share Analysis, By Country/Region, 2017 and 2025
Figure 17: The U.S. Interactive projectors Market Revenue Share Analysis, By Product Type, 2017 and 2025
Figure 18: The U.S. Interactive projectors Market Revenue Share Analysis, By Industry Vertical, 2017 and 2025
Figure 19: The U.S. Interactive projectors Market Attractiveness Analysis By Product Type
Figure 20: The U.S. Interactive projectors Market Attractiveness Analysis By Industry Vertical
Figure 21: North America Interactive projectors Market Revenue Share Analysis, By Product Type, 2017 and 2025
Figure 22: Canada Interactive projectors Market Revenue Share Analysis, By Industry Vertical, 2017 and 2025
Figure 23: Canada Interactive projectors Market Attractiveness Analysis By Product Type
Figure 24: Canada Interactive projectors Market Attractiveness Analysis By Industry Vertical
Figure 25: North America Interactive projectors Market Attractiveness Analysis By Product Type
Figure 26: North America Interactive projectors Market Attractiveness Analysis By Industry Vertical
Figure 27: North America Interactive projectors Market Attractiveness Analysis, By Country/Region
Figure 28: Europe Interactive projectors Market Size (US$ Mn & Thousand Units) Forecast, 2015–2025
Figure 29: Europe Interactive projectors Market Size Y-o-Y Growth Projections, 2016–2025
Figure 30: Europe Interactive projectors Market Revenue Share Analysis, By Product Type, 2017 and 2025
Figure 31: Europe Interactive projectors Market Revenue Share Analysis, By Industry Vertical, 2017 and 2025
Figure 32: Europe Interactive projectors Market Revenue Share Analysis, By Country/Region, 2017 and 2025
Figure 33: The U.K. Interactive projectors Market Revenue Share Analysis, By Product Type, 2017 and 2025
Figure 34: The U.K. Interactive projectors Market Revenue Share Analysis, By Industry Vertical, 2017 and 2025
Figure 35: The U.K. Interactive projectors Market Attractiveness Analysis By Product Type
Figure 36: The U.K. Interactive projectors Market Attractiveness Analysis By Industry Vertical
Figure 37: Germany Interactive projectors Market Revenue Share Analysis, By Product Type, 2017 and 2025
Figure 38: Germany Interactive projectors Market Revenue Share Analysis, By Industry Vertical, 2017 and 2025
Figure 39: Germany Interactive projectors Market Attractiveness Analysis By Product Type
Figure 40: Germany Interactive projectors Market Attractiveness Analysis By Industry Vertical
Figure 41: France Interactive projectors Market Revenue Share Analysis, By Product Type, 2017 and 2025
Figure 42: France Interactive projectors Market Revenue Share Analysis, By Industry Vertical, 2017 and 2025
Figure 43: France Interactive projectors Market Attractiveness Analysis By Product Type
Figure 44: France Interactive projectors Market Attractiveness Analysis By Industry Vertical
Figure 45: Europe Interactive projectors Market Attractiveness Analysis By Product Type
Figure 46: Europe Interactive projectors Market Attractiveness Analysis By Industry Vertical
Figure 47: Europe Interactive projectors Market Attractiveness Analysis, By Country/Region
Figure 48: Asia Pacific Interactive projectors Market Size (US$ Mn & Thousand Units) Forecast, 2015–2025
Figure 49: Asia Pacific Interactive projectors Market Size Y-o-Y Growth Projections, 2016–2025
Figure 50: Asia Pacific Interactive projectors Market Revenue Share Analysis, By Product Type, 2017 and 2025
Figure 51: Asia Pacific Interactive projectors Market Revenue Share Analysis, By Industry Vertical, 2017 and 2025
Figure 52: Asia Pacific Interactive projectors Market Revenue Share Analysis, By Country/Region, 2017 and 2025
Figure 53: China Interactive projectors Market Revenue Share Analysis, By Product Type, 2017 and 2025
Figure 54: China Interactive projectors Market Revenue Share Analysis, By Industry Vertical, 2017 and 2025
Figure 55: China Interactive projectors Market Attractiveness Analysis By Product Type
Figure 56: China Interactive projectors Market Attractiveness Analysis By Industry Vertical
Figure 57: India Interactive projectors Market Revenue Share Analysis, By Product Type, 2017 and 2025
Figure 58: India Interactive projectors Market Revenue Share Analysis, By Industry Vertical, 2017 and 2025
Figure 59: India Interactive projectors Market Attractiveness Analysis By Product Type
Figure 60: India Interactive projectors Market Attractiveness Analysis By Industry Vertical
Figure 61: Japan Interactive projectors Market Revenue Share Analysis, By Product Type, 2017 and 2025
Figure 62: Japan Interactive projectors Market Revenue Share Analysis, By Industry Vertical, 2017 and 2025
Figure 63: Japan Interactive projectors Market Attractiveness Analysis By Product Type
Figure 64: Japan Interactive projectors Market Attractiveness Analysis By Industry Vertical
Figure 65: Asia Pacific Interactive projectors Market Attractiveness Analysis By Product Type
Figure 66: Asia Pacific Interactive projectors Market Attractiveness Analysis By Industry Vertical
Figure 67: Asia Pacific Interactive projectors Market Attractiveness Analysis, By Country/Region
Figure 68: Middle East and Africa Interactive projectors Market Size (US$ Mn & Thousand Units) Forecast, 2015–2025
Figure 69: Middle East and Africa Interactive projectors Market Size Y-o-Y Growth Projections, 2016–2025
Figure 70: Middle East and Africa Interactive projectors Market Revenue Share Analysis, By Product Type, 2017 and 2025
Figure 71: Middle East and Africa Interactive projectors Market Revenue Share Analysis, By Industry Vertical, 2017 and 2025
Figure 72: Middle East and Africa Interactive projectors Market Revenue Share Analysis, By Country/Region, 2017 and 2025
Figure 73: GCC Interactive projectors Market Revenue Share Analysis, By Product Type, 2017 and 2025
Figure 74: GCC Interactive projectors Market Revenue Share Analysis, By Industry Vertical, 2017 and 2025
Figure 75: GCC Interactive projectors Market Attractiveness Analysis By Product Type
Figure 76: GCC Interactive projectors Market Attractiveness Analysis By Industry Vertical
Figure 77: South Africa Interactive projectors Market Revenue Share Analysis, By Product Type, 2017 and 2025
Figure 78: South Africa Interactive projectors Market Revenue Share Analysis, By Industry Vertical, 2017 and 2025
Figure 79: South Africa Interactive projectors Market Attractiveness Analysis By Product Type
Figure 80: South Africa Interactive projectors Market Attractiveness Analysis By Industry Vertical
Figure 81: Middle East and Africa Interactive projectors Market Attractiveness Analysis By Product Type
Figure 82: Middle East and Africa Interactive projectors Market Attractiveness Analysis By Industry Vertical
Figure 83: Middle East and Africa Interactive projectors Market Attractiveness Analysis, By Country/Region
Figure 84: South America Interactive projectors Market Size (US$ Mn & Thousand Units) Forecast, 2015–2025
Figure 85: South America Interactive projectors Market Size Y-o-Y Growth Projections, 2016–2025
Figure 86: South America Interactive projectors Market Revenue Share Analysis, By Product Type, 2017 and 2025
Figure 87: South America Interactive projectors Market Revenue Share Analysis, By Industry Vertical, 2017 and 2025
Figure 88: South America Interactive projectors Market Revenue Share Analysis, By Country/Region, 2017 and 2025
Figure 89: Brazil Interactive projectors Market Revenue Share Analysis, By Product Type, 2017 and 2025
Figure 90: Brazil Interactive projectors Market Revenue Share Analysis, By Industry Vertical, 2017 and 2025
Figure 91: Brazil Interactive projectors Market Attractiveness Analysis By Product Type
Figure 92: Brazil Interactive projectors Market Attractiveness Analysis By Industry Vertical
Figure 93: South America Interactive projectors Market Attractiveness Analysis By Product Type
Figure 94: South America Interactive projectors Market Attractiveness Analysis By Industry Vertical
Figure 95: South America Interactive projectors Market Attractiveness Analysis, By Country/Region
Figure 96: Interactive projectors Market Share Analysis By Company (2016)
Copyright © Transparency Market Research, Inc. All Rights reserved
Trust Online

Interactive Projectors Market Global Forecast to 2025