
Reports
Reports
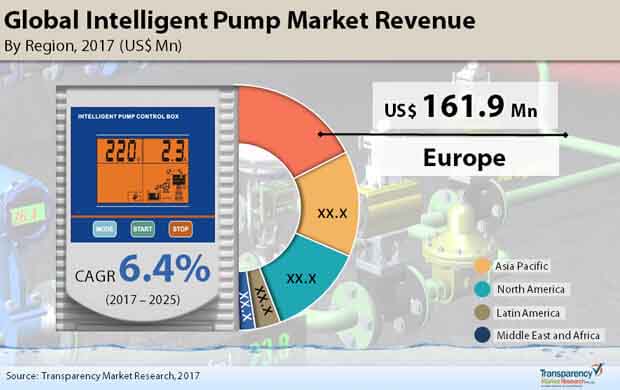
Global Intelligent Pumps Market: Snapshot
Intelligent pumps provide operational efficiency by automating regulation and control of the flow or pressure of water or other fluids. They also offer real-time operating data on the pumping equipment. As a result, they eliminate the need for maintenance staff to repair and monitor the equipment. Such advantages have steadily driven the sales of intelligent pumps despite the high cost of installing them. Besides, constant thrust on product development by key players in order to steal a march over their competitors is also boosting the market.
Currently, the global intelligent pump market is fragmented in nature due to the presence of a large number of regional and international players of various sizes. The players are seen banking upon strategic collaborations and also building proper distribution channels to drive sales and bolster their positions.
A study by Transparency Market Research forecasts the global intelligent pumps market to attain a value of US$748.5 mn by 2025 from US$424.4 mn in 2016 by clocking a CAGR of 6.4% from 2017 to 2025.
Variable Speed Drives Dominate Market due to their Crucial Role in Automating Fluid Flow
Depending upon the type of component, the global intelligent pumps market can be segmented into pump motor, variable speed drive, control system, etc. Of them, the segment of variable speed drive accounted for about 40.0% share in the market in 2016. This is because variable-frequency drive or variable-speed drive, which regulates the speed and rotational force (or torque output) of an electric motor, helps to automate the process of the fluid travelling inside a pipeline. The variable speed drive can be further divided into high quality variable speed drive and low quality variable speed drive.
Based on application, the global intelligent pumps market can be divided into buildings, industry, water utility, etc. Of them, the industrial segment led the market with maximum share – about 70.0% in 2016. It was trailed by water-utility segment, which is further divided into water supply, waste water, and others.
Cheap Intelligent Pumps Manufactured in China Propels Asia Pacific Market
From a geographical standpoint, Europe is the dominant region in the global intelligent pumps market. In 2016, its dominant share came to about 35.0%. By rising at a CAGR of 5.8% in the forecast period, the region is expected to grow its leading share owing to the strong demand for clean drinking water which in turn require intelligent pumps. The TMR report predicts the region to pull in a revenue to the tune of US$253.5 by 2025-end.
In terms of growth rate, Asia Pacific is expected to surpass all other regions by clocking a CAGR of 7.3% between 2017 and 2025. China is said to be primarily powering growth in the region. This is because the country is one of the major exporters of cheap pumps to the Middle East and Africa, which does not have domestic manufacturing bases for pumps. Apart from China, India is another key market in the region. Government investments in industrialization and urbanization is expected to boost the intelligent pumps market in the region. Besides, thrust on overhauling antiquated agricultural methods is also serving to catalyze growth in the market in India.
Because of the high cost of manufacturing intelligent pumps in Europe and America, their markets are losing share to Asia Pacific. Helping to overcome that challenge, to a degree, is the constant investments in product development.
Some of the key participants in the global intelligent pumps market are Grundfos Holding A/S, Goulds Pumps, QuantumFlo, Inc., Kirloskar Brothers Limited, and Alfa Laval.
Energy-efficient and Cost-saving Features to Propel Intelligent Pumps Market
An intelligent pump is a pump that has the capacity to direct control stream or pressing factor. These pumps offer a few benefits like energy investment funds, lifetime enhancements and framework cost decreases. Intelligent pumps include remote control and checking abilities that guide end-clients to get to continuous operational information. Expanding improvement of keen urban communities and severe energy-effectiveness principles is required to drive the water and wastewater portion. This factor is relied upon to set out another freedom for the intelligent pump market during the gauge time frame. In the water and wastewater treatment area, these pumps are utilized for allotment drinking water, switch assimilation cycle, and machine apparatus grease. Exacting administrative standards concerning energy effectiveness additionally start the appropriation of intelligent pumps in the wastewater and water fragment.
The operational efficiency of intelligent pumps is a key factor augmenting the growth of the market for intelligent pumps. Via mechanizing capacities and the control of the pressing factor of the stream or water or different liquids, these pumps diminish the requirement for manual tasks. They likewise give continuous useful information of the pumping gadget, which help with recognizing issues and fix it on schedule to forestall hardware disappointment. The market is additionally acquiring impressively from consistent endeavors by makers to create progressed items, in a bid to accomplish a cutthroat edge over different players.
Solutions for intelligent pumping offers observing controls and digitization, which give more proficiency and energy-saving through, with the commencement of variable recurrence speed drives. The developing requirement for right observing and control of the pumps resulted in the presentation of the intelligent pumps in a wide scope of end-use enterprises.
Via computerizing capacities and the control of the pressing factor of the stream or water or different liquids, these pumps diminish the requirement for manual activities. They additionally give continuous practical information of the pumping gadget, which help with distinguishing deficiencies and fix it on schedule to forestall gear disappointment. The market is additionally acquiring impressively from consistent endeavors by makers to create progressed items, in a bid to accomplish a serious edge over different players.
Intelligent pumping arrangements offers observing controls and digitization, which give more productivity and energy-saving through, with the inception of variable recurrence speed drives. The developing requirement for right observing and control of the pumps resulted in the presentation of the intelligent pumps in a wide scope of end-use businesses.
1. Preface
1.1. Report Scope and Market Segmentation
1.2. Research Highlights
2. Assumptions and Research Methodology
2.1. Assumptions and Acronyms Used
2.2. Research Methodology
3. Executive Summary
3.1. Market Size, Market (US$ Mn)
3.2. Key Trends
3.3. Regional Overview, 2016
4. Market Overview
4.1. Introduction
4.2. Product Overview
4.3. Market Indicator
4.4. Market Dynamics
4.4.1. Driver
5. Global Intelligent pumps Market Analysis by Component
5.1. Introduction and Definition
5.2. Key Trends
5.3. Global Intelligent pumps Market Size (US$ Mn) Forecast, by Component
5.3.1. Pump Motor
5.3.2. Variable Speed Drive
5.3.2.1. High Quality Variable Speed Drive
5.3.2.2. High Quality Variable Speed Drive
5.3.3. Control System
5.3.4. Others
6. Global Intelligent pumps Market Analysis by Application
6.1. Introduction and Definition
6.2. Key Trends
6.3. Global Intelligent pumps Market Size (US$ Mn) Forecast, by Application
6.3.1. Buildings
6.3.1.1. Commercial Buildings
6.3.1.1.1. Heating and Ventilation
6.3.1.1.2. District Heating (distribution network)
6.3.1.1.3. Pressure Boosting
6.3.1.2. Domestic Buildings
6.3.1.2.1. Pressure Boosting
6.3.1.2.2. Wastewater
6.3.1.3. Others
6.3.2. Industry
6.3.2.1. Temperature Control
6.3.2.2. Pressure Boosting
6.3.2.3. Water Supply
6.3.2.4. Wastewater
6.3.2.5. Water Treatment
6.3.2.6. Others
6.3.3. Water Utility (Municipal)
7.3.3.1. Water Supply
6.3.3.1.1. Water Intake
6.3.3.1.2. Water Distribution
6.3.3.1.3. Treatment Plants
6.3.3.2. Wastewater
6.3.3.2.1. Transport Networks
6.3.3.2.2. Treatment Plants
6.3.4. Others
7. Global Intelligent pumps Market Analysis
7.1 Key Findings/Developments/Trends
7.2. Global Intelligent pumps Market Forecast, by Region
7.3. North America
7.3.1. Europe
7.3.2. China
7.3.3. Rest of Asia Pacific
7.3.4. Middle East & Africa
7.3.5. Latin America
8. North America intelligent pumps Market Analysis
8.1. Introduction and Definition
8.2. Key Trend by Type
8.4. North America Intelligent pumps Market Value Share Analysis, by Component
8.5. North America Intelligent pumps Market Value Share Analysis, by Application
8.6 North America Intelligent pumps Market Value Share Analysis, by Country
8.6.1 GCC
8.6.2 South Africa
8.6.5 Rest of Middle East & Africa
9. Europe intelligent pumps Market Analysis
9.1. Introduction and Definition
9.2. Key Trend by Type
9.4. Europe Intelligent pumps Market Value Share Analysis, by Component
9.5. Europe Intelligent pumps Market Value Share Analysis, by Application
9.6 Europe Intelligent pumps Market Value Share Analysis, by Country
9.6.1 Germany
9.6.2 U.K.
9.6.3 France
9.6.4 Italy
9.6.5 Rest of Europe
10. Asia Pacific intelligent pumps Market Analysis
10.1. Introduction and Definition
10.2. Key Trend by Type
10.4. Asia Pacific Intelligent pumps Market Value Share Analysis, by Component
10.5. Asia Pacific Intelligent pumps Market Value Share Analysis, by Application
10.6 Asia Pacific Intelligent pumps Market Value Share Analysis, by Country
10.6.1 China
10.6.2 India
10.6.3 Japan
10.6.4 ASEAN
10.6.5 Rest of Asia Pacific
11. Middle East & Africa intelligent pumps Market Analysis
11.1. Introduction and Definition
11.2. Key Trend by Type
11.4. Middle East & Africa Intelligent pumps Market Value Share Analysis, by Component
11.5. Middle East & Africa Intelligent pumps Market Value Share Analysis, by Application
11.6 Middle East & Africa Intelligent pumps Market Value Share Analysis, by Country
11.6.1 GCC
11.6.2 South Africa
11.6.5 Rest of Middle East & Africa
12. Latin America intelligent pumps Market Analysis
12.1. Introduction and Definition
12.2. Key Trend by Type
12.4. Latin America Intelligent pumps Market Value Share Analysis, by Component
12.5. Latin America Intelligent pumps Market Value Share Analysis, by Application
12.6 Latin America Intelligent pumps Market Value Share Analysis, by Country
12.6.1 Brazil
12.6.2 Mexico
12.6.5 Rest of Latin America
13. Company Profiles
13.1. Grundfos Holding A/S
13.1.1. Company Overview
13.1.2 Financial Overview
13.1.3. Business Strategy
13.1.4. SWOT Analysis
13.1.5. Recent Developments
13.2. Goulds Pumps
13.2.1. Company Overview
13.2.2 Financial Overview
13.2.3. Business Strategy
13.2.4. SWOT Analysis
13.2.5. Recent Developments
13.3. QuantumFlo, Inc.
13.3.1. Company Overview
13.3.2 Financial Overview
13.3.3. Business Strategy
13.3.4. SWOT Analysis
13.3.5. Recent Developments
13.4. Allweiler GmbH
13.4.1. Company Overview
13.4.2 Financial Overview
13.4.3. Business Strategy
13.4.4. SWOT Analysis
13.4.5. Recent Developments
13.5. Armstrong Fluid Technology
13.5.1. Company Overview
13.5.2 Financial Overview
13.5.3. Business Strategy
13.5.4. SWOT Analysis
13.5.5. Recent Developments
13.6. Kirloskar Brothers Limited
13.6.1. Company Overview
13.6.2 Financial Overview
13.6.3. Business Strategy
13.6.4. SWOT Analysis
13.6.5. Recent Developments
13.7. Alfa Laval
13.7.1. Company Overview
13.7.2 Financial Overview
13.7.3. Business Strategy
13.7.4. SWOT Analysis
13.7.5. Recent Developments
13.8. YASKAWA ELECTRIC CORPORATION
13.8.1. Company Overview
13.8.2 Financial Overview
13.8.3. Business Strategy
13.8.4. SWOT Analysis
13.8.5. Recent Developments
13.9. Danfoss A/S
13.9.1. Company Overview
13.9.2 Financial Overview
13.9.3. Business Strategy
13.9.4. SWOT Analysis
13.9.5. Recent Developments
13.10. Xylem Inc.
13.10.1. Company Overview
13.10.2 Financial Overview
13.10.3. Business Strategy
13.10.4. SWOT Analysis
13.10.5. Recent Developments
13.11. Wilo SE
13.11.1. Company Overview
13.11.2 Financial Overview
13.11.3. Business Strategy
13.11.4. SWOT Analysis
13.11.5. Recent Developments
13.12. Colfax Corporation
13.12.1. Company Overview
13.12.2 Financial Overview
13.12.3. Business Strategy
13.12.4. SWOT Analysis
13.12.5. Recent Developments
14. Key Take Away
List of Tables
Table 1: Global Intelligent Pumps Market Revenue (US$ Mn) Forecast, by Component, 2016–2025
Table 2: Global Intelligent Pumps Market Revenue (US$ Mn) Forecast, by Variable-speed Drives, 2016–2025
Table 3: Intelligent Pump Market Revenue (US$ Mn) Forecast, by Application, 2016–2025
Table 4: Intelligent Pump Market Revenue (US$ Mn) Forecast, by Building, 2016–2025
Table 5: Intelligent Pump Market Revenue (US$ Mn) Forecast, by Commercial Buildings, 2016–2025
Table 6: Intelligent Pump Market Revenue (US$ Mn) Forecast, by Domestic Buildings, 2016–2025
Table 7: Intelligent Pump Market Revenue (US$ Mn) Forecast, by Industry, 2016–2025
Table 8: Intelligent Pump Market Revenue (US$ Mn) Forecast, by Water Utility, 2016–2025
Table 9: Intelligent Pump Market Revenue (US$ Mn) Forecast, by Water Supply, 2016–2025
Table 10: Intelligent Pump Market Revenue (US$ Mn) Forecast, by Waste Water, 2016–2025
Table 11: Global Intelligent Pump Market Size (US$ Mn) and Forecast, by Region, 2016–2025
Table 12: North America Intelligent Pump Market Revenue (US$ Mn) Forecast, by Component, 2016–2025
Table 13: North America Intelligent Pump Market Revenue (US$ Mn) Forecast, by Variable-speed Drives, 2016–2025
Table 14: North America Intelligent Pump Market Revenue (US$ Mn) Forecast, by Application, 2016–2025
Table 15: North America Intelligent Pump Market Revenue (US$ Mn) Forecast, by Building, 2016–2025
Table 16: North America Intelligent Pump Market Revenue (US$ Mn) Forecast, by Commercial Buildings, 2016–2025
Table 17: North America Intelligent Pump Market Revenue (US$ Mn) Forecast, by Domestic Buildings, 2016–2025
Table 18: North America Intelligent Pump Market Revenue (US$ Mn) Forecast, by Industry, 2016–2025
Table 19: North America Intelligent Pump Market Revenue (US$ Mn) Forecast, by Water Utility, 2016–2025
Table 20: North America Intelligent Pump Market Revenue (US$ Mn) Forecast, by Water Supply, 2016–2025
Table 21: North America Intelligent Pump Market Revenue (US$ Mn) Forecast, by Waste Water, 2016–2025
Table 22: U.S. Intelligent Pump Market Revenue (US$ Mn) Forecast, by Component, 2016–2025
Table 23: U.S. Intelligent Pump Market Revenue (US$ Mn) Forecast, by Variable-speed Drives, 2016–2025
Table 24: U.S. Intelligent Pump Market Revenue (US$ Mn) Forecast, by Application, 2016–2025
Table 25: U.S. Intelligent Pump Market Revenue (US$ Mn) Forecast, by Building, 2016–2025
Table 26: U.S. Intelligent Pump Market Revenue (US$ Mn) Forecast, by Commercial Buildings, 2016–2025
Table 27: U.S. Intelligent Pump Market Revenue (US$ Mn) Forecast, by Domestic Buildings, 2016–2025
Table 28: U.S. Intelligent Pump Market Revenue (US$ Mn) Forecast, by Industry, 2016–2025
Table 29: U.S. Intelligent Pump Market Revenue (US$ Mn) Forecast, by Water Utility, 2016–2025
Table 30: U.S. Intelligent Pump Market Revenue (US$ Mn) Forecast, by Water Supply, 2016–2025
Table 31: U.S. Intelligent Pump Market Revenue (US$ Mn) Forecast, by Waste Water, 2016–2025
Table 32: Canada Intelligent Pump Market Revenue (US$ Mn) Forecast, by Component, 2016–2025
Table 33: Canada Intelligent Pump Market Revenue (US$ Mn) Forecast, by Variable-speed Drives, 2016–2025
Table 34: Canada Intelligent Pump Market Revenue (US$ Mn) Forecast, by Application, 2016–2025
Table 35: Canada Intelligent Pump Market Revenue (US$ Mn) Forecast, by Building, 2016–2025
Table 36: Canada Intelligent Pump Market Revenue (US$ Mn) Forecast, by Commercial Buildings, 2016–2025
Table 37: Canada Intelligent Pump Market Revenue (US$ Mn) Forecast, by Domestic Buildings, 2016–2025
Table 38: Canada Intelligent Pump Market Revenue (US$ Mn) Forecast, by Industry, 2016–2025
Table 39: Canada Intelligent Pump Market Revenue (US$ Mn) Forecast, by Water Utility, 2016–2025
Table 40: Canada Intelligent Pump Market Revenue (US$ Mn) Forecast, by Water Supply, 2016–2025
Table 41: Canada Intelligent Pump Market Revenue (US$ Mn) Forecast, by Waste Water, 2016–2025
Table 42: Europe Intelligent Pump Market Revenue (US$ Mn) Forecast, by Component, 2016–2025
Table 43: Europe Intelligent Pump Market Revenue (US$ Mn) Forecast, by Variable Speed Drive, 2016–2025
Table 44: Europe Intelligent Pump Market Revenue (US$ Mn) Forecast, by Application, 2016–2025
Table 45: Europe Intelligent Pump Market Revenue (US$ Mn) Forecast, by Building, 2016–2025
Table 46: Europe Intelligent Pump Market Revenue (US$ Mn) Forecast, by Commercial Buildings, 2016–2025
Table 47: Europe Intelligent Pump Market Revenue (US$ Mn) Forecast, by Domestic Buildings, 2016–2025
Table 48: Europe Intelligent Pump Market Revenue (US$ Mn) Forecast, by Industry, 2016–2025
Table 49: Europe Intelligent Pump Market Revenue (US$ Mn) Forecast, by Water Utility, 2016–2025
Table 50: Europe Intelligent Pump Market Revenue (US$ Mn) Forecast, by Water Supply, 2016–2025
Table 51: Europe Intelligent Pump Market Revenue (US$ Mn) Forecast, by Waste Water, 2016–2025
Table 52: Germany Intelligent Pump Market Revenue (US$ Mn) Forecast, by Component, 2016–2025
Table 53: Germany Intelligent Pump Market Revenue (US$ Mn) Forecast, by Variable-speed Drives, 2016–2025
Table 54: Germany Intelligent Pump Market Revenue (US$ Mn) Forecast, by Application, 2016–2025
Table 55: Germany Intelligent Pump Market Revenue (US$ Mn) Forecast, by Building, 2016–2025
Table 56: Germany Intelligent Pump Market Revenue (US$ Mn) Forecast, by Commercial Buildings, 2016–2025
Table 57: Germany Intelligent Pump Market Revenue (US$ Mn) Forecast, by Domestic Buildings, 2016–2025
Table 58: Germany Intelligent Pump Market Revenue (US$ Mn) Forecast, by Industry, 2016–2025
Table 59: Germany Intelligent Pump Market Revenue (US$ Mn) Forecast, by Water Utility, 2016–2025
Table 60: Germany Intelligent Pump Market Revenue (US$ Mn) Forecast, by Water Supply, 2016–2025
Table 61: Germany Intelligent Pump Market Revenue (US$ Mn) Forecast, by Waste Water, 2016–2025
Table 62: U.K. Intelligent Pump Market Revenue (US$ Mn) Forecast, by Component, 2016–2025
Table 63: U.K. Intelligent Pump Market Revenue (US$ Mn) Forecast, by Variable-speed Drives, 2016–2025
Table 64: U.K. Intelligent Pump Market Revenue (US$ Mn) Forecast, by Application, 2016–2025
Table 65: U.K. Intelligent Pump Market Revenue (US$ Mn) Forecast, by Building, 2016–2025
Table 66: U.K. Intelligent Pump Market Revenue (US$ Mn) Forecast, by Commercial Buildings, 2016–2025
Table 67: U.K. Intelligent Pump Market Revenue (US$ Mn) Forecast, by Domestic Buildings, 2016–2025
Table 68: U.K. Intelligent Pump Market Revenue (US$ Mn) Forecast, by Industry, 2016–2025
Table 69: U.K. Intelligent Pump Market Revenue (US$ Mn) Forecast, by Water Utility, 2016–2025
Table 70: U.K. Intelligent Pump Market Revenue (US$ Mn) Forecast, by Water Supply, 2016–2025
Table 71: U.K. Intelligent Pump Market Revenue (US$ Mn) Forecast, by Waste Water, 2016–2025
Table 72: France Intelligent Pump Market Revenue (US$ Mn) Forecast, by Component, 2016–2025
Table 73: France Intelligent Pump Market Revenue (US$ Mn) Forecast, by Variable-speed Drives, 2016–2025
Table 74: France Intelligent Pump Market Revenue (US$ Mn) Forecast, by Application, 2016–2025
Table 75: France Intelligent Pump Market Revenue (US$ Mn) Forecast, by Building, 2016–2025
Table 76: France Intelligent Pump Market Revenue (US$ Mn) Forecast, by Commercial Buildings, 2016–2025
Table 77: France Intelligent Pump Market Revenue (US$ Mn) Forecast, by Domestic Buildings, 2016–2025
Table 78: France Intelligent Pump Market Revenue (US$ Mn) Forecast, by Industry, 2016–2025
Table 79: France Intelligent Pump Market Revenue (US$ Mn) Forecast, by Water Utility, 2016–2025
Table 80: France Intelligent Pump Market Revenue (US$ Mn) Forecast, by Water Supply, 2016–2025
Table 81: France Intelligent Pump Market Revenue (US$ Mn) Forecast, by Waste Water, 2016–2025
Table 82: Italy Intelligent Pump Market Revenue (US$ Mn) Forecast, by Component, 2016–2025
Table 83: Italy Intelligent Pump Market Revenue (US$ Mn) Forecast, by Variable-speed Drives, 2016–2025
Table 84: Italy Intelligent Pump Market Revenue (US$ Mn) Forecast, by Application, 2016–2025
Table 85: Italy Intelligent Pump Market Revenue (US$ Mn) Forecast, by Building, 2016–2025
Table 86: Italy Intelligent Pump Market Revenue (US$ Mn) Forecast, by Commercial Buildings, 2016–2025
Table 87: Italy Intelligent Pump Market Revenue (US$ Mn) Forecast, by Domestic Buildings, 2016–2025
Table 88: Italy Intelligent Pump Market Revenue (US$ Mn) Forecast, by Industry, 2016–2025
Table 89: Italy Intelligent Pump Market Revenue (US$ Mn) Forecast, by Water Utility, 2016–2025
Table 90: Italy Intelligent Pump Market Revenue (US$ Mn) Forecast, by Water Supply, 2016–2025
Table 91: Italy Intelligent Pump Market Revenue (US$ Mn) Forecast, by Waste Water, 2016–2025
Table 92: Rest of Europe Intelligent Pump Market Revenue (US$ Mn) Forecast, by Component, 2016–2025
Table 93: Rest of Europe Intelligent Pump Market Revenue (US$ Mn) Forecast, by Variable-speed Drives, 2016–2025
Table 94: Rest of Europe Intelligent Pump Market Revenue (US$ Mn) Forecast, by Application, 2016–2025
Table 95: Rest of Europe Intelligent Pump Market Revenue (US$ Mn) Forecast, by Building, 2016–2025
Table 96: Rest of Europe Intelligent Pump Market Revenue (US$ Mn) Forecast, by Commercial Buildings, 2016–2025
Table 97: Rest of Europe Intelligent Pump Market Revenue (US$ Mn) Forecast, by Domestic Buildings, 2016–2025
Table 98: Rest of Europe Intelligent Pump Market Revenue (US$ Mn) Forecast, by Industry, 2016–2025
Table 99: Rest of Europe Intelligent Pump Market Revenue (US$ Mn) Forecast, by Water Utility, 2016–2025
Table 100: Rest of Europe Intelligent Pump Market Revenue (US$ Mn) Forecast, by Water Supply, 2016–2025
Table 101: Rest of Europe Intelligent Pump Market Revenue (US$ Mn) Forecast, by Waste Water, 2016–2025
Table 102: Asia Pacific Intelligent Pump Market Revenue (US$ Mn) Forecast, by Component, 2016–2025
Table 103: Asia Pacific Intelligent Pump Market Revenue (US$ Mn) Forecast, by Variable-speed Drives, 2016–2025
Table 104: Asia Pacific Intelligent Pump Market Revenue (US$ Mn) Forecast, by Application, 2016–2025
Table 105: Asia Pacific Intelligent Pump Market Revenue (US$ Mn) Forecast, by Building, 2016–2025
Table 106: Asia Pacific Intelligent Pump Market Revenue (US$ Mn) Forecast, by Commercial Buildings, 2016–2025
Table 107: Asia Pacific Intelligent Pump Market Revenue (US$ Mn) Forecast, by Domestic Buildings, 2016–2025
Table 108: Asia Pacific Intelligent Pump Market Revenue (US$ Mn) Forecast, by Industry, 2016–2025
Table 109: Asia Pacific Intelligent Pump Market Revenue (US$ Mn) Forecast, by Water Utility, 2016–2025
Table 110: Asia Pacific Intelligent Pump Market Revenue (US$ Mn) Forecast, by Water Supply, 2016–2025
Table 111: Asia Pacific Intelligent Pump Market Revenue (US$ Mn) Forecast, by Waste Water, 2016–2025
Table 112: China Intelligent Pump Market Revenue (US$ Mn) Forecast, by Component, 2016–2025
Table 113: China Intelligent Pump Market Revenue (US$ Mn) Forecast, by Variable-speed Drives, 2016–2025
Table 114: China Intelligent Pump Market Revenue (US$ Mn) Forecast, by Application, 2016–2025
Table 115: China Intelligent Pump Market Revenue (US$ Mn) Forecast, by Building, 2016–2025
Table 116: China Intelligent Pump Market Revenue (US$ Mn) Forecast, by Commercial Buildings, 2016–2025
Table 117: China Intelligent Pump Market Revenue (US$ Mn) Forecast, by Domestic Buildings, 2016–2025
Table 118: China Intelligent Pump Market Revenue (US$ Mn) Forecast, by Industry, 2016–2025
Table 119: China Intelligent Pump Market Revenue (US$ Mn) Forecast, by Water Utility, 2016–2025
Table 120: China Intelligent Pump Market Revenue (US$ Mn) Forecast, by Water Supply, 2016–2025
Table 121: China Intelligent Pump Market Revenue (US$ Mn) Forecast, by Waste Water, 2016–2025
Table 122: Japan Intelligent Pump Market Revenue (US$ Mn) Forecast, by Component, 2016–2025
Table 123: Japan Intelligent Pump Market Revenue (US$ Mn) Forecast, by Variable-speed Drives, 2016–2025
Table 124: Japan Intelligent Pump Market Revenue (US$ Mn) Forecast, by Application, 2016–2025
Table 125: Japan Intelligent Pump Market Revenue (US$ Mn) Forecast, by Building, 2016–2025
Table 126: Japan Intelligent Pump Market Revenue (US$ Mn) Forecast, by Commercial Buildings, 2016–2025
Table 127: Japan Intelligent Pump Market Revenue (US$ Mn) Forecast, by Domestic Buildings, 2016–2025
Table 128: Japan Intelligent Pump Market Revenue (US$ Mn) Forecast, by Industry, 2016–2025
Table 129: Japan Intelligent Pump Market Revenue (US$ Mn) Forecast, by Water Utility, 2016–2025
Table 130: Japan Intelligent Pump Market Revenue (US$ Mn) Forecast, by Water Supply, 2016–2025
Table 131: Japan Intelligent Pump Market Revenue (US$ Mn) Forecast, by Waste Water, 2016–2025
Table 132: India Intelligent Pump Market Revenue (US$ Mn) Forecast, by Component, 2016–2025
Table 133: India Intelligent Pump Market Revenue (US$ Mn) Forecast, by Variable-speed Drives, 2016–2025
Table 134: India Intelligent Pump Market Revenue (US$ Mn) Forecast, by Application, 2016–2025
Table 135: India Intelligent Pump Market Revenue (US$ Mn) Forecast, by Building, 2016–2025
Table 136: India Intelligent Pump Market Revenue (US$ Mn) Forecast, by Commercial Buildings, 2016–2025
Table 137: India Intelligent Pump Market Revenue (US$ Mn) Forecast, by Domestic Buildings, 2016–2025
Table 138: India Intelligent Pump Market Revenue (US$ Mn) Forecast, by Industry, 2016–2025
Table 139: India Intelligent Pump Market Revenue (US$ Mn) Forecast, by Water Utility, 2016–2025
Table 140: India Intelligent Pump Market Revenue (US$ Mn) Forecast, by Water Supply, 2016–2025
Table 141: India Intelligent Pump Market Revenue (US$ Mn) Forecast, by Waste Water, 2016–2025
Table 142: ASEAN Intelligent Pump Market Revenue (US$ Mn) Forecast, by Component, 2016–2025
Table 143: ASEAN Intelligent Pump Market Revenue (US$ Mn) Forecast, by Variable-speed Drives, 2016–2025
Table 144: ASEAN Intelligent Pump Market Revenue (US$ Mn) Forecast, by Application, 2016–2025
Table 145: ASEAN Intelligent Pump Market Revenue (US$ Mn) Forecast, by Building, 2016–2025
Table 146: ASEAN Intelligent Pump Market Revenue (US$ Mn) Forecast, by Commercial Buildings, 2016–2025
Table 147: ASEAN Intelligent Pump Market Revenue (US$ Mn) Forecast, by Domestic Buildings, 2016–2025
Table 148: ASEAN Intelligent Pump Market Revenue (US$ Mn) Forecast, by Industry, 2016–2025
Table 149: ASEAN Intelligent Pump Market Revenue (US$ Mn) Forecast, by Water Utility, 2016–2025
Table 150: ASEAN Intelligent Pump Market Revenue (US$ Mn) Forecast, by Water Supply, 2016–2025
Table 151: ASEAN Intelligent Pump Market Revenue (US$ Mn) Forecast, by Waste Water, 2016–2025
Table 152: Rest of Asia Pacific Intelligent Pump Market Revenue (US$ Mn) Forecast, by Component, 2016–2025
Table 153: Rest of Asia Pacific Intelligent Pump Market Revenue (US$ Mn) Forecast, by Variable-speed Drives, 2016–2025
Table 154: Rest of Asia Pacific Intelligent Pump Market Revenue (US$ Mn) Forecast, by Application, 2016–2025
Table 155: Rest of Asia Pacific Intelligent Pump Market Revenue (US$ Mn) Forecast, by Building, 2016–2025
Table 156: Rest of Asia Pacific Intelligent Pump Market Revenue (US$ Mn) Forecast, by Commercial Buildings, 2016–2025
Table 157: Rest of Asia Pacific Intelligent Pump Market Revenue (US$ Mn) Forecast, by Domestic Buildings, 2016–2025
Table 158: Rest of Asia Pacific Intelligent Pump Market Revenue (US$ Mn) Forecast, by Industry, 2016–2025
Table 159: Rest of Asia Pacific Intelligent Pump Market Revenue (US$ Mn) Forecast, by Water Utility, 2016–2025
Table 160: Rest of Asia Pacific Intelligent Pump Market Revenue (US$ Mn) Forecast, by Water Supply, 2016–2025
Table 161: Rest of Asia Pacific Intelligent Pump Market Revenue (US$ Mn) Forecast, by Waste Water, 2016–2025
Table 162: Middle East & Africa Intelligent Pump Market Revenue (US$ Mn) Forecast, by Component, 2016–2025
Table 163: Middle East & Africa Intelligent Pump Market Revenue (US$ Mn) Forecast, by Variable Speed Drive, 2016–2025
Table 164: Middle East & Africa Intelligent Pump Market Revenue (US$ Mn) Forecast, by Application, 2016–2025
Table 165: Middle East & Africa Intelligent Pump Market Revenue (US$ Mn) Forecast, by Building, 2016–2025
Table 166: Middle East & Africa Intelligent Pump Market Revenue (US$ Mn) Forecast, by Commercial Buildings, 2016–2025
Table 167: Middle East & Africa Intelligent Pump Market Revenue (US$ Mn) Forecast, by Domestic Buildings, 2016–2025
Table 168: Middle East & Africa Intelligent Pump Market Revenue (US$ Mn) Forecast, by Industry, 2016–2025
Table 169: Middle East & Africa Intelligent Pump Market Revenue (US$ Mn) Forecast, by Water Utility, 2016–2025
Table 170: Middle East & Africa Intelligent Pump Market Revenue (US$ Mn) Forecast, by Water Supply, 2016–2025
Table 171: Middle East & Africa Intelligent Pump Market Revenue (US$ Mn) Forecast, by Waste Water, 2016–2025
Table 172: GCC Intelligent Pump Market Revenue (US$ Mn) Forecast, by Component, 2016–2025
Table 173: GCC Intelligent Pump Market Revenue (US$ Mn) Forecast, by Variable-speed Drives, 2016–2025
Table 174: GCC Intelligent Pump Market Revenue (US$ Mn) Forecast, by Application, 2016–2025
Table 175: GCC Intelligent Pump Market Revenue (US$ Mn) Forecast, by Building, 2016–2025
Table 176: GCC Intelligent Pump Market Revenue (US$ Mn) Forecast, by Commercial Buildings, 2016–2025
Table 177: GCC Intelligent Pump Market Revenue (US$ Mn) Forecast, by Domestic Buildings, 2016–2025
Table 178: GCC Intelligent Pump Market Revenue (US$ Mn) Forecast, by Industry, 2016–2025
Table 179: GCC Intelligent Pump Market Revenue (US$ Mn) Forecast, by Water Utility, 2016–2025
Table 180: GCC Intelligent Pump Market Revenue (US$ Mn) Forecast, by Water Supply, 2016–2025
Table 181: GCC Intelligent Pump Market Revenue (US$ Mn) Forecast, by Waste Water, 2016–2025
Table 182: South Africa Intelligent Pump Market Revenue (US$ Mn) Forecast, by Component, 2016–2025
Table 183: South Africa Intelligent Pump Market Revenue (US$ Mn) Forecast, by Variable-speed Drives, 2016–2025
Table 184: South Africa Intelligent Pump Market Revenue (US$ Mn) Forecast, by Application, 2016–2025
Table 185: South Africa Intelligent Pump Market Revenue (US$ Mn) Forecast, by Building, 2016–2025
Table 186: South Africa Intelligent Pump Market Revenue (US$ Mn) Forecast, by Commercial Buildings, 2016–2025
Table 187: South Africa Intelligent Pump Market Revenue (US$ Mn) Forecast, by Domestic Buildings, 2016–2025
Table 188: South Africa Intelligent Pump Market Revenue (US$ Mn) Forecast, by Industry, 2016–2025
Table 189: South Africa Intelligent Pump Market Revenue (US$ Mn) Forecast, by Water Utility, 2016–2025
Table 190: South Africa Intelligent Pump Market Revenue (US$ Mn) Forecast, by Water Supply, 2016–2025
Table 191: South Africa Intelligent Pump Market Revenue (US$ Mn) Forecast, by Waste Water, 2016–2025
Table 192: Rest of Middle East & Africa Intelligent Pump Market Revenue (US$ Mn) Forecast, by Component, 2016–2025
Table 193: Rest of Middle East & Africa Intelligent Pump Market Revenue (US$ Mn) Forecast, by Variable-speed Drives, 2016–2025
Table 194: Rest of Middle East & Africa Intelligent Pump Market Revenue (US$ Mn) Forecast, by Application, 2016–2025
Table 195: Rest of Middle East & Africa Intelligent Pump Market Revenue (US$ Mn) Forecast, by Building, 2016–2025
Table 196: Rest of Middle East & Africa Intelligent Pump Market Revenue (US$ Mn) Forecast, by Commercial Buildings, 2016–2025
Table 197: Rest of Middle East & Africa Intelligent Pump Market Revenue (US$ Mn) Forecast, by Domestic Buildings, 2016–2025
Table 198: Rest of Middle East & Africa Intelligent Pump Market Revenue (US$ Mn) Forecast, by Industry, 2016–2025
Table 199: Rest of Middle East & Africa Intelligent Pump Market Revenue (US$ Mn) Forecast, by Water Utility, 2016–2025
Table 200: Rest of Middle East & Africa Intelligent Pump Market Revenue (US$ Mn) Forecast, by Water Supply, 2016–2025
Table 201: Rest of Middle East & Africa Intelligent Pump Market Revenue (US$ Mn) Forecast, by Waste Water, 2016–2025
Table 202: Latin America Intelligent Pump Market Revenue (US$ Mn) Forecast, by Component, 2016–2025
Table 203: Latin America Intelligent Pump Market Revenue (US$ Mn) Forecast, by Variable Speed Drive, 2016–2025
Table 204: Latin America Intelligent Pump Market Revenue (US$ Mn) Forecast, by Application, 2016–2025
Table 205: Latin America Intelligent Pump Market Revenue (US$ Mn) Forecast, by Building, 2016–2025
Table 206: Latin America Intelligent Pump Market Revenue (US$ Mn) Forecast, by Commercial Buildings, 2016–2025
Table 207: Latin America Intelligent Pump Market Revenue (US$ Mn) Forecast, by Domestic Buildings, 2016–2025
Table 208: Latin America Intelligent Pump Market Revenue (US$ Mn) Forecast, by Industrial, 2016–2025
Table 209: Latin America Intelligent Pump Market Revenue (US$ Mn) Forecast, by Water Utility, 2016–2025
Table 210: Latin America Intelligent Pump Market Revenue (US$ Mn) Forecast, by Water Supply, 2016–2025
Table 211: Latin America Intelligent Pump Market Revenue (US$ Mn) Forecast, by Waste Water, 2016–2025
Table 212: Brazil Intelligent Pump Market Revenue (US$ Mn) Forecast, by Component, 2016–2025
Table 213: Brazil Intelligent Pump Market Revenue (US$ Mn) Forecast, by Variable-speed Drives, 2016–2025
Table 214: Brazil Intelligent Pump Market Revenue (US$ Mn) Forecast, by Application, 2016–2025
Table 215: Brazil Intelligent Pump Market Revenue (US$ Mn) Forecast, by Building, 2016–2025
Table 216: Brazil Intelligent Pump Market Revenue (US$ Mn) Forecast, by Commercial Buildings, 2016–2025
Table 217: Brazil Intelligent Pump Market Revenue (US$ Mn) Forecast, by Domestic Buildings, 2016–2025
Table 218: Brazil Intelligent Pump Market Revenue (US$ Mn) Forecast, by Industry, 2016–2025
Table 219: Brazil Intelligent Pump Market Revenue (US$ Mn) Forecast, by Water Utility, 2016–2025
Table 220: Brazil Intelligent Pump Market Revenue (US$ Mn) Forecast, by Water Supply, 2016–2025
Table 221: Brazil Intelligent Pump Market Revenue (US$ Mn) Forecast, by Waste Water, 2016–2025
Table 222: Mexico Intelligent Pump Market Revenue (US$ Mn) Forecast, by Component, 2016–2025
Table 223: Mexico Intelligent Pump Market Revenue (US$ Mn) Forecast, by Variable-speed Drives, 2016–2025
Table 224: Mexico Intelligent Pump Market Revenue (US$ Mn) Forecast, by Application, 2016–2025
Table 225: Mexico Intelligent Pump Market Revenue (US$ Mn) Forecast, by Building, 2016–2025
Table 226: Mexico Intelligent Pump Market Revenue (US$ Mn) Forecast, by Commercial Buildings, 2016–2025
Table 227: Mexico Intelligent Pump Market Revenue (US$ Mn) Forecast, by Domestic Buildings, 2016–2025
Table 228: Mexico Intelligent Pump Market Revenue (US$ Mn) Forecast, by Industry, 2016–2025
Table 229: Mexico Intelligent Pump Market Revenue (US$ Mn) Forecast, by Water Utility, 2016–2025
Table 230: Mexico Intelligent Pump Market Revenue (US$ Mn) Forecast, by Water Supply, 2016–2025
Table 231: Mexico Intelligent Pump Market Revenue (US$ Mn) Forecast, by Waste Water, 2016–2025
Table 232: Rest of Middle East & Africa Intelligent Pump Market Revenue (US$ Mn) Forecast, by Component, 2016–2025
Table 233: Rest of Latin America Intelligent Pump Market Revenue (US$ Mn) Forecast, by Variable-speed Drives, 2016–2025
Table 234: Rest of Latin America Intelligent Pump Market Revenue (US$ Mn) Forecast, by Application, 2016–2025
Table 235: Rest of Latin America Intelligent Pump Market Revenue (US$ Mn) Forecast, by Building, 2016–2025
Table 236: Rest of Latin America Intelligent Pump Market Revenue (US$ Mn) Forecast, by Commercial Buildings, 2016–2025
Table 237: Rest of Latin America Intelligent Pump Market Revenue (US$ Mn) Forecast, by Domestic Buildings, 2016–2025
Table 238: Rest of Latin America Intelligent Pump Market Revenue (US$ Mn) Forecast, by Industry, 2016–2025
Table 239: Rest of Latin America Intelligent Pump Market Revenue (US$ Mn) Forecast, by Water Utility, 2016–2025
Table 240: Rest of Latin America Intelligent Pump Market Revenue (US$ Mn) Forecast, by Water Supply, 2016–2025
Table 241: Rest of Latin America Intelligent Pump Market Revenue (US$ Mn) Forecast, by Waste Water, 2016–2025
List of Figures
Figure 1: Intelligent Pump Market Size, by Market Value (US$ Mn) Share and by Region, 2016
Figure 2: Global Intelligent Pump Market Size (US$ Mn) Forecast, 2016–2025
Figure 3: Global Intelligent Pump Market, Y-o-Y Growth (%), 2016–2025
Figure 4: Global Intelligent Pumps Market Value Share Analysis, by Component, 2016 and 2025
Figure 5: Global Intelligent Pumps Market Size (US$ Mn), by Pump Motors, 2016–2025
Figure 6: Global Intelligent Pumps Market Size (US$ Mn), by Variable-speed Drives, 2016–2025
Figure 7: Global Intelligent Pumps Market Size (US$ Mn), by Control Systems, 2016–2025
Figure 8: Global Intelligent Pumps Market Size (US$ Mn), by Others, 2016–2025
Figure 9: Global Intelligent Pump Market Value Share Analysis, by Application, 2016 and 2025
Figure 10: Building, (US$ Mn), 2016–2025
Figure 11: Industry, (US$ Mn), 2016–2025
Figure 12: Water Utility, (US$ Mn), 2016–2025
Figure 13: Others, (US$ Mn), 2016–2025
Figure 14: North America Intelligent Pump Market Size (US$ Mn) Forecast, 2016–2025
Figure 15: North America Intelligent Pump Market Value Share (US$ Mn) Analysis, by Component, 2016 and 2025
Figure 16: North America Intelligent Pump Market Value Share (US$ Mn) Analysis, by Application, 2016 and 2025
Figure 17: North America Intelligent Pump Market Forecast, by Building (2016)
Figure 18: North America Intelligent Pump Market Forecast, by Water Utility (2016)
Figure 19: North America Intelligent Pump Market Forecast, by Variable-speed Drives (2016)
Figure 20: North America Intelligent Pump Market Forecast, by Industry (2016)
Figure 21: North America Intelligent Pump Market Forecast, by Domestic Buildings (2016)
Figure 22: North America Intelligent Pump Market Forecast, by Waste Water (2016)
Figure 23: North America Intelligent Pump Market Forecast, by Commercial Buildings (2016)
Figure 24: North America Intelligent Pump Market Forecast, by Water Supply (2016)
Figure 25: North America Market Value Share (US$ Mn) Analysis, by Country/Sub-region, 2016 and 2025
Figure 26: Europe Intelligent Pump Market Size (US$ Mn) Forecast, 2016–2025
Figure 27: Europe Intelligent Pump Market Value Share (US$ Mn) Analysis, by Component, 2016 and 2025
Figure 28: Europe Intelligent Pump Market Value Share (US$ Mn) Analysis, by Application, 2016 and 2025
Figure 29: Europe Intelligent Pump Market Forecast, by Building (2016)
Figure 30: Europe Intelligent Pump Market Forecast, by Water Utility (2016)
Figure 31: Europe Intelligent Pump Market Forecast, by Variable Speed Drive (2016)
Figure 32: Europe Intelligent Pump Market Forecast, by Industry (2016)
Figure 33: Europe Intelligent Pump Market Forecast, by Domestic Building (2016)
Figure 34: Europe Intelligent Pump Market Forecast, by Waste Water (2016)
Figure 35: Europe Intelligent Pump Market Forecast, by Commercial Buildings (2016)
Figure 36: Europe Intelligent Pump Market Forecast, by Water Supply (2016)
Figure 37: Europe Market Value Share (US$ Mn) Analysis, by Country/Sub-region, 2016 and 2025
Figure 38: Asia Pacific Intelligent Pump Market Size (US$ Mn) Forecast, 2016–2025
Figure 39: Asia Pacific Intelligent Pump Market Value Share (US$ Mn) Analysis, by Component, 2016 and 2025
Figure 40: Asia Pacific Intelligent Pump Market Value Share (US$ Mn) Analysis, by Application, 2016 and 2025
Figure 41: Asia Pacific Intelligent Pump Market Forecast, by Building (2016)
Figure 42: Asia Pacific Intelligent Pump Market Forecast, by Water Utility (2016)
Figure 43: Asia Pacific Intelligent Pump Market Forecast, by Variable-speed Drives (2016)
Figure 44: Asia Pacific Intelligent Pump Market Forecast, by Industry (2016)
Figure 45: Asia Pacific Intelligent Pump Market Forecast, by Domestic Buildings (2016)
Figure 46: Asia Pacific Intelligent Pump Market Forecast, by Waste Water (2016)
Figure 47: Asia Pacific Intelligent Pump Market Forecast, by Commercial Buildings (2016)
Figure 48: Asia Pacific Intelligent Pump Market Forecast, by Water Supply (2016)
Figure 49: Europe Market Value Share (US$ Mn) Analysis, by Country/Sub-region, 2016 and 2025
Figure 50: Middle East & Africa Intelligent Pump Market Size (US$ Mn) Forecast, 2016–2025
Figure 51: Middle East & Africa Intelligent Pump Market Value Share (US$ Mn) Analysis, by Component, 2016 and 2025
Figure 52: Middle East & Africa Intelligent Pump Market Value Share (US$ Mn) Analysis, by Application, 2016 and 2025
Figure 53: Middle East & Africa Intelligent Pump Market Forecast, by Building
Figure 54: Middle East & Africa Intelligent Pump Market Forecast, by Water Utility
Figure 55: Middle East & Africa Intelligent Pump Market Forecast, by Variable Speed Drive
Figure 56: Middle East & Africa Intelligent Pump Market Forecast, by Industry
Figure 57: Middle East & Africa Intelligent Pump Market Forecast, by Domestic Building
Figure 58: Middle East & Africa Intelligent Pump Market Forecast, by Waste Water
Figure 59: Middle East & Africa Intelligent Pump Market Forecast, by Commercial Buildings
Figure 60: Middle East & Africa Intelligent Pump Market Forecast, by Water Supply
Figure 61: Middle East & Africa Market Value Share (US$ Mn) Analysis, by Country/Sub-region, 2016 and 2025
Figure 62: Latin America Intelligent Pump Market Size (US$ Mn) Forecast, 2016–2025
Figure 63: Latin America Intelligent Pump Market Value Share (US$ Mn) Analysis, by Component, 2016 and 2025
Figure 64: Latin America Intelligent Pump Market Value Share (US$ Mn) Analysis, by Application, 2016 and 2025
Figure 65: Latin America Intelligent Pump Market Forecast, by Building (2016)
Figure 66: Latin America Intelligent Pump Market Forecast, by Water Utility (2016)
Figure 67: Latin America Intelligent Pump Market Forecast, by Variable Speed Drive (2016)
Figure 68: Latin America Intelligent Pump Market Forecast, by Industrial (2016)
Figure 69: Latin America Intelligent Pump Market Forecast, by Domestic Building (2016)
Figure 70: Latin America Intelligent Pump Market Forecast, by Waste Water (2016)
Figure 71: Latin America Intelligent Pump Market Forecast, by Commercial Buildings (2016)
Figure 72: Latin America Intelligent Pump Market Forecast, by Water Supply (2016)
Figure 73: Latin America Market Value Share (US$ Mn) Analysis, by Country/Sub-region, 2016 and 2025
Copyright © Transparency Market Research, Inc. All Rights reserved
Trust Online

Intelligent Pumps Market