
Reports
Reports
The hydrolyzed collagen market, valued at ~US$ 825 million in 2018, advances towards becoming a billion-dollar market by 2021, and will continue its stride at a CAGR of ~8% during 2019-2029, finds a new report published by Transparency Market Research (TMR).
The hydrolyzed collagen market holds adjacent market opportunities, besides food and beverages, and much of this has to do with the newly-added thrust of preventive, rather than curative measures in the healthcare sector. Though the healthcare industry is not a direct contributor to the landscape, the blurring lines between food and nutraceutical industries, and the convergence of 'food-pharma' industries are projected to exert a sizeable influence on the popularity of hydrolyzed collagen to cater to nutritional inadequacies among consumers.
The significant shift in the strategy towards curative practices has, in turn, caught the attention of the cosmetics and personal care industry, and manufacturers are catalyzing the spurt in the growth of the hydrolyzed collagen market with the introduction of skincare- and hair care-based product portfolios. However, while tapping adjacent market opportunities, manufacturers need to be prepared for the discipline of regulatory compliance - norms regarding food claims and information presented to consumers to drive them into the sales funnel.
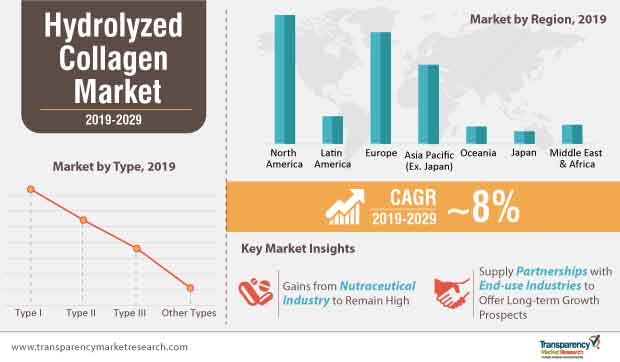
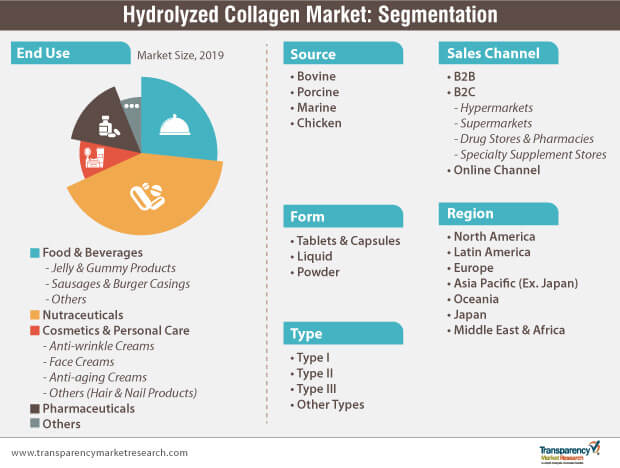
The hydrolyzed collagen market continues to undergo an epochal scale of transmutation, as manufacturers tap new sources to extract value-added collagens. Historically, hydrolyzed collagen, extracted from cattle, maintained a clear lead in terms of value share. However, as literature claiming benefits of marine-sourced collagens - better water solubility, skincare properties, and lesser carbon footprints - began coming to light, a spike in their adoption rate became apparent. In 2019, hydrolyzed collagen sourced from bovine accounted for ~US$ 350 million, while that sourced from marine is estimated to register a CAGR of ~11% during 2019-2029.
However, the evolutionary nature of the landscape is the very feature that could pose a challenge. Animal-sourced hydrolyzed collagens cater to the protein inadequacy of the non-vegetarian populace, while the growing interest towards the adoption of the vegan trend could be a weighted market deterrent.
As per searches made, Google Trends marked a whopping 90% increase in vegan trends in 2016, with leading searches from Australia, followed by North America. Increasing searches for 'vegan' and 'vegetarian' keywords, as a whole, surmise the growing proclivity of consumers for plant-based dietary choices. The quest for plant-based supplements has led to the introduction of vegan collagen, produced by genetically modifying yeast and bacteria. What further helps vegan collagen manufacturers distinguish their offerings is their cost-efficiency and high safety profile, which could dim the potential of the animal-based hydrolyzed collagen market.
In 2018, the sales of powdered hydrolyzed collagen accounted for a value of ~US$ 265 million, while that of liquid hydrolyzed collagen grew to a value of ~US$ 135 million. Despite the availability of various intake options, consumers tend to prefer nutritional supplements in the powdered form over the tablet and liquid forms, on account of their longer shelf life and high bioavailability. On top of that, powdered hydrolyzed collagen is deemed pure, as it is less susceptible to mixing with other ingredients. As compared to the other forms, cost-effectiveness and high flexibility with dosing remain the key attractive proposition of the powdered form, catalyzing its sales.
However, the report points towards the exponentially growing adoption rate of liquid hydrolyzed collagen, given its high absorbability, which makes it more effective than the powdered and tablet forms. The sales of liquid hydrolyzed collagen will move at a compound annual growth rate of ~10% during the forecast period.
Beside other success factors, distribution channels, in turn, play a pivotal role in influencing the purchasing behavior of consumers. For instance, the transit of powdered hydrolyzed collagen is much safer than that of the liquid form, which is thereby fortifying the sales of the former via online channels, and that of liquid through B2B and B2C channels such as hypermarkets/supermarkets, drug stores & pharmacies, and specialty supplement stores.
Despite an upsurge in sales through online and B2C channels, B2B channels will account for a sizeable share, given the direct and indirect supply-distribution partnerships with end-use industries such as food and beverages, nutraceuticals, pharmaceuticals, and cosmetic industries, among others.
Proper labeling of hydrolyzed collagens will be a focus area for market players, given the growing appetite of central and food regulators regarding safety. The FDA, operating in the U.S., issued new guidance on food labeling, to drive greater standardization in the way health and nutrition information is presented to the consumer. Food labeling changes in Europe are more stringent that those present in North America. New requirements include improved legibility of information and specific details regarding the source of the product.
Another key aspect of such regulations is the high number of product recalls in case of failure to meet legislated protocols, which needs the complete attention of manufacturers while marketing for their products to safeguard their business from product recall instances.
In a fragmented landscape, which lacks strong dominance, market players can make it big in the hydrolyzed collagen market by taking a cue from global players. The key to a high market share is intense focus on global reach and broadening of a consumer-centric product portfolio, an example of which can be taken from Rousselot, a leading player offering gelatin and collagen peptides. The company, along with Phamatech, collaborated for the launch of SiMoGel, a fortified confectionery, in the EMEA market.
With the presence of stringent regulatory norms scrutinizing hydrolyzed collagens as well as products made out of them, manufacturers will need to take a more granular and conscientious approach towards the development of clean-label products. Consumers’ fickle food choices mean that market players will have to closely understand the undercurrents and trends while conducting their R&D activities in order to develop a consumer-centric product. Since pure hydrolyzed collagen is flavorless and odorless, market players can increase the exclusiveness of their portfolio by introducing new flavors. All-in-all, market players can look at a market value of ~US$ 1.8 Bn by the end of 2029.
Hydrolyzed Collagen Market Witnessing Growth Due to Radical Shift towards Sustainability and Longevity
Increasing Demand for Cosmetics and Personal Care Products Boosting Hydrolyzed Collagen Market
Growing Commercialization of Hydrolyzed Collagen-based Drug Delivery Systems
Growing Popularity and Demand for Natural Ingredients
Economic Development in BRICS Countries
Challenges Pertaining to FDA Approval for Hydrolyzed Collagen
Global Hydrolyzed Collagen Market: Competition Landscape
Key players operating in the hydrolyzed collagen market, as profiled in the study, include
1. Executive Summary
1.1. Summary of Key Findings
1.2. Summary of Key Statistics
1.3. Supply and Demand Side Trends
1.4. TMR Analysis and Recommendations
2. Market Overview
2.1. Market Coverage / Taxonomy
2.2. Market Definition / Scope / Limitations
3. Key Market Trends
3.1. Key Trends Impacting the Market
3.2. Product Innovation / Development Trends
4. Market Background
4.1. Rising Cost of Healthcare and Role of Supplements
4.2. Per Capita Spending on Supplement (Country wise Benchmark)
4.3. Global Supplements Market Analysis
4.3.1. Supplement Sales Value and Forecast
4.3.2. Share of Collagen Hydrolysates Supplement (in Global Supplement Sales)
4.4. Global Supplements Market Overview
4.4.1. Supplements Spending Analysis, by Category
4.4.1.1. Heart Health
4.4.1.2. Bone Health
4.4.1.3. Brain Health
4.4.1.4. Vision Support
4.4.1.5. Others
4.4.2. Supplements Spending Analysis, by Consumer Type
4.4.2.1. Male
4.4.2.2. Female
4.4.3. Supplements Spending Analysis, by Age Group
4.4.3.1. 0-15 years
4.4.3.2. 15-30 years
4.4.3.3. 30-60 years
4.4.3.4. 60 years and Above
4.4.4. Supplements Spending Analysis, by Consumption Type
4.4.4.1. Prescription based
4.4.4.2. Over the Counter (OTC)
4.5. Regulations for Hydrolyzed Collagen Supplements across the Globe
4.6. Hydrolyzed Collagen Supplement Product Hotspot - Pipeline Analysis
4.7. Global Brain Health Supplements Spending Overview
4.7.1. Brain Health Supplements Spending based on Disorder Type
4.7.1.1. Alzheimer's Disease
4.7.1.2. Dementias
4.7.1.3. Epilepsy and Other Seizure Disorders
4.7.1.4. Mental Disorders
4.7.1.5. Parkinson's and Other Movement Disorders
4.7.1.6. Stroke and Transient Ischemic Attack (TIA)
4.7.1.7. Sleeping Disorders
4.7.1.8. Others
4.8. Rising Preventive Healthcare
4.8.1. Role of Education in the Global Preventive Healthcare Awareness
4.8.2. Role of Internet in the Global Preventive Healthcare Awareness
4.8.3. Role of Government Initiatives in the Global Preventive Healthcare Awareness
4.9. Macro-Economic Factors
4.9.1. Global GDP Growth Outlook
4.9.2. Global Per Capita Health Spending Outlook
4.9.3. Global Pharmaceutical Industry Outlook
4.9.4. Global Population Growth Outlook
4.9.4.1. Birth Rates
4.9.4.2. Death Rates
4.9.5. Per Capita Disposable Income
4.9.6. Health Sector GVA
4.10. Forecast Factors - Relevance & Impact
4.10.1. Top Companies Historical Growth
4.10.2. Incidences of Alzheimer Disorder
4.10.3. Incidences of Dementia
4.10.4. Incidences of Mental Disorder
4.11. Value Chain Analysis
4.11.1. Profitability Margin Analysis
4.11.2. Value Added at Each Node in the Supply Chain
4.11.3. List of Hydrolyzed Collagen Brand Owners
4.11.4. List of Hydrolyzed Collagen Manufacturers
4.11.5. List of Hydrolyzed Collagen Raw Material Suppliers
4.12. Market Dynamics
4.12.1. Drivers
4.12.2. Restraints
4.12.3. Opportunity Analysis
5. Global Hydrolyzed Collagen Market Demand Analysis 2014-2018 and Forecast, 2019-2029
5.1. Historical Market Volume (Tons) Analysis, 2014-2018
5.2. Current and Future Market Volume (Tons) Projections, 2019-2029
5.3. Y-o-Y Growth Trend Analysis
6. Global Hydrolyzed Collagen Market - Pricing Analysis
6.1. Regional Pricing Analysis By Size
6.2. Pricing Break-up
6.2.1. Manufacturer Level Pricing
6.2.2. Distributor Level Pricing
6.3. Global Average Pricing Analysis Benchmark
7. Global Hydrolyzed Collagen Market Demand (in Value or Size in US$ Mn) Analysis 2014-2018 and Forecast, 2019-2029
7.1. Historical Market Value (US$ Mn) Analysis, 2014-2018
7.2. Current and Future Market Value (US$ Mn) Projections, 2019-2029
7.2.1. Y-o-Y Growth Trend Analysis
7.2.2. Absolute $ Opportunity Analysis
8. Global Hydrolyzed Collagen Market Analysis 2014-2018 and Forecast 2019-2029, by Source
8.1. Introduction / Key Findings
8.2. Historical Market Size (US$ Mn) and Volume (Tons) Analysis By Source, 2014 - 2018
8.3. Current and Future Market Size (US$ Mn) and Volume (Tons) Analysis and Forecast By Source, 2019 - 2029
8.3.1. Bovine
8.3.2. Porcine
8.3.3. Marine
8.3.4. Chicken
8.4. Market Attractiveness Analysis By Source
9. Global Hydrolyzed Collagen Market Analysis 2014-2018 and Forecast 2019-2029, by Form
9.1. Introduction / Key Findings
9.2. Historical Market Size (US$ Mn) and Volume (Tons) Analysis By Form, 2014 - 2018
9.3. Current and Future Market Size (US$ Mn) and Volume (Tons) Analysis and Forecast By Form, 2019 - 2029
9.3.1. Tablets & Capsules
9.3.2. Liquid
9.3.3. Powder
9.4. Market Attractiveness Analysis By Form
10. Global Hydrolyzed Collagen Market Analysis 2014-2018 and Forecast 2019-2029, by Collagen Type
10.1. Introduction / Key Findings
10.2. Historical Market Size (US$ Mn) and Volume (Tons) Analysis By Collagen Type, 2014 - 2018
10.3. Current and Future Market Size (US$ Mn) and Volume (Tons) Analysis and Forecast By Collagen Type, 2019 - 2029
10.3.1. Type I
10.3.2. Type II
10.3.3. Type III
10.3.4. Other Types
10.4. Market Attractiveness Analysis By Collagen Type
11. Global Hydrolyzed Collagen Market Analysis 2014-2018 and Forecast 2019-2029, by End Use
11.1. Introduction / Key Findings
11.2. Historical Market Size (US$ Mn) and Volume (Tons) Analysis By End Use, 2014 - 2018
11.3. Current and Future Market Size (US$ Mn) and Volume (Tons) Analysis and Forecast By End Use, 2019 - 2029
11.3.1. Food & Beverage Industry
11.3.1.1. Jelly & Gummy Products
11.3.1.2. Sausages & Burger Casings
11.3.1.3. Others
11.3.2. Nutraceuticals
11.3.3. Cosmetics & Personal Care Industry
11.3.3.1. Anti-Wrinkle Creams
11.3.3.2. Face Creams
11.3.3.3. Antiaging Creams
11.3.3.4. Others ( Hair & Nail Products)
11.3.4. Pharmaceuticals
11.3.5. Others
11.4. Market Attractiveness Analysis By End Use
12. Global Hydrolyzed Collagen Market Analysis 2014-2018 and Forecast 2019-2029, by Sales Channel
12.1. Introduction / Key Findings
12.2. Historical Market Size (US$ Mn) and Volume (Tons) Analysis By Sales Channel, 2014 - 2018
12.3. Current and Future Market Size (US$ Mn) and Volume (Tons) Analysis and Forecast By Sales Channel, 2019 - 2029
12.3.1. B2B
12.3.2. B2C
12.3.2.1. Hyper market
12.3.2.2. Super Market
12.3.2.3. Drug Store & Pharmacies
12.3.2.4. Specialty Supplement Store
12.3.3. Online Channel
12.4. Market Attractiveness Analysis By Sales Channel
13. Global Hydrolyzed Collagen Market Analysis 2014-2018 and Forecast 2019-2029, by Region
13.1. Introduction
13.2. Historical Market Size (US$ Mn) and Volume (Tons) Analysis By Region, 2014 - 2018
13.3. Current Market Size (US$ Mn) and Volume (Tons) Analysis and Forecast By Region, 2019 - 2029
13.3.1. North America
13.3.2. Latin America
13.3.3. Europe
13.3.4. Asia Pacific Excluding Japan (APEJ)
13.3.5. Oceania
13.3.6. Middle East and Africa (MEA)
13.3.7. Japan
13.4. Market Attractiveness Analysis By Region
14. North America Hydrolyzed Collagen Market Analysis 2014-2018 and Forecast 2019-2029
14.1. Introduction
14.2. Pricing Analysis
14.3. Historical Market Size (US$ Mn) and Volume (Tons) Trend Analysis By Market Taxonomy, 2014 - 2018
14.4. Market Size (US$ Mn) and Volume (Tons) Forecast By Market Taxonomy, 2019 - 2029
14.4.1. By Country
14.4.1.1. U.S.
14.4.1.2. Canada
14.4.2. By Source
14.4.3. By Form
14.4.4. By Collagen Type
14.4.5. By End Use
14.4.6. By Sales Channel
14.5. Market Attractiveness Analysis
14.5.1. By Country
14.5.2. By Source
14.5.3. By Form
14.5.4. By Collagen Type
14.5.5. By End Use
14.5.6. By Sales Channel
14.6. Market Trends
14.7. Key Market Participants - Intensity Mapping
14.8. Drivers and Restraints - Impact Analysis
15. Latin America Hydrolyzed Collagen Market Analysis 2014-2018 and Forecast 2019-2029
15.1. Introduction
15.2. Pricing Analysis
15.3. Historical Market Size (US$ Mn) and Volume (Tons) Trend Analysis By Market Taxonomy, 2014 - 2018
15.4. Market Size (US$ Mn) and Volume (Tons) Forecast By Market Taxonomy, 2019 - 2029
15.4.1. By Country
15.4.1.1. Brazil
15.4.1.2. Mexico
15.4.1.3. Argentina
15.4.1.4. Rest of Latin America
15.4.2. By Source
15.4.3. By Form
15.4.4. By Collagen Type
15.4.5. By End Use
15.4.6. By Sales Channel
15.5. Market Attractiveness Analysis
15.5.1. By Country
15.5.2. By Source
15.5.3. By Form
15.5.4. By Collagen Type
15.5.5. By End Use
15.5.6. By Sales Channel
15.6. Market Trends
15.7. Key Market Participants - Intensity Mapping
15.8. Drivers and Restraints - Impact Analysis
16. Europe Hydrolyzed Collagen Market Analysis 2014-2018 and Forecast 2019-2029
16.1. Introduction
16.2. Pricing Analysis
16.3. Historical Market Size (US$ Mn) and Volume (Tons) Trend Analysis By Market Taxonomy, 2014 - 2018
16.4. Market Size (US$ Mn) and Volume (Tons) Forecast By Market Taxonomy, 2019 - 2029
16.4.1. By Country
16.4.1.1. EU-5
16.4.1.2. Nordic Countries
16.4.1.3. BENELUX
16.4.1.4. Russia
16.4.1.5. Rest of Europe
16.4.2. By Source
16.4.3. By Form
16.4.4. By Collagen Type
16.4.5. By End Use
16.4.6. By Sales Channel
16.5. Market Attractiveness Analysis
16.5.1. By Country
16.5.2. By Source
16.5.3. By Form
16.5.4. By Collagen Type
16.5.5. By End Use
16.5.6. By Sales Channel
16.6. Market Trends
16.7. Key Market Participants - Intensity Mapping
16.8. Drivers and Restraints - Impact Analysis
17. Asia Pacific Excluding Japan (APEJ) Hydrolyzed Collagen Market Analysis 2014-2018 and Forecast 2019-2029
17.1. Introduction
17.2. Pricing Analysis
17.3. Historical Market Size (US$ Mn) and Volume (Tons) Trend Analysis By Market Taxonomy, 2014 - 2018
17.4. Market Size (US$ Mn) and Volume (Tons) Forecast By Market Taxonomy, 2019 - 2029
17.4.1. By Country
17.4.1.1. China
17.4.1.2. India
17.4.1.3. South Korea
17.4.1.4. ASSEAN
17.4.2. By Source
17.4.3. By Form
17.4.4. By Collagen Type
17.4.5. By End Use
17.4.6. By Sales Channel
17.5. Market Attractiveness Analysis
17.5.1. By Country
17.5.2. By Source
17.5.3. By Form
17.5.4. By Collagen Type
17.5.5. By End Use
17.5.6. By Sales Channel
17.6. Market Trends
17.7. Key Market Participants - Intensity Mapping
17.8. Drivers and Restraints - Impact Analysis
18. Oceania Hydrolyzed Collagen Market Analysis 2014-2018 and Forecast 2019-2029
18.1. Introduction
18.2. Pricing Analysis
18.3. Historical Market Size (US$ Mn) and Volume (Tons) Trend Analysis By Market Taxonomy, 2014 - 2018
18.4. Market Size (US$ Mn) and Volume (Tons) Forecast By Market Taxonomy, 2019 - 2029
18.4.1. By Country
18.4.1.1. Australia
18.4.1.2. New Zealand
18.4.2. By Source
18.4.3. By Form
18.4.4. By Collagen Type
18.4.5. By End Use
18.4.6. By Sales Channel
18.5. Market Attractiveness Analysis
18.5.1. By Country
18.5.2. By Source
18.5.3. By Form
18.5.4. By Collagen Type
18.5.5. By End Use
18.5.6. By Sales Channel
18.6. Market Trends
18.7. Key Market Participants - Intensity Mapping
18.8. Drivers and Restraints - Impact Analysis
19. Middle East and Africa Hydrolyzed Collagen Market Analysis 2014-2018 and Forecast 2019-2029
19.1. Introduction
19.2. Pricing Analysis
19.3. Historical Market Size (US$ Mn) and Volume (Tons) Trend Analysis By Market Taxonomy, 2014 - 2018
19.4. Market Size (US$ Mn) and Volume (Tons) Forecast By Market Taxonomy, 2019 - 2029
19.4.1. By Country
19.4.1.1. GCC Countries
19.4.1.2. Turkey
19.4.1.3. Israel
19.4.1.4. South Africa
19.4.1.5. Rest of Middle East and Africa
19.4.2. By Product Type
19.4.3. By Source
19.4.4. By Form
19.4.5. By Collagen Type
19.4.6. By End Use
19.4.7. By Sales Channel
19.5. Market Attractiveness Analysis
19.5.1. By Country
19.5.2. By Source
19.5.3. By Form
19.5.4. By Collagen Type
19.5.5. By End Use
19.5.6. By Sales Channel
19.6. Market Trends
19.7. Key Market Participants - Intensity Mapping
19.8. Drivers and Restraints - Impact Analysis
20. Japan Hydrolyzed Collagen Market Analysis 2014-2018 and Forecast 2019-2029
20.1. Introduction
20.2. Pricing Analysis
20.3. Historical Market Size (US$ Mn) and Volume (Tons) Trend Analysis By Market Taxonomy, 2014 - 2018
20.4. Market Size (US$ Mn) and Volume (Tons) Forecast By Market Taxonomy, 2019 - 2029
20.4.1. By Product Type
20.4.2. By Source
20.4.3. By Form
20.4.4. By Collagen Type
20.4.5. By End Use
20.4.6. By Sales Channel
20.5. Market Attractiveness Analysis
20.5.1. By Source
20.5.2. By Form
20.5.3. By Collagen Type
20.5.4. By End Use
20.5.5. By Sales Channel
20.6. Market Trends
20.7. Key Market Participants - Intensity Mapping
20.8. Drivers and Restraints - Impact Analysis
21. Market Structure Analysis
21.1. Market Analysis by Tier of Companies (Hydrolyzed Collagen)
21.2. Market Concentration
21.3. Market Share Analysis of Top Players
21.4. Market Presence Analysis
22. Competition Analysis
22.1. Competition Dashboard
22.2. Pricing Analysis by Competition
22.3. Competition Benchmarking
22.4. Competition Deep Dive
22.4.1. Gelita AG
22.4.1.1. Overview
22.4.1.2. Product Portfolio
22.4.1.3. Profitability by Market Segments (Product/Channel/Region)
22.4.1.4. Sales Footprint
22.4.1.5. Strategy Overview
22.4.1.5.1. Marketing Strategy
22.4.1.5.2. Product Strategy
22.4.1.5.3. Channel Strategy
22.4.2. Rousselot
22.4.2.1.1. Marketing Strategy
22.4.2.1.2. Product Strategy
22.4.2.1.3. Channel Strategy
22.4.3. Nitta Gelatin, Inc.
22.4.3.1.1. Marketing Strategy
22.4.3.1.2. Product Strategy
22.4.3.1.3. Channel Strategy
22.4.4. Hainan Huayan Collagen Biotech Co, Ltd.
22.4.4.1.1. Marketing Strategy
22.4.4.1.2. Product Strategy
22.4.4.1.3. Channel Strategy
22.4.5. Nippi Collagen
22.4.5.1.1. Marketing Strategy
22.4.5.1.2. Product Strategy
22.4.5.1.3. Channel Strategy
22.4.6. NeoCell Corporation
22.4.6.1.1. Marketing Strategy
22.4.6.1.2. Product Strategy
22.4.6.1.3. Channel Strategy
22.4.7. Giant Sports International Inc.
22.4.7.1.1. Marketing Strategy
22.4.7.1.2. Product Strategy
22.4.7.1.3. Channel Strategy
22.4.8. Beijing Semnl Biotechnology Co, Ltd
22.4.8.1.1. Marketing Strategy
22.4.8.1.2. Product Strategy
22.4.8.1.3. Channel Strategy
22.4.9. Codeage
22.4.9.1.1. Marketing Strategy
22.4.9.1.2. Product Strategy
22.4.9.1.3. Channel Strategy
22.4.10. Amicogen, Inc.
22.4.10.1.1. Marketing Strategy
22.4.10.1.2. Product Strategy
22.4.10.1.3. Channel Strategy
22.4.11. BioCell Technology LLC
22.4.11.1.1. Marketing Strategy
22.4.11.1.2. Product Strategy
22.4.11.1.3. Channel Strategy
22.4.12. Weishardt
22.4.12.1.1. Marketing Strategy
22.4.12.1.2. Product Strategy
22.4.12.1.3. Channel Strategy
22.4.13. Antler Farms
22.4.13.1.1. Marketing Strategy
22.4.13.1.2. Product Strategy
22.4.13.1.3. Channel Strategy
22.4.14. Connoils LLC
22.4.14.1.1. Marketing Strategy
22.4.14.1.2. Product Strategy
22.4.14.1.3. Channel Strategy
22.4.15. Perfect Supplements
22.4.15.1.1. Marketing Strategy
22.4.15.1.2. Product Strategy
22.4.15.1.3. Channel Strategy
22.4.16. Other Prominent Players (on Additional Request)
22.4.16.1.1. Marketing Strategy
22.4.16.1.2. Product Strategy
22.4.16.1.3. Channel Strategy
23. Assumptions and Acronyms Used
24. Research Methodology
List of Table
Table 01: Global Hydrolyzed Collagen Market Value (US$ Mn) and Forecast by Region, 2019–2029
Table 02: Global Hydrolyzed Collagen Market Volume (Metric Tons) and Forecast by Region, 2019–2029
Table 03: Global Hydrolyzed Collagen Market Value (US$ Mn) and Forecast by Source, 2019–2029
Table 04: Global Hydrolyzed Collagen Market Volume (Metric Tons) and Forecast by Source, 2019–2029
Table 05: Global Hydrolyzed Collagen Market Value (US$ Mn) and Forecast by Form, 2019–2029
Table 06: Global Hydrolyzed Collagen Market Volume (Metric Tons) and Forecast by Form, 2019–2029
Table 07: Global Hydrolyzed Collagen Market Value (US$ Mn) and Forecast by Collaen Type, 2019–2029
Table 08: Global Hydrolyzed Collagen Market Volume (Metric Tons) and Forecast by Collaen Type, 2019–2029
Table 09: Global Hydrolyzed Collagen Market Value (US$ Mn) and Forecast by End Use, 2019–2029
Table 010: Global Hydrolyzed Collagen Market Volume (Metric Tons) and Forecast by End Use, 2019–2029
Table 011: Global Hydrolyzed Collagen Market Value (US$ Mn) and Forecast by Sales Channel, 2019–2029
Table 012: Global Hydrolyzed Collagen Market Volume (Metric Tons) and Forecast by Sales Channel, 2019–2029
Table 13: North America Hydrolyzed Collagen Market Value (US$ Mn) and Forecast by Country, 2019–2029
Table 14: North America Hydrolyzed Collagen Market Volume (Metric Tons) and Forecast by Country, 2019–2029
Table 15: North America Hydrolyzed Collagen Market Value (US$ Mn) and Forecast by Source, 2019–2029
Table 16: North America Hydrolyzed Collagen Market Volume (Metric Tons) and Forecast by Source, 2019–2029
Table 17: North America Hydrolyzed Collagen Market Value (US$ Mn) and Forecast by Form, 2019–2029
Table 18: North America Hydrolyzed Collagen Market Volume (Metric Tons) and Forecast by Form, 2019–2029
Table 19: North America Hydrolyzed Collagen Market Value (US$ Mn) and Forecast by Collagen Type, 2019–2029
Table 20: North America Hydrolyzed Collagen Market Volume (Metric Tons) and Forecast by Collagen Type, 2019–2029
Table 21: North America Hydrolyzed Collagen Market Value (US$ Mn) and Forecast by End Use, 2019–2029
Table 22: North America Hydrolyzed Collagen Market Volume (Metric Tons) and Forecast by End Use,
2019–2029
Table 23: North America Hydrolyzed Collagen Market Value (US$ Mn) and Forecast by Sales Channel, 2019–2029
Table 24: North America Hydrolyzed Collagen Market Volume (Metric Tons) and Forecast by Sales Channel, 2019–2029
Table 25: Latin America Hydrolyzed Collagen Market Value (US$ Mn) and Forecast by Country, 2019–2029
Table 26: Latin America Hydrolyzed Collagen Market Volume (Metric Tons) and Forecast by Country, 2019–2029
Table 27: Latin America Hydrolyzed Collagen Market Value (US$ Mn) and Forecast by Source, 2019–2029
Table 28: Latin America Hydrolyzed Collagen Market Volume (Metric Tons) and Forecast by Source, 2019–2029
Table 29: Latin America Hydrolyzed Collagen Market Value (US$ Mn) and Forecast by Form, 2019–2029
Table 30: Latin America Hydrolyzed Collagen Market Volume (Metric Tons) and Forecast by Form, 2019–2029
Table 31: Latin America Hydrolyzed Collagen Market Value (US$ Mn) and Forecast by Collagen Type, 2019–2029
Table 32: Latin America Hydrolyzed Collagen Market Volume (Metric Tons) and Forecast by Collagen Type, 2019–2029
Table 33: Latin America Hydrolyzed Collagen Market Value (US$ Mn) and Forecast by End Use, 2019–2029
Table 34: Latin America Hydrolyzed Collagen Market Volume (Metric Tons) and Forecast by End Use,
2019–2029
Table 35: Latin America Hydrolyzed Collagen Market Value (US$ Mn) and Forecast by Sales Channel, 2019–2029
Table 36: Latin America Hydrolyzed Collagen Market Volume (Metric Tons) and Forecast by Sales Channel, 2019–2029
Table 37: Europe Hydrolyzed Collagen Market Value (US$ Mn) and Forecast by Country, 2019–2029
Table 38: Europe Hydrolyzed Collagen Market Volume (Metric Tons) and Forecast by Country, 2019–2029
Table 39: Europe Hydrolyzed Collagen Market Value (US$ Mn) and Forecast by Source, 2019–2029
Table 40: Europe Hydrolyzed Collagen Market Volume (Metric Tons) and Forecast by Source, 2019–2029
Table 41: Europe Hydrolyzed Collagen Market Value (US$ Mn) and Forecast by Form, 2019–2029
Table 42: Europe Hydrolyzed Collagen Market Volume (Metric Tons) and Forecast by Form, 2019–2029
Table 43: Europe Hydrolyzed Collagen Market Value (US$ Mn) and Forecast by Collagen Type, 2019–2029
Table 44: Europe Hydrolyzed Collagen Market Volume (Metric Tons) and Forecast by Collagen Type, 2019–2029
Table 45: Europe Hydrolyzed Collagen Market Value (US$ Mn) and Forecast by End Use, 2019–2029
Table 46: Europe Hydrolyzed Collagen Market Volume (Metric Tons) and Forecast by End Use, 2019–2029
Table 47: Europe Hydrolyzed Collagen Market Value (US$ Mn) and Forecast by Sales Channel, 2019–2029
Table 48: Europe Hydrolyzed Collagen Market Volume (Metric Tons) and Forecast by Sales Channel, 2019–2029
Table 49: APEJ Hydrolyzed Collagen Market Value (US$ Mn) and Forecast by Country, 2019–2029
Table 50: APEJ Hydrolyzed Collagen Market Volume (Metric Tons) and Forecast by Country, 2019–2029
Table 51: APEJ Hydrolyzed Collagen Market Value (US$ Mn) and Forecast by Source, 2019–2029
Table 52: APEJ Hydrolyzed Collagen Market Volume (Metric Tons) and Forecast by Source, 2019–2029
Table 53: APEJ Hydrolyzed Collagen Market Value (US$ Mn) and Forecast by Form, 2019–2029
Table 54: APEJ Hydrolyzed Collagen Market Volume (Metric Tons) and Forecast by Form, 2019–2029
Table 55: APEJ Hydrolyzed Collagen Market Value (US$ Mn) and Forecast by Collagen Type, 2019–2029
Table 56: APEJ Hydrolyzed Collagen Market Volume (Metric Tons) and Forecast by Collagen Type, 2019–2029
Table 57: APEJ Hydrolyzed Collagen Market Value (US$ Mn) and Forecast by End Use, 2019–2029
Table 58: APEJ Hydrolyzed Collagen Market Volume (Metric Tons) and Forecast by End Use, 2019–2029
Table 59: APEJ Hydrolyzed Collagen Market Value (US$ Mn) and Forecast by Sales Channel, 2019–2029
Table 60: APEJ Hydrolyzed Collagen Market Volume (Metric Tons) and Forecast by Sales Channel, 2019–2029
Table 61: Oceania Hydrolyzed Collagen Market Value (US$ Mn) and Forecast by Country, 2019–2029
Table 62: Oceania Hydrolyzed Collagen Market Volume (Metric Tons) and Forecast by Country, 2019–2029
Table 63: Oceania Hydrolyzed Collagen Market Value (US$ Mn) and Forecast by Source, 2019–2029
Table 64: Oceania Hydrolyzed Collagen Market Volume (Metric Tons) and Forecast by Source, 2019–2029
Table 65: Oceania Hydrolyzed Collagen Market Value (US$ Mn) and Forecast by Form, 2019–2029
Table 66: Oceania Hydrolyzed Collagen Market Volume (Metric Tons) and Forecast by Form, 2019–2029
Table 67: Oceania Hydrolyzed Collagen Market Value (US$ Mn) and Forecast by Collagen Type, 2019–2029
Table 68: Oceania Hydrolyzed Collagen Market Volume (Metric Tons) and Forecast by Collagen Type, 2019–2029
Table 69: Oceania Hydrolyzed Collagen Market Value (US$ Mn) and Forecast by End Use, 2019–2029
Table 70: Oceania Hydrolyzed Collagen Market Volume (Metric Tons) and Forecast by End Use, 2019–2029
Table 71: Oceania Hydrolyzed Collagen Market Value (US$ Mn) and Forecast by Sales Channel, 2019–2029
Table 72: Oceania Hydrolyzed Collagen Market Volume (Metric Tons) and Forecast by Sales Channel, 2019–2029
Table 73: Middle East & Africa Hydrolyzed Collagen Market Value (US$ Mn) and Forecast by Country, 2019–2029
Table 74: Middle East & Africa Hydrolyzed Collagen Market Volume (Metric Tons) and Forecast by Country, 2019–2029
Table 75: Middle East & Africa Hydrolyzed Collagen Market Value (US$ Mn) and Forecast by Source, 2019–2029
Table 76: Middle East & Africa Hydrolyzed Collagen Market Volume (Metric Tons) and Forecast by Source, 2019–2029
Table 77: Middle East & Africa Hydrolyzed Collagen Market Value (US$ Mn) and Forecast by Form, 2019–2029
Table 78: Middle East & Africa Hydrolyzed Collagen Market Volume (Metric Tons) and Forecast by Form, 2019–2029
Table 79: Middle East & Africa Hydrolyzed Collagen Market Value (US$ Mn) and Forecast by Collagen Type, 2019–2029
Table 80: Middle East & Africa Hydrolyzed Collagen Market Volume (Metric Tons) and Forecast by Collagen Type,
2019–2029
Table 81: Middle East & Africa Hydrolyzed Collagen Market Value (US$ Mn) and Forecast by End Use,
2019–2029
Table 82: Middle East & Africa Hydrolyzed Collagen Market Volume (Metric Tons) and Forecast by End Use,
2019–2029
Table 83: Middle East & Africa Hydrolyzed Collagen Market Value (US$ Mn) and Forecast by Sales Channel, 2019–2029
Table 84: Middle East & Africa Hydrolyzed Collagen Market Volume (Metric Tons) and Forecast by Sales Channel,
2019–2029
Table 85: Japan Hydrolyzed Collagen Market Value (US$ Mn) and Forecast by Country, 2019–2029
Table 86: Japan Hydrolyzed Collagen Market Volume (Metric Tons) and Forecast by Country, 2019–2029
Table 87: Japan Hydrolyzed Collagen Market Value (US$ Mn) and Forecast by Source, 2019–2029
Table 88: Japan Hydrolyzed Collagen Market Volume (Metric Tons) and Forecast by Source, 2019–2029
Table 89: Japan Hydrolyzed Collagen Market Value (US$ Mn) and Forecast by Form, 2019–2029
Table 90: Japan Hydrolyzed Collagen Market Volume (Metric Tons) and Forecast by Form, 2019–2029
Table 91: Japan Hydrolyzed Collagen Market Value (US$ Mn) and Forecast by Collagen Type, 2019–2029
Table 92: Japan Hydrolyzed Collagen Market Volume (Metric Tons) and Forecast by Collagen Type, 2019–2029
Table 93: Japan Hydrolyzed Collagen Market Value (US$ Mn) and Forecast by End Use, 2019–2029
Table 94: Japan Hydrolyzed Collagen Market Volume (Metric Tons) and Forecast by End Use, 2019–2029
Table 95: Japan Hydrolyzed Collagen Market Value (US$ Mn) and Forecast by Sales Channel, 2019–2029
Table 96: Japan Hydrolyzed Collagen Market Volume (Metric Tons) and Forecast by Sales Channel, 2019–2029
List of Figure
Figure 01: Global Hydrolyzed Collagen Market Value (US$ Mn) and Volume (MT) Forecast, 2019–2029
Figure 02: Global Hydrolyzed Collagen Market Absolute $ Opportunity (US$ Mn), 2019?2029
Figure 03: Global Hydrolyzed Collagen Market Value (US$ Mn) and % Growth by Region, 2019 & 2029
Figure 04: Global Hydrolyzed Collagen Market Y-o-Y Growth Rate by Region, 2019 - 2029
Figure 05: Global Hydrolyzed Collagen Market Value (US$ Mn) and % Growth by Source, 2019 & 2029
Figure 06: Global Hydrolyzed Collagen Market Y-o-Y Growth Rate by Source, 2019 - 2029
Figure 07: Global Hydrolyzed Collagen Market Value (US$ Mn) and % Growth by Form, 2019 & 2029
Figure 08: Global Hydrolyzed Collagen Market Y-o-Y Growth Rate by Form, 2019 - 2029
Figure 09: Global Hydrolyzed Collagen Market Value (US$ Mn) and % Growth by Collagen Type, 2019 & 2029
Figure 10: Global Hydrolyzed Collagen Market Y-o-Y Growth Rate by Collagen Type, 2019 - 2029
Figure 11: Global Hydrolyzed Collagen Market Value (US$ Mn) and % Growth by End Use, 2019 & 2029
Figure 12: Global Hydrolyzed Collagen Market Y-o-Y Growth Rate by End Use, 2019 - 2029
Figure 13: Global Hydrolyzed Collagen Market Value (US$ Mn) and % Growth by Sales Channel, 2019 & 2029
Figure 14: Global Hydrolyzed Collagen Market Y-o-Y Growth Rate by Sales Channel, 2019 - 2029
Figure 15: Global Hydrolyzed Collagen Market Attractiveness Analysis by Region, 2019 - 2029
Figure 16: Global Hydrolyzed Collagen Market Attractiveness Analysis by Source, 2019 - 2029
Figure 17: Global Hydrolyzed Collagen Market Attractiveness Analysis by Form , 2019 - 2029
Figure 18: Global Hydrolyzed Collagen Market Attractiveness Analysis by Collagen Type, 2019 - 2029
Figure 19: Global Hydrolyzed Collagen Market Attractiveness Analysis by End Use, 2019 - 2029
Figure 20: Global Hydrolyzed Collagen Market Attractiveness Analysis by Sales Channel, 2019 - 2029
Figure 21: North America Hydrolyzed Collagen Market Value (US$ Mn) and % Growth by Country, 2019 & 2029
Figure 22: North America Hydrolyzed Collagen Market Y-o-Y Growth Rate by Country, 2019 - 2029
Figure 23: North America Hydrolyzed Collagen Market Value (US$ Mn) and % Growth by Source, 2019 & 2029
Figure 24: North America Hydrolyzed Collagen Market Y-o-Y Growth Rate by Source, 2019 - 2029
Figure 25: North America Hydrolyzed Collagen Market Value (US$ Mn) and % Growth by Form, 2019 & 2029
Figure 26: North America Hydrolyzed Collagen Market Y-o-Y Growth Rate by Form, 2019 - 2029
Figure 27: North America Hydrolyzed Collagen Market Value (US$ Mn) and % Growth by Collagen Type, 2019 & 2029
Figure 28: North America Hydrolyzed Collagen Market Y-o-Y Growth Rate by Collagen Type, 2019 - 2029
Figure 29: North America Hydrolyzed Collagen Market Value (US$ Mn) and % Growth by End Use,
2019 & 2029
Figure 30: North America Hydrolyzed Collagen Market Y-o-Y Growth Rate by End Use, 2019 - 2029
Figure 31: North America Hydrolyzed Collagen Market Value (US$ Mn) and % Growth by Sales Channel, 2019 & 2029
Figure 32: North America Hydrolyzed Collagen Market Y-o-Y Growth Rate by Sales Channel, 2019 - 2029
Figure 33: North America Hydrolyzed Collagen Market Attractiveness Analysis by Region, 2019 - 2029
Figure 34: North America Hydrolyzed Collagen Market Attractiveness Analysis by Source, 2019 - 2029
Figure 35: North America Hydrolyzed Collagen Market Attractiveness Analysis by Form, 2019 - 2029
Figure 36: North America Hydrolyzed Collagen Market Attractiveness Analysis by Collagen Type, 2019 - 2029
Figure 37: North America Hydrolyzed Collagen Market Attractiveness Analysis by End Use, 2019 - 2029
Figure 38: North America Hydrolyzed Collagen Market Attractiveness Analysis by Sales Channel, 2019 - 2029
Figure 39: Latin America Hydrolyzed Collagen Market Value (US$ Mn) and % Growth by Country, 2019 & 2029
Figure 40: Latin America Hydrolyzed Collagen Market Y-o-Y Growth Rate by Country, 2019 - 2029
Figure 41: Latin America Hydrolyzed Collagen Market Value (US$ Mn) and % Growth by Source, 2019 & 2029
Figure 42: Latin America Hydrolyzed Collagen Market Y-o-Y Growth Rate by Source, 2019 - 2029
Figure 43: Latin America Hydrolyzed Collagen Market Value (US$ Mn) and % Growth by Form, 2019 & 2029
Figure 44: Latin America Hydrolyzed Collagen Market Y-o-Y Growth Rate by Form, 2019 - 2029
Figure 45: Latin America Hydrolyzed Collagen Market Value (US$ Mn) and % Growth by Collagen Type, 2019 & 2029
Figure 46: Latin America Hydrolyzed Collagen Market Y-o-Y Growth Rate by Collagen Type, 2019 - 2029
Figure 47: Latin America Hydrolyzed Collagen Market Value (US$ Mn) and % Growth by End Use, 2019 & 2029
Figure 48: Latin America Hydrolyzed Collagen Market Y-o-Y Growth Rate by End Use, 2019 - 2029
Figure 49: Latin America Hydrolyzed Collagen Market Value (US$ Mn) and % Growth by Sales Channel, 2019 & 2029
Figure 50: Latin America Hydrolyzed Collagen Market Y-o-Y Growth Rate by Sales Channel, 2019 - 2029
Figure 51: Latin America Hydrolyzed Collagen Market Attractiveness Analysis by Region, 2019 - 2029
Figure 52: Latin America Hydrolyzed Collagen Market Attractiveness Analysis by Source, 2019 - 2029
Figure 53: Latin America Hydrolyzed Collagen Market Attractiveness Analysis by Form, 2019 - 2029
Figure 54: Latin America Hydrolyzed Collagen Market Attractiveness Analysis by Collagen Type, 2019 - 2029
Figure 55: Latin America Hydrolyzed Collagen Market Attractiveness Analysis by End Use, 2019 - 2029
Figure 56: Latin America Hydrolyzed Collagen Market Attractiveness Analysis by Sales Channel, 2019 - 2029
Figure 57: Europe Hydrolyzed Collagen Market Value (US$ Mn) and % Growth by Country, 2019 & 2029
Figure 58: Europe Hydrolyzed Collagen Market Y-o-Y Growth Rate by Country, 2019 - 2029
Figure 59: Europe Hydrolyzed Collagen Market Value (US$ Mn) and % Growth by Source, 2019 & 2029
Figure 60: Europe Hydrolyzed Collagen Market Y-o-Y Growth Rate by Source, 2019 - 2029
Figure 61: Europe Hydrolyzed Collagen Market Value (US$ Mn) and % Growth by Form, 2019 & 2029
Figure 62: Europe Hydrolyzed Collagen Market Y-o-Y Growth Rate by Form, 2019 - 2029
Figure 63: Europe Hydrolyzed Collagen Market Value (US$ Mn) and % Growth by Collagen Type, 2019 & 2029
Figure 64: Europe Hydrolyzed Collagen Market Y-o-Y Growth Rate by Collagen Type, 2019 - 2029
Figure 65: Europe Hydrolyzed Collagen Market Value (US$ Mn) and % Growth by End Use, 2019 & 2029
Figure 66: Europe Hydrolyzed Collagen Market Y-o-Y Growth Rate by End Use, 2019 - 2029
Figure 67: Europe Hydrolyzed Collagen Market Value (US$ Mn) and % Growth by Sales Channel, 2019 & 2029
Figure 68: Europe Hydrolyzed Collagen Market Y-o-Y Growth Rate by Sales Channel, 2019 - 2029
Figure 69: Europe Hydrolyzed Collagen Market Attractiveness Analysis by Region, 2019 - 2029
Figure 70: Europe Hydrolyzed Collagen Market Attractiveness Analysis by Source, 2019 - 2029
Figure 71: Europe Hydrolyzed Collagen Market Attractiveness Analysis by Form, 2019 - 2029
Figure 72: Europe Hydrolyzed Collagen Market Attractiveness Analysis by Collagen Type, 2019 - 2029
Figure 73: Europe Hydrolyzed Collagen Market Attractiveness Analysis by End Use, 2019 - 2029
Figure 74: Europe Hydrolyzed Collagen Market Attractiveness Analysis by Sales Channel, 2019 - 2029
Figure 75: APEJ Hydrolyzed Collagen Market Value (US$ Mn) and % Growth by Country, 2019 & 2029
Figure 76: APEJ Hydrolyzed Collagen Market Y-o-Y Growth Rate by Country, 2019 - 2029
Figure 77: APEJ Hydrolyzed Collagen Market Value (US$ Mn) and % Growth by Source, 2019 & 2029
Figure 78: APEJ Hydrolyzed Collagen Market Y-o-Y Growth Rate by Source, 2019 - 2029
Figure 79: APEJ Hydrolyzed Collagen Market Value (US$ Mn) and % Growth by Form, 2019 & 2029
Figure 80: APEJ Hydrolyzed Collagen Market Y-o-Y Growth Rate by Form, 2019 - 2029
Figure 81: APEJ Hydrolyzed Collagen Market Value (US$ Mn) and % Growth by Collagen Type, 2019 & 2029
Figure 82: APEJ Hydrolyzed Collagen Market Y-o-Y Growth Rate by Collagen Type, 2019 - 2029
Figure 83: APEJ Hydrolyzed Collagen Market Value (US$ Mn) and % Growth by End Use, 2019 & 2029
Figure 84: APEJ Hydrolyzed Collagen Market Y-o-Y Growth Rate by End Use, 2019 - 2029
Figure 85: APEJ Hydrolyzed Collagen Market Value (US$ Mn) and % Growth by Sales Channel, 2019 & 2029
Figure 86: APEJ Hydrolyzed Collagen Market Y-o-Y Growth Rate by Sales Channel, 2019 - 2029
Figure 87: APEJ Hydrolyzed Collagen Market Attractiveness Analysis by Region, 2019 - 2029
Figure 88: APEJ Hydrolyzed Collagen Market Attractiveness Analysis by Source, 2019 - 2029
Figure 89: APEJ Hydrolyzed Collagen Market Attractiveness Analysis by Form, 2019 - 2029
Figure 90: APEJ Hydrolyzed Collagen Market Attractiveness Analysis by Collagen Type, 2019 - 2029
Figure 91: APEJ Hydrolyzed Collagen Market Attractiveness Analysis by End Use, 2019 - 2029
Figure 92: APEJ Hydrolyzed Collagen Market Attractiveness Analysis by Sales Channel, 2019 - 2029
Figure 93: Oceania Hydrolyzed Collagen Market Value (US$ Mn) and % Growth by Country, 2019 & 2029
Figure 94: Oceania Hydrolyzed Collagen Market Y-o-Y Growth Rate by Country, 2019 - 2029
Figure 95: Oceania Hydrolyzed Collagen Market Value (US$ Mn) and % Growth by Source, 2019 & 2029
Figure 96: Oceania Hydrolyzed Collagen Market Y-o-Y Growth Rate by Source, 2019 - 2029
Figure 97: Oceania Hydrolyzed Collagen Market Value (US$ Mn) and % Growth by Form, 2019 & 2029
Figure 98: Oceania Hydrolyzed Collagen Market Y-o-Y Growth Rate by Form, 2019 - 2029
Figure 99: Oceania Hydrolyzed Collagen Market Value (US$ Mn) and % Growth by Collagen Type, 2019 & 2029
Figure 100: Oceania Hydrolyzed Collagen Market Y-o-Y Growth Rate by Collagen Type, 2019 - 2029
Figure 101: Oceania Hydrolyzed Collagen Market Value (US$ Mn) and % Growth by End Use, 2019 & 2029
Figure 102: Oceania Hydrolyzed Collagen Market Y-o-Y Growth Rate by End Use, 2019 - 2029
Figure 103: Oceania Hydrolyzed Collagen Market Value (US$ Mn) and % Growth by Sales Channel, 2019 & 2029
Figure 104: Oceania Hydrolyzed Collagen Market Y-o-Y Growth Rate by Sales Channel, 2019 - 2029
Figure 105: Oceania Hydrolyzed Collagen Market Attractiveness Analysis by Region, 2019 - 2029
Figure 106: Oceania Hydrolyzed Collagen Market Attractiveness Analysis by Source, 2019 - 2029
Figure 107: Oceania Hydrolyzed Collagen Market Attractiveness Analysis by Form, 2019 - 2029
Figure 108: Oceania Hydrolyzed Collagen Market Attractiveness Analysis by Collagen Type, 2019 - 2029
Figure 109: Oceania Hydrolyzed Collagen Market Attractiveness Analysis by End Use, 2019 - 2029
Figure 110: Oceania Hydrolyzed Collagen Market Attractiveness Analysis by Sales Channel, 2019 - 2029
Figure 111: Middle East & Africa Hydrolyzed Collagen Market Value (US$ Mn) and % Growth by Country, 2019 & 2029
Figure 112: Middle East & Africa Hydrolyzed Collagen Market Y-o-Y Growth Rate by Country, 2019 - 2029
Figure 113: Middle East & Africa Hydrolyzed Collagen Market Value (US$ Mn) and % Growth by Source, 2019 & 2029
Figure 114: Middle East & Africa Hydrolyzed Collagen Market Y-o-Y Growth Rate by Source, 2019 - 2029
Figure 115: Middle East & Africa Hydrolyzed Collagen Market Value (US$ Mn) and % Growth by Form, 2019 & 2029
Figure 116: Middle East & Africa Hydrolyzed Collagen Market Y-o-Y Growth Rate by Form, 2019 - 2029
Figure 117: Middle East & Africa Hydrolyzed Collagen Market Value (US$ Mn) and % Growth by Collagen Type,
2019 & 2029
Figure 118: Middle East & Africa Hydrolyzed Collagen Market Y-o-Y Growth Rate by Collagen Type, 2019 - 2029
Figure 119: Middle East & Africa Hydrolyzed Collagen Market Value (US$ Mn) and % Growth by End Use,
2019 & 2029
Figure 120: Middle East & Africa Hydrolyzed Collagen Market Y-o-Y Growth Rate by End Use, 2019 - 2029
Figure 121: Middle East & Africa Hydrolyzed Collagen Market Value (US$ Mn) and % Growth by Sales Channel,
2019 & 2029
Figure 122: Middle East & Africa Hydrolyzed Collagen Market Y-o-Y Growth Rate by Sales Channel, 2019 - 2029
Figure 123: Middle East & Africa Hydrolyzed Collagen Market Attractiveness Analysis by Region, 2019 - 2029
Figure 124: Middle East & Africa Hydrolyzed Collagen Market Attractiveness Analysis by Source, 2019 - 2029
Figure 125: Middle East & Africa Hydrolyzed Collagen Market Attractiveness Analysis by Form, 2019 - 2029
Figure 126: Middle East & Africa Hydrolyzed Collagen Market Attractiveness Analysis by Collagen Type, 2019 - 2029
Figure 127: Middle East & Africa Hydrolyzed Collagen Market Attractiveness Analysis by End Use,
2019 - 2029
Figure 128: Middle East & Africa Hydrolyzed Collagen Market Attractiveness Analysis by Sales Channel, 2019 - 2029
Figure 129: Japan Hydrolyzed Collagen Market Value (US$ Mn) and % Growth by Country, 2019 & 2029
Figure 130: Japan Hydrolyzed Collagen Market Y-o-Y Growth Rate by Country, 2019 - 2029
Figure 131: Japan Hydrolyzed Collagen Market Value (US$ Mn) and % Growth by Source, 2019 & 2029
Figure 132: Japan Hydrolyzed Collagen Market Y-o-Y Growth Rate by Source, 2019 - 2029
Figure 133: Japan Hydrolyzed Collagen Market Value (US$ Mn) and % Growth by Form, 2019 & 2029
Figure 134: Japan Hydrolyzed Collagen Market Y-o-Y Growth Rate by Form, 2019 - 2029
Figure 135: Japan Hydrolyzed Collagen Market Value (US$ Mn) and % Growth by Collagen Type, 2019 & 2029
Figure 136: Japan Hydrolyzed Collagen Market Y-o-Y Growth Rate by Collagen Type, 2019 - 2029
Figure 137: Japan Hydrolyzed Collagen Market Value (US$ Mn) and % Growth by End Use, 2019 & 2029
Figure 138: Japan Hydrolyzed Collagen Market Y-o-Y Growth Rate by End Use, 2019 - 2029
Figure 139: Japan Hydrolyzed Collagen Market Value (US$ Mn) and % Growth by Sales Channel, 2019 & 2029
Figure 140: Japan Hydrolyzed Collagen Market Y-o-Y Growth Rate by Sales Channel, 2019 - 2029
Figure 141: Japan Hydrolyzed Collagen Market Attractiveness Analysis by Region, 2019 - 2029
Figure 142: Japan Hydrolyzed Collagen Market Attractiveness Analysis by Source, 2019 - 2029
Figure 143: Japan Hydrolyzed Collagen Market Attractiveness Analysis by Form, 2019 - 2029
Figure 144: Japan Hydrolyzed Collagen Market Attractiveness Analysis by Collagen Type, 2019 - 2029
Figure 145: Japan Hydrolyzed Collagen Market Attractiveness Analysis by End Use, 2019 - 2029
Figure 146: Japan Hydrolyzed Collagen Market Attractiveness Analysis by Sales Channel, 2019 - 2029
Copyright © Transparency Market Research, Inc. All Rights reserved
Trust Online

Hydrolyzed Collagen Market