
Reports
Reports
Hybrid additive manufacturing machines market - Snapshot
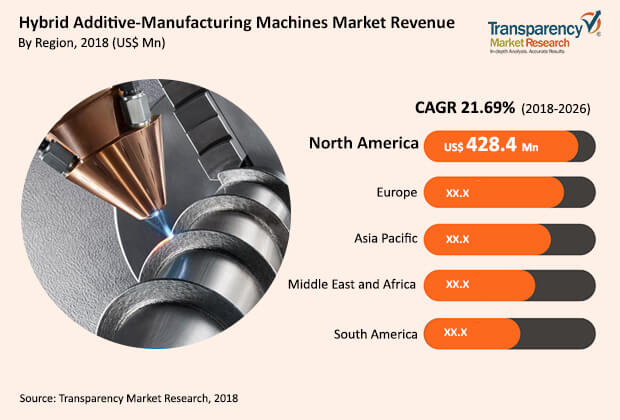
According to the report, the global hybrid additive-manufacturing machines market is likely to be influenced by the increasing adoption of hybrid additive-manufacturing machines across a wide range of industry verticals such as heavy industry, automotive, aerospace, and medical. Asia Pacific is projected to be at the forefront of global demand, with the market in the region expanding at a CAGR of 24.16% between 2018 and 2026. The global hybrid additive-manufacturing machines market is expected to reach US$ 6,757.1 Mn by 2026. The market is projected to expand at a CAGR of 21.69% during the forecast period.
Production segment is expected to be highly lucrative for the global hybrid additive-manufacturing machines market
Based on application, the global hybrid additive-manufacturing machines market is segmented into repair, production, and prototype. There has been a shift in the manufacturing of complex components by means of additive manufacturing instead of conventional manufacturing methods. Complex components with complex geometries are being manufactured efficiently with the help of hybrid additive-manufacturing machines, as the material is added layer by layer for the production, instead of milling out the material to carve the shape. This results into reduced time for production and significant savings in the material being used. This further results in reduced cost of production of components.
Aerospace segment is expected to dominate the hybrid additive-manufacturing machines market around the globe
In terms of vertical, the hybrid additive-manufacturing machines market is segregated into heavy industry, automotive, aerospace, medical, energy, electronics, and others. The aerospace segment is expected to hold a prominent share of the market, owing to the rising rate of adoption of additive manufacturing methods for manufacturing of critical components in the industry. The aerospace industry requires the manufacturing of complex components that are light weight and robust in nature. These components can be manufactured efficiently with the help of HAM machines instead of conventional manufacturing methods. In January 2018, Airbus, a prominent players in the aerospace industry, collaborated with Switzerland-based technology group, Oerlikon, for the manufacturing of structural titanium components for the company.
North America is expected to continue to hold a significant share in the overall market
North America is expected to hold a major share of the global market for hybrid additive-manufacturing machines during the forecast period. The expansion is primarily due to the booming hybrid additive-manufacturing machines marketplace with the presence of well-established players across the region, especially across countries such as the U.S. and Canada. Furthermore, North America is witnessing significant adoption of hybrid additive-manufacturing machines owing to the consistent expansion of the automotive industry.
The market in Europe is projected to expand at a significant CAGR during the forecast period. Additionally, many associations in the manufacturing space are entering into strategic partnerships to improve and promote their additive-manufacturing capabilities. For instance, In February 2018, CECIMO, a Europe-based association of the machine tool industry signed an agreement with EPMA, European Powder Metallurgy Association for the promotion of additive manufacturing and to support the industry in Europe from one application of 3D printing to the other.
Hybrid additive-manufacturing machines are gaining popularity across Asia Pacific, especially across the economies of China, Japan, and India. Increasing awareness in the region pertaining to the advantages associated with additive manufacturing and HAM machines is expected to fuel the hybrid additive-manufacturing machines market in the region. China is projected to hold a significant share of the market owing to the presence of industries with potential adopters of HAM machines for manufacturing of complex components.
DMG MORI Co., Ltd., Mazak Corporation, Matsuura Machinery Corporation, Stratasys Ltd, voxeljet AG, Optomec, SLM SOLUTIONS GROUP AG, are some of the major players operating in the hybrid additive-manufacturing machines market profiled in this study. Details such as financials, SWOT analysis, business strategies, recent developments, and other such strategic information pertaining to these players have been duly provided as part of company profiling.. Also, market players are establishing partnerships, entering into strategic M&A, and expanding in order to enhance their hybrid additive-manufacturing machines offerings worldwide.
Hybrid Additive Manufacturing Machines Market to Derive Gains from Increasing Support from Government Financing
Development of the world hybrid additive manufacturing machines market is predicted to acquire force with expanding mindfulness around a few benefits of the machines in various industry verticals. Hybrid additive manufacturing alludes to the technique or interaction of making objects from the strength of additive manufacturing, for example, 3D items. Hybrid manufacturing is a blend of subtractive manufacturing and additive manufacturing. These frameworks empower clients to make and complete the part in a solitary arrangement by diminishing blunders as additive manufacturing part doesn't need to leave one machine to be reset on a subsequent machine.
Despite the fact that utilization of hybrid additive manufacturing machines underway isn't yet standard, it could develop at a quicker speed in the coming years. Hybrid additive manufacturing machines beat conventional manufacturing strategies in delivering completely practical parts that are mind boggling in plan. The key growth driver of the worldwide hybrid additive manufacturing machines market are low production cost, developing government financing, headways in advancements and materials, and diminished intricacy of manufacturing plan. Since the principal specialized progression, for example tank polymerization, item creators and makers have had the option to quick the interaction of prototyping, plan, and creation enormously.
At present, countless progressions are made in additive manufacturing innovation that gives a wide scope of choices for makers, creators, and producers. For example, Direct Energy Deposition (DED) is an additive manufacturing technique, which could be utilized in hybrid arrangements. This innovation is viewed as an ideal choice for fixing key segments and delivering enormous metal parts as it is fit for making complex shapes. These elements are adding to the development of the worldwide hybrid additive manufacturing machines market.
1. Preface
1.1. Market Definition and Scope
1.2. Market Segmentation
1.3. Key Research Objectives
1.4. Research Highlights
2. Assumptions and Research Methodology
3. Executive Summary : Global Hybrid Additive-Manufacturing Machines Market
4. Key Industry Developments
5. Market Overview
5.1. Introduction
5.2. Market Dynamics
5.2.1. Drivers
5.2.2. Restraints
5.2.3. Opportunities
5.3. Porter’s Five Force Analysis
5.4. Key Trends
5.5. Ecosystem Analysis : Hybrid Additive-Manufacturing Machines Market
5.6. Market Outlook
6. Global Hybrid Additive-Manufacturing Machines Market Analysis and Forecasts, by Application
6.1. Overview & Definitions
6.2. Market Size (US$ Mn) Forecast, by Application, 2016 – 2026
6.2.1. Repair
6.2.2. Production
6.2.3. Prototype
6.3. Market Attractiveness by Application
7. Global Hybrid Additive-Manufacturing Machines Market Analysis and Forecasts, by Verticals
7.1. Overview & Definitions
7.2. Market Size (US$ Mn) Forecast, by Verticals , 2016 – 2026
7.2.1. Heavy Industry
7.2.2. Automotive
7.2.3. Aerospace
7.2.4. Medical
7.2.5. Energy
7.2.6. Electronics
7.2.7. Others
7.3. Market Attractiveness by Verticals
8. Global Hybrid Additive-Manufacturing Machines Market Analysis and Forecasts, by Region
8.1. Key Findings
8.2. Market Size (US$ Mn) Forecast, by Region, 2016 – 2026
8.2.1. North America
8.2.2. Europe
8.2.3. Asia Pacific
8.2.4. Middle East and Africa
8.2.5. South America
8.3. Market Attractiveness, by Country/Region
9. North America Hybrid Additive-Manufacturing Machines Market Analysis and Forecast
9.1. Key Trends
9.2. Market Size (US$ Mn) Forecast, by Application, 2016 – 2026
9.2.1. Repair
9.2.2. Production
9.2.3. Prototype
9.3. Market Size (US$ Mn) Forecast, by Verticals , 2016 – 2026
9.3.1. Heavy Industry
9.3.2. Automotive
9.3.3. Aerospace
9.3.4. Medical
9.3.5. Energy
9.3.6. Electronics
9.3.7. Others
9.4. Market Size (US$ Mn) Forecast, by Country, 2016 – 2026
9.4.1. U.S.
9.4.2. Canada
9.4.3. Rest of North America
9.5. U.S. Market Size (US$ Mn) Forecast, by Application, 2016 – 2026
9.5.1. Repair
9.5.2. Production
9.5.3. Prototype
9.6. U.S. Market Size (US$ Mn) Forecast, by Verticals , 2016 – 2026
9.6.1. Heavy Industry
9.6.2. Automotive
9.6.3. Aerospace
9.6.4. Medical
9.6.5. Energy
9.6.6. Electronics
9.6.7. Others
9.7. Canada Market Size (US$ Mn) Forecast, by Application, 2016 – 2026
9.7.1. Repair
9.7.2. Production
9.7.3. Prototype
9.8. Canada Market Size (US$ Mn) Forecast, by Verticals , 2016 – 2026
9.8.1. Heavy Industry
9.8.2. Automotive
9.8.3. Aerospace
9.8.4. Medical
9.8.5. Energy
9.8.6. Electronics
9.8.7. Others
9.9. Rest of North America Market Size (US$ Mn) Forecast, by Application, 2016 – 2026
9.9.1. Repair
9.9.2. Production
9.9.3. Prototype
9.10. Rest of North America Market Size (US$ Mn) Forecast, by Verticals , 2016 – 2026
9.10.1. Heavy Industry
9.10.2. Automotive
9.10.3. Aerospace
9.10.4. Medical
9.10.5. Energy
9.10.6. Electronics
9.10.7. Others
9.11. Market Attractiveness Analysis
9.11.1. By Application
9.11.2. By Verticals
9.11.3. By Country
10. Europe Hybrid Additive-Manufacturing Machines Market Analysis and Forecast
10.1. Key Trends
10.2. Market Size (US$ Mn) Forecast, by Application, 2016 – 2026
10.2.1. Repair
10.2.2. Production
10.2.3. Prototype
10.3. Market Size (US$ Mn) Forecast, by Verticals , 2016 – 2026
10.3.1. Heavy Industry
10.3.2. Automotive
10.3.3. Aerospace
10.3.4. Medical
10.3.5. Energy
10.3.6. Electronics
10.3.7. Others
10.4. Market Size (US$ Mn) Forecast, by Country, 2016 – 2026
10.4.1. U.K.
10.4.2. Germany
10.4.3. France
10.4.4. Rest of Europe
10.5. U.K Market Size (US$ Mn) Forecast, by Application, 2016 – 2026
10.5.1. Repair
10.5.2. Production
10.5.3. Prototype
10.6. U.K. Market Size (US$ Mn) Forecast, by Verticals, 2016 – 2026
10.6.1. Heavy Industry
10.6.2. Automotive
10.6.3. Aerospace
10.6.4. Medical
10.6.5. Energy
10.6.6. Electronics
10.6.7. Others
10.7. Germany Market Size (US$ Mn) Forecast, by Application, 2016 – 2026
10.7.1. Repair
10.7.2. Production
10.7.3. Prototype
10.8. Germany Market Size (US$ Mn) Forecast, by Verticals, 2016 – 2026
10.8.1. Heavy Industry
10.8.2. Automotive
10.8.3. Aerospace
10.8.4. Medical
10.8.5. Energy
10.8.6. Electronics
10.8.7. Others
10.9. France Market Size (US$ Mn) Forecast, by Application, 2016 – 2026
10.9.1. Repair
10.9.2. Production
10.9.3. Prototype
10.10. France Market Size (US$ Mn) Forecast, by Verticals, 2016 – 2026
10.10.1. Heavy Industry
10.10.2. Automotive
10.10.3. Aerospace
10.10.4. Medical
10.10.5. Energy
10.10.6. Electronics
10.10.7. Others
10.11. Rest of Europe Market Size (US$ Mn) Forecast, by Application, 2016 – 2026
10.11.1. Repair
10.11.2. Production
10.11.3. Prototype
10.12. Rest of Europe Market Size (US$ Mn) Forecast, by Verticals, 2016 – 2026
10.12.1. Heavy Industry
10.12.2. Automotive
10.12.3. Aerospace
10.12.4. Medical
10.12.5. Energy
10.12.6. Electronics
10.12.7. Others
10.13. Market Attractiveness Analysis
10.13.1. By Application
10.13.2. By Verticals
10.13.3. By Country
11. Asia Pacific Hybrid Additive-Manufacturing Machines Market Analysis and Forecast
11.1. Key Trends
11.2. Market Size (US$ Mn) Forecast, by Application, 2016 – 2026
11.2.1. Repair
11.2.2. Production
11.2.3. Prototype
11.3. Market Size (US$ Mn) Forecast, by Verticals , 2016 – 2026
11.3.1. Heavy Industry
11.3.2. Automotive
11.3.3. Aerospace
11.3.4. Medical
11.3.5. Energy
11.3.6. Electronics
11.3.7. Others
11.4. Market Size (US$ Mn) Forecast, by Country, 2016 – 2026
11.4.1. India
11.4.2. Japan
11.4.3. China
11.4.4. Rest of Asia Pacific
11.5. India Market Size (US$ Mn) Forecast, by Application, 2016 – 2026
11.5.1. Repair
11.5.2. Production
11.5.3. Prototype
11.6. India Market Size (US$ Mn) Forecast by Verticals , 2016 – 2026
11.6.1. Heavy Industry
11.6.2. Automotive
11.6.3. Aerospace
11.6.4. Medical
11.6.5. Energy
11.6.6. Electronics
11.6.7. Others
11.7. Japan Market Size (US$ Mn) Forecast, by Application, 2016 – 2026
11.7.1. Repair
11.7.2. Production
11.7.3. Prototype
11.8. Japan Market Size (US$ Mn) Forecast, by Verticals , 2016 – 2026
11.8.1. Heavy Industry
11.8.2. Automotive
11.8.3. Aerospace
11.8.4. Medical
11.8.5. Energy
11.8.6. Electronics
11.8.7. Others
11.9. China Market Size (US$ Mn) Forecast, by Application, 2016 – 2026
11.9.1. Repair
11.9.2. Production
11.9.3. Prototype
11.10. China Market Size (US$ Mn) Forecast, by Verticals , 2016 – 2026
11.10.1. Heavy Industry
11.10.2. Automotive
11.10.3. Aerospace
11.10.4. Medical
11.10.5. Energy
11.10.6. Electronics
11.10.7. Others
11.11. Rest of Asia Pacific Market Size (US$ Mn) Forecast, by Application, 2016 – 2026
11.11.1. Repair
11.11.2. Production
11.11.3. Prototype
11.12. Rest of Asia Pacific Market Size (US$ Mn) Forecast, by Verticals , 2016 – 2026
11.12.1. Heavy Industry
11.12.2. Automotive
11.12.3. Aerospace
11.12.4. Medical
11.12.5. Energy
11.12.6. Electronics
11.12.7. Others
11.13. Market Attractiveness Analysis
11.13.1. By Application
11.13.2. By Verticals
11.13.3. By Country
12. Middle East & Africa (MEA) Hybrid Additive-Manufacturing Machines Market Analysis and Forecast
12.1. Key Trends
12.2. Market Size (US$ Mn) Forecast, by Application, 2016 – 2026
12.2.1. Repair
12.2.2. Production
12.2.3. Prototype
12.3. Market Size (US$ Mn) Forecast, by Verticals , 2016 – 2026
12.3.1. Heavy Industry
12.3.2. Automotive
12.3.3. Aerospace
12.3.4. Medical
12.3.5. Energy
12.3.6. Electronics
12.3.7. Others
12.4. Market Size (US$ Mn) Forecast, by Country, 2016 – 2026
12.4.1. GCC Countries
12.4.2. South Africa
12.4.3. Rest of Middle East & Africa
12.5. GCC Countries Market Size (US$ Mn) Forecast, by Application, 2016 – 2026
12.5.1. Repair
12.5.2. Production
12.5.3. Prototype
12.6. GCC Countries Market Size (US$ Mn) Forecast, by Verticals , 2016 – 2026
12.6.1. Heavy Industry
12.6.2. Automotive
12.6.3. Aerospace
12.6.4. Medical
12.6.5. Energy
12.6.6. Electronics
12.6.7. Others
12.7. South Africa Market Size (US$ Mn) Forecast, by Application, 2016 – 2026
12.7.1. Repair
12.7.2. Production
12.7.3. Prototype
12.8. South Africa Market Size (US$ Mn) Forecast, by Verticals , 2016 – 2026
12.8.1. Heavy Industry
12.8.2. Automotive
12.8.3. Aerospace
12.8.4. Medical
12.8.5. Energy
12.8.6. Electronics
12.8.7. Others
12.9. Rest of Middle East & Africa Market Size (US$ Mn) Forecast, by Application, 2016 – 2026
12.9.1. Repair
12.9.2. Production
12.9.3. Prototype
12.10. Rest of Middle East & Africa Market Size (US$ Mn) Forecast, by Verticals , 2016 – 2026
12.10.1. Heavy Industry
12.10.2. Automotive
12.10.3. Aerospace
12.10.4. Medical
12.10.5. Energy
12.10.6. Electronics
12.10.7. Others
12.11. Market Attractiveness Analysis
12.11.1. By Application
12.11.2. By Verticals
12.11.3. By Country
13. South America Hybrid Additive-Manufacturing Machines Market Analysis and Forecast
13.1. Key Trends
13.2. Market Size (US$ Mn) Forecast, by Application, 2016 – 2026
13.2.1. Repair
13.2.2. Production
13.2.3. Prototype
13.3. Market Size (US$ Mn) Forecast, by Verticals , 2016 – 2026
13.3.1. Heavy Industry
13.3.2. Automotive
13.3.3. Aerospace
13.3.4. Medical
13.3.5. Energy
13.3.6. Electronics
13.3.7. Others
13.4. Market Size (US$ Mn) Forecast, by Country, 2016 – 2026
13.4.1. Brazil
13.4.2. Rest of South America
13.5. Brazil Market Size (US$ Mn) Forecast, by Application, 2016 – 2026
13.5.1. Repair
13.5.2. Production
13.5.3. Prototype
13.6. Brazil Market Size (US$ Mn) Forecast, by Verticals , 2016 – 2026
13.6.1. Heavy Industry
13.6.2. Automotive
13.6.3. Aerospace
13.6.4. Medical
13.6.5. Energy
13.6.6. Electronics
13.6.7. Others
13.7. Rest of South America Market Size (US$ Mn) Forecast, by Application, 2016 – 2026
13.7.1. Repair
13.7.2. Production
13.7.3. Prototype
13.8. Rest of South America Market Size (US$ Mn) Forecast, by Verticals , 2016 – 2026
13.8.1. Heavy Industry
13.8.2. Automotive
13.8.3. Aerospace
13.8.4. Medical
13.8.5. Energy
13.8.6. Electronics
13.8.7. Others
13.9. Market Attractiveness Analysis
13.9.1. By Application
13.9.2. By Verticals
13.9.3. By Country
14. Competition Landscape
14.1. Market Player – Competition Matrix
14.2. Market Share Analysis by Company (2017)
14.3. Company Profiles (Details – Overview, Financials, Recent Developments, SWOT, Strategy)
14.3.1. DMG MORI CO., LTD.
14.3.1.1. Market Presence, by Segment
14.3.1.2. Strategy
14.3.1.3. Revenue and Operating Profits
14.3.1.4. SWOT Analysis
14.3.2. Mazak Corporation
14.3.2.1. Market Presence, by Segment
14.3.2.2. Strategy
14.3.2.3. Revenue and Operating Profits
14.3.2.4. SWOT Analysis
14.3.3. Stratasys Ltd.
14.3.3.1. Market Presence, by Segment
14.3.3.2. Strategy
14.3.3.3. Revenue and Operating Profits
14.3.3.4. SWOT Analysis
14.3.4. voxeljet AG
14.3.4.1. Market Presence, by Segment
14.3.4.2. Strategy
14.3.4.3. Revenue and Operating Profits
14.3.4.4. SWOT Analysis
14.3.5. Optomec
14.3.5.1. Market Presence, by Segment
14.3.5.2. Strategy
14.3.5.3. Revenue and Operating Profits
14.3.5.4. SWOT Analysis
14.3.6. Renishaw plc
14.3.6.1. Market Presence, by Segment
14.3.6.2. Strategy
14.3.6.3. Revenue and Operating Profits
14.3.6.4. SWOT Analysis
14.3.7. 3D Systems, Inc.
14.3.7.1. Market Presence, by Segment
14.3.7.2. Strategy
14.3.7.3. Revenue and Operating Profits
14.3.7.4. SWOT Analysis
14.3.8. Matsuura Machinery Corporation
14.3.8.1. Market Presence, by Segment
14.3.8.2. Strategy
14.3.8.3. Revenue and Operating Profits
14.3.8.4. SWOT Analysis
14.3.9. General Electric Co.
14.3.9.1. Market Presence, by Segment
14.3.9.2. Strategy
14.3.9.3. Revenue and Operating Profits
14.3.9.4. SWOT Analysis
14.3.10. SLM SOLUTIONS GROUP AG
14.3.10.1. Market Presence, by Segment
14.3.10.2. Strategy
14.3.10.3. Revenue and Operating Profits
14.3.10.4. SWOT Analysis
15. Key Takeaways
List of Tables
Table 01: Global Hybrid Additive-Manufacturing Machines Market Size (US$ Mn) Forecast, by Application, 2016–2026
Table 02: Global Hybrid Additive-Manufacturing Machines Market Size (US$ Mn) Forecast, by Vertical, 2016–2026
Table 03: Global Hybrid Additive-Manufacturing Machines Market Size (US$ Mn) Forecast, by Region, 2016–2026
Table 04: Global Hybrid Additive-Manufacturing Machines Market Size (Thousand Units) Forecast, by Region, 2016–2026
Table 05: North America Hybrid Additive-Manufacturing Machines Market Size (US$ Mn) Forecast, by Application, 2016–2026
Table 06: North America Hybrid Additive-Manufacturing Machines Market Size (US$ Mn) Forecast, by Vertical, 2016–2026
Table 07: North America Hybrid Additive-Manufacturing Machines Market Size (US$ Mn) Forecast, by Country, 2016–2026
Table 08: U.S. Hybrid Additive-Manufacturing Machines Market Size (US$ Mn) Forecast, by Application, 2016–2026
Table 09: U.S. Hybrid Additive-Manufacturing Machines Market Size (US$ Mn) Forecast, by Vertical, 2016–2026
Table 10: Canada Hybrid Additive-Manufacturing Machines Market Size (US$ Mn) Forecast, by Application, 2016–2026
Table 11: Canada Hybrid Additive-Manufacturing Machines Market Size (US$ Mn) Forecast, by Vertical, 2016–2026
Table 12: Rest of North America Hybrid Additive-Manufacturing Machines Market Size (US$ Mn) Forecast, by Application, 2016–2026
Table 13: Rest of North America Hybrid Additive-Manufacturing Machines Market Size (US$ Mn) Forecast, by Vertical, 2016–2026
Table 14: Europe Hybrid Additive-Manufacturing Machines Market Size (US$ Mn) Forecast, by Application, 2016–2026
Table 15: Europe Hybrid Additive-Manufacturing Machines Market Size (US$ Mn) Forecast, by Vertical, 2016–2026
Table 16: Europe Hybrid Additive-Manufacturing Machines Market Size (US$ Mn) Forecast, by Country, 2016–2026
Table 17: U.K. Hybrid Additive-Manufacturing Machines Market Size (US$ Mn) Forecast, by Application, 2016–2026
Table 18: U.K. Hybrid Additive-Manufacturing Machines Market Size (US$ Mn) Forecast, by Vertical, 2016–2026
Table 19: Germany Hybrid Additive-Manufacturing Machines Market Size (US$ Mn) Forecast, by Application, 2016–2026
Table 20: Germany Hybrid Additive-Manufacturing Machines Market Size (US$ Mn) Forecast, by Vertical, 2016–2026
Table 21: France Hybrid Additive-Manufacturing Machines Market Size (US$ Mn) Forecast, by Application, 2016–2026
Table 22: France Hybrid Additive-Manufacturing Machines Market Size (US$ Mn) Forecast, by Vertical, 2016–2026
Table 23: Rest of Europe Hybrid Additive-Manufacturing Machines Market Size (US$ Mn) Forecast, by Application, 2016–2026
Table 24: Rest of Europe Hybrid Additive-Manufacturing Machines Market Size (US$ Mn) Forecast, by Vertical, 2016–2026
Table 25: Asia Pacific Hybrid Additive-Manufacturing Machines Market Size (US$ Mn) Forecast, by Application, 2016–2026
Table 26: Asia Pacific Hybrid Additive-Manufacturing Machines Market Size (US$ Mn) Forecast, by Vertical, 2016–2026
Table 27: Asia Pacific Hybrid Additive-Manufacturing Machines Market Size (US$ Mn) Forecast, by Country, 2016–2026
Table 28: India Hybrid Additive-Manufacturing Machines Market Size (US$ Mn) Forecast, by Application, 2018-2026
Table 29: India Hybrid Additive-Manufacturing Machines Market Size (US$ Mn) Forecast, by Vertical, 2016–2026
Table 30: Japan Hybrid Additive-Manufacturing Machines Market Size (US$ Mn) Forecast, by Application, 2016–2026
Table 31: Japan Hybrid Additive-Manufacturing Machines Market Size (US$ Mn) Forecast, by Vertical, 2016–2026
Table 32: China Hybrid Additive-Manufacturing Machines Market Size (US$ Mn) Forecast, by Application, 2016–2026
Table 33: China Hybrid Additive-Manufacturing Machines Market Size (US$ Mn) Forecast, by Vertical, 2016–2026
Table 34: Rest of Asia Pacific Hybrid Additive-Manufacturing Machines Market Size (US$ Mn) Forecast, by Application, 2016–2026
Table 35: Rest of Asia Pacific Hybrid Additive-Manufacturing Machines Market Size (US$ Mn) Forecast, by Vertical, 2016–2026
Table 36: Middle East & Africa Hybrid Additive-Manufacturing Machines Market Size (US$ Mn) Forecast, by Application, 2016–2026
Table 37: Middle East & Africa Hybrid Additive-Manufacturing Machines Market Size (US$ Mn) Forecast, by Vertical, 2016–2026
Table 38: Middle East & Africa Hybrid Additive-Manufacturing Machines Market Size (US$ Mn) Forecast, by Country, 2016–2026
Table 39: GCC Countries Hybrid Additive-Manufacturing Machines Market Size (US$ Mn) Forecast, by Application, 2016–2026
Table 40: GCC Countries Hybrid Additive-Manufacturing Machines Market Size (US$ Mn) Forecast, by Vertical, 2016–2026
Table 41: South Africa Hybrid Additive-Manufacturing Machines Market Size (US$ Mn) Forecast, by Application, 2016–2026
Table 42: South Africa Hybrid Additive-Manufacturing Machines Market Size (US$ Mn) Forecast, by Vertical, 2016–2026
Table 43: Rest of MEA Hybrid Additive-Manufacturing Machines Market Size (US$ Mn) Forecast, by Application, 2016–2026
Table 44: Rest of MEA Hybrid Additive-Manufacturing Machines Market Size (US$ Mn) Forecast, by Vertical, 2016–2026
Table 45: South America Hybrid Additive-Manufacturing Machines Market Size (US$ Mn) Forecast, by Application, 2016–2026
Table 46: South America Hybrid Additive-Manufacturing Machines Market Size (US$ Mn) Forecast, by Vertical, 2016–2026
Table 47: South America Hybrid Additive-Manufacturing Machines Market Size (US$ Mn) Forecast, by Country, 2016–2026
Table 48: Brazil Hybrid Additive-Manufacturing Machines Market Size (US$ Mn) Forecast, by Application, 2016–2026
Table 49: Brazil Hybrid Additive-Manufacturing Machines Market Size (US$ Mn) Forecast, by Vertical, 2016–2026
Table 50: Rest of South America Hybrid Additive-Manufacturing Machines Market Size (US$ Mn) Forecast, by Application, 2016–2026
Table 51: Rest of South America Hybrid Additive-Manufacturing Machines Market Size (US$ Mn) Forecast, by Vertical, 2016–2026
List of Figures
Figure 01: Market Revenue (US$ Mn) Growth Analysis by Application, 2018-2026
Figure 02: Market Revenue (US$ Mn) Growth Analysis by Vertical 2018-2026
Figure 03: Market Revenue (US$ Mn) Growth Analysis by Region 2018-2026
Figure 04: Global Hybrid Additive-Manufacturing Machines Market Size (US$ Mn) Forecast, 2016 - 2026
Figure 05: Global Hybrid Additive-Manufacturing Machines Market Y-o-Y Growth (Value %) Forecast, 2017–2026
Figure 06: Global Hybrid Additive-Manufacturing Machines Market Revenue Share Analysis, by Application, 2018 and 2026
Figure 07: Global Hybrid Additive-Manufacturing Machines Market Revenue (US$ Mn) Growth Analysis by Application, 2018–2026
Figure 08: Global Hybrid Additive-Manufacturing Machines Market Attractiveness Analysis by Application
Figure 09: Global Hybrid Additive-Manufacturing Machines Market Revenue Share Analysis, by Vertical, 2018 and 2026
Figure 10: Global Hybrid Additive-Manufacturing Machines Market Revenue (US$ Mn) Growth Analysis by Vertical, 2018–2026
Figure 11: Global Hybrid Additive-Manufacturing Machines Market Attractiveness Analysis by Vertical
Figure 12: Global Hybrid Additive-Manufacturing Machines Market Revenue (US$ Mn) Growth Analysis by Region, 2018–2026
Figure 13: Global Hybrid Additive-Manufacturing Machines Market Attractiveness Analysis by Region
Figure 14: North America Hybrid Additive-Manufacturing Machines Market Size (US$ Mn) Forecast, 2016–2026
Figure 15: North America Hybrid Additive-Manufacturing Machines Market Size Y-o-Y Growth Projections, 2017–2026
Figure 16: North America Hybrid Additive-Manufacturing Machines Market Revenue Share Analysis, by Application, 2018 and 2026
Figure 17: North America Hybrid Additive-Manufacturing Machines Market Revenue Share Analysis, by Vertical, 2018 and 2026
Figure 18: North America Hybrid Additive-Manufacturing Machines Market Revenue Share Analysis, by Country, 2018 and 2026
Figure 19: North America Hybrid Additive-Manufacturing Machines Market Revenue (US$ Mn) Growth Analysis by Application, 2018–2026
Figure 20: North America Hybrid Additive-Manufacturing Machines Market Revenue (US$ Mn) Analysis by Vertical, 2018–2026
Figure 21: North America Hybrid Additive-Manufacturing Machines Market Revenue (US$ Mn) Analysis by Country, 2018–2026
Figure 22: U.S. Hybrid Additive-Manufacturing Machines Market Revenue Share Analysis, by Application, 2018 and 2026
Figure 23: U.S. Hybrid Additive-Manufacturing Machines Market Revenue Share Analysis, by Vertical, 2018 and 2026
Figure 24: Canada Hybrid Additive-Manufacturing Machines Market Revenue Share Analysis, by Application, 2018 and 2026
Figure 25: Canada Hybrid Additive-Manufacturing Machines Market Revenue Share Analysis, by Vertical, 2018 and 2026
Figure 26: North America Hybrid Additive-Manufacturing Machines Market Attractiveness Analysis, by Application
Figure 27: North America Hybrid Additive-Manufacturing Machines Market Attractiveness Analysis, by Vertical
Figure 28: North America Hybrid Additive-Manufacturing Machines Market Attractiveness Analysis, by Country
Figure 29: Europe Hybrid Additive-Manufacturing Machines Market Size (US$ Mn) Forecast, 2016–2026
Figure 30: Europe Hybrid Additive-Manufacturing Machines Market Size Y-o-Y Growth Projections, 2017–2026
Figure 31: Europe Hybrid Additive-Manufacturing Machines Market Revenue Share Analysis, by Application, 2018 and 2026
Figure 32: Europe Hybrid Additive-Manufacturing Machines Market Revenue Share Analysis, by Vertical, 2018 and 2026
Figure 33: Europe Hybrid Additive-Manufacturing Machines Market Revenue Share Analysis, by Country, 2018 and 2026
Figure 34: Europe Hybrid Additive-Manufacturing Machines Market Revenue (US$ Mn) Growth Analysis by Application, 2018–2026
Figure 35: Europe Hybrid Additive-Manufacturing Machines Market Revenue (US$ Mn) Analysis by Vertical, 2018-2026
Figure 36: North America Hybrid Additive-Manufacturing Machines Market Revenue (US$ Mn) Analysis by Country, 2018-2026
Figure 37: The U.K. Hybrid Additive-Manufacturing Machines Market Revenue Share Analysis, by Application, 2018 and 2026
Figure 38: The U.K. Hybrid Additive-Manufacturing Machines Market Revenue Share Analysis, by Vertical, 2018 and 2026
Figure 39: Germany Hybrid Additive-Manufacturing Machines Market Revenue Share Analysis, by Application, 2018 and 2026
Figure 40: Germany Hybrid Additive-Manufacturing Machines Market Revenue Share Analysis, by Vertical, 2018 and 2026
Figure 41: France Hybrid Additive-Manufacturing Machines Market Revenue Share Analysis, by Application, 2018 and 2026
Figure 42: France Hybrid Additive-Manufacturing Machines Market Revenue Share Analysis, by Vertical, 2018 and 2026
Figure 43: Europe Hybrid Additive-Manufacturing Machines Market Attractiveness Analysis, by Application
Figure 44: Europe Hybrid Additive-Manufacturing Machines Market Attractiveness Analysis, by Vertical
Figure 45: Europe Hybrid Additive-Manufacturing Machines Market Attractiveness Analysis, by Country
Figure 46: Asia Pacific Hybrid Additive-Manufacturing Machines Market Size (US$ Mn) Forecast, 2016–2026
Figure 47: Asia Pacific Hybrid Additive-Manufacturing Machines Market Size Y-o-Y Growth Projections, 2017–2026
Figure 48: Asia Pacific Hybrid Additive-Manufacturing Machines Market Revenue Share Analysis, by Application, 2018 and 2026
Figure 49: Asia Pacific Hybrid Additive-Manufacturing Machines Market Revenue Share Analysis, by Vertical, 2018 and 2026
Figure 50: Asia Pacific Hybrid Additive-Manufacturing Machines Market Revenue Share Analysis, by Country, 2018 and 2026
Figure 51: Asia Pacific Hybrid Additive-Manufacturing Machines Market Revenue (US$ Mn) Growth Analysis by Application, 2018–2026
Figure 52: : Asia Pacific Hybrid Additive-Manufacturing Machines Market Revenue (US$ Mn) Analysis by Vertical, 2018–2026
Figure 53: Asia Pacific Hybrid Additive-Manufacturing Machines Market Revenue (US$ Mn) Analysis by Country, 2018–2026
Figure 54: India Hybrid Additive-Manufacturing Machines Market Revenue Share Analysis, by Application, 2018 and 2026
Figure 55: India Hybrid Additive-Manufacturing Machines Market Revenue Share Analysis, by Vertical, 2018 and 2026
Figure 56: Japan Hybrid Additive-Manufacturing Machines Market Revenue Share Analysis, by Application, 2018 and 2026
Figure 57: Japan Hybrid Additive-Manufacturing Machines Market Revenue Share Analysis, by Vertical, 2018 and 2026
Figure 58: China Hybrid Additive-Manufacturing Machines Market Revenue Share Analysis, by Application, 2018 and 2026
Figure 59: China Hybrid Additive-Manufacturing Machines Market Revenue Share Analysis, by Vertical, 2018 and 2026
Figure 60: Asia Pacific Hybrid Additive-Manufacturing Machines Market Attractiveness Analysis, by Application
Figure 61: Asia Pacific Hybrid Additive-Manufacturing Machines Market Attractiveness Analysis, by Vertical
Figure 62: Europe Hybrid Additive-Manufacturing Machines Market Attractiveness Analysis, by Country
Figure 63: Middle East & Africa Hybrid Additive-Manufacturing Machines Market Size (US$ Mn) Forecast, 2016–2026
Figure 64: Middle East & Africa Hybrid Additive-Manufacturing Machines Market Size Y-o-Y Growth Projections, 2017–2026
Figure 65: Middle East & Africa Hybrid Additive-Manufacturing Machines Market Revenue Share Analysis, by Application, 2018 and 2026
Figure 66: Middle East & Africa Hybrid Additive-Manufacturing Machines Market Revenue Share Analysis, by Vertical, 2018 and 2026
Figure 67: Middle East & Africa Hybrid Additive-Manufacturing Machines Market Revenue Share Analysis, by Country, 2018 and 2026
Figure 68: Middle East & Africa Hybrid Additive-Manufacturing Machines Market Revenue (US$ Mn) Growth Analysis by Application, 2018–2026
Figure 69: Middle East & Africa Hybrid Additive-Manufacturing Machines Market Revenue (US$ Mn) Analysis by Vertical, 2018–2026
Figure 70: Middle East & Africa Hybrid Additive-Manufacturing Machines Market Revenue (US$ Mn) Analysis by Country, 2018–2026
Figure 71: GCC Countries Hybrid Additive-Manufacturing Machines Market Revenue Share Analysis, by Application, 2018 and 2026
Figure 72: GCC Countries Hybrid Additive-Manufacturing Machines Market Revenue Share Analysis, by Vertical, 2018 and 2026
Figure 73: South Africa Hybrid Additive-Manufacturing Machines Market Revenue Share Analysis, by Application, 2018 and 2026
Figure 74: South Africa Hybrid Additive-Manufacturing Machines Market Revenue Share Analysis, by Vertical, 2018 and 2026
Figure 75: Middle East & Africa Hybrid Additive-Manufacturing Machines Market Attractiveness Analysis, by Application
Figure 76: Middle East & Africa Hybrid Additive-Manufacturing Machines Market Attractiveness Analysis, by Vertical
Figure 77: Middle East & Africa Hybrid Additive-Manufacturing Machines Market Attractiveness Analysis, by Country
Figure 78: South America Hybrid Additive-Manufacturing Machines Market Size (US$ Mn) Forecast, 2016–2026
Figure 79: South America Hybrid Additive-Manufacturing Machines Market Size Y-o-Y Growth Projections, 2017–2026
Figure 80: South America Hybrid Additive-Manufacturing Machines Market Revenue Share Analysis, by Application, 2018 and 2026
Figure 81: South America Hybrid Additive-Manufacturing Machines Market Revenue Share Analysis, by Vertical, 2018 and 2026
Figure 82: South America Hybrid Additive-Manufacturing Machines Market Revenue Share Analysis, by Country, 2018 and 2026
Figure 83: South America Hybrid Additive-Manufacturing Machines Market Revenue (US$ Mn) Growth Analysis by Application, 2018–2026
Figure 84: : South America Hybrid Additive-Manufacturing Machines Market Revenue (US$ Mn) Analysis by Vertical, 2018–2026
Figure 85: South America Hybrid Additive-Manufacturing Machines Market Revenue (US$ Mn) Analysis by Country, 2018–2026
Figure 86: Brazil Hybrid Additive-Manufacturing Machines Market Revenue Share Analysis, by Application, 2018 and 2026
Figure 87: Brazil Hybrid Additive-Manufacturing Machines Market Revenue Share Analysis, by Vertical, 2018 and 2026
Figure 88: South America Hybrid Additive-Manufacturing Machines Market Attractiveness Analysis, by Application
Figure 89: South America Hybrid Additive-Manufacturing Machines Market Attractiveness Analysis, by Vertical
Figure 90: South America Hybrid Additive-Manufacturing Machines Market Attractiveness Analysis, by Country
Figure 91: Global Hybrid Additive-Manufacturing Machines Market Revenue Share Analysis, by Company (2017)
Copyright © Transparency Market Research, Inc. All Rights reserved
Trust Online

Hybrid Additive Manufacturing Machines Market