
Reports
Reports
Analysts’ Viewpoint on Hazardous waste management Market Scenario
Hazardous waste that is improperly managed poses a serious threat to human health and the environment. Several government organizations have laid down rules and regulations for the proper management of hazardous waste. Rise in the amount of hazardous waste every year due to rapid urbanization and industrialization is prompting companies operating in the hazardous waste management market to develop unique techniques to battle this pressing challenge. New techniques such as steam autoclave treatment, chemical treatment, ozone treatment, pyrolysis, and electron beam technology are being utilized to achieve effective disposal of medical, chemical, and nuclear waste. Increase in efforts by numerous governments to manage hazardous waste and rise in focus on sustainable development due to increasing environmental challenges across the globe are notable factors fueling the global hazardous waste management market growth.
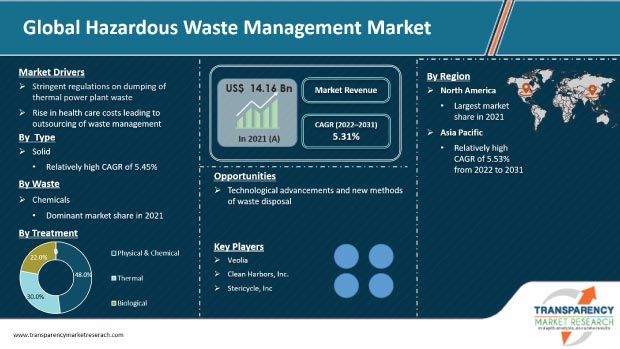
Hazardous waste possesses properties that make it dangerous or capable of having a harmful effect on human health or the environment. Management of hazardous waste includes the collection, recycling, treatment, transportation, disposal, and monitoring of waste disposal sites. Hazardous wastes can be in the solid, liquid, or sludge form, or contain gases, and they are generated primarily by chemical production, manufacturing, and other industrial activities. Increase in efforts by several governments in hazardous and non-hazardous waste disposal, stringent regulations on dumping of thermal power plant waste, and technological advancements in waste management methods are some of the significant growth factors of hazardous waste management market. Adoption of sustainable practices in managing harmful waste from industries and development of innovative techniques for waste management are upcoming trends in hazardous waste management market.
Coal combustion products (CCP) contain environmentally hazardous contaminants such as arsenic, cadmium, and mercury. These substances can pose a serious threat to the environment if not monitored properly. Therefore, it is vital to regulate the disposal of CCPs, such as fly ash, through coal-fired power stations. Regulatory authorities across the globe, such as the U.S. EPA and the European Union’s waste legislation, regulate the disposal of industrial waste. In October 2016, the U.S. EPA issued a set of rules for the safe disposal of coal combustion products in the U.S. These factors are expected to increase the hazardous waste management market size during the forecast period.
Healthcare costs in the U.S., and Europe are increasing at a rapid pace. The healthcare industry in several regions is under pressure to reduce costs and simultaneously, improve patient outcomes. Moreover, focus on waste generation and management in health care facilities is increasing due to the strict regulatory policies about waste management and disposal imposed by agencies, such as EPA, CDC, and U.S. FDA. This has prompted hospitals and other medical waste generators outsource those services that are not directly related to the delivery of health care and thereby, reduce costs. This has led to the emergence of third-party experts in the medical waste management market in the country. This, in turn, is expected to drive the hazardous waste management market share.
Several government organizations, such as the Food and Drug Administration (FDA), Environment Protection Agency (EPA), and Drug Enforcement Administration (DEA), are consistently working toward proper management of hazardous wastes to ensure safety. Medical, chemical, radioactive waste management has become increasingly necessary in developed countries. Several non-government organizations (NGOs) and community-based organizations (CBOs) are stepping in to help hospitals and other health care facilities to collect, recycle, and dispose of medical waste. Consequently, such initiatives by governments and NGOs to manage hazardous waste are fueling the market.
In terms of type, the global hazardous waste management market has been segregated into solid, liquid, and sludge. The solid segment held a major share of the global market in 2021. It is estimated to dominate the market during the forecast period. Increase in medical and industrial waste across the globe fuels the demand for solid and hazardous waste management services. The liquid segment accounted for 34.9% share of the market in 2021. The sludge segment held a relatively minor share of the market in 2021.
Based on waste, the global hazardous waste management market has been classified into nuclear, chemicals, biomedical, flammable, explosive, and others. The chemicals segment dominated the global hazardous waste management market and accounted for a 27.8% share in 2021. Rise in demand and production of chemicals along with rapid growth of the chemical industry in emerging regions is expected to increase the demand for chemical waste management in the next few years across the globe.
In terms of chemical composition, the global hazardous waste management market has been classified into organic and inorganic. The inorganic segment accounted for 87.6% share of the market in 2021. It is projected to dominate the market during the forecast period. Currently, more than 400 nuclear power plants are operational across the globe, and 15 countries are building around 50 new nuclear power plants that would be soon be operational. Hence, inorganic waste generation is expected to be more than the organic waste generation.
In terms of disposal method, the global hazardous waste management market has been classified into deep-well injection, detonation, engineered storage, land burial, and ocean dumping. The deep-well injection segment accounted for 34.8% share of the market in 2021. This is because it is one of the least expensive methods for disposing large volumes of hazardous wastes. Therefore, the popularity of this method is increasing continuously. The land burial segment accounted for 30.6% share of the market in 2021. The engineered storage segment accounted for 18.09% share of the market in 2021.
North America accounted for a prominent share of 34.8% of the global market in 2021 due to significant growth of pharmaceutical, chemical, and oil & gas industries in the region. Asia Pacific is also a key market for hazardous waste treatment, and the region held the second-largest share of the global market in 2021. Europe is a larger market for hazardous materials management, as compared to the market in Latin America and Middle East & Africa. The hazardous waste management market in Europe is estimated to rise during the forecast period due to technological advancements in terms of waste disposal methods. Furthermore, the adoption of recycling techniques of waste has enabled players to boost their revenues. This opportunity is being largely exploited in the market in Europe, which makes it highly attractive for companies operating in the medical waste management market.
The global hazardous waste management market is consolidated with a small number of large-scale vendors that control a majority of the market share. Several organizations are spending a significant amount on comprehensive research and development. Key players operating in the hazardous waste management market are Veolia, Clean Harbors, Inc., Stericycle, Inc., American Waste Management Services, Inc., Suez., Waste Management, Inc., Chloros Environmental Ltd., Republic Services, Inc, SMS ENVOCARE LTD, Morgan Group, Recology Inc., Waste Connections Inc., Environ India, and Bechtel Corporation.
In May 2022, Veolia and Suez announced the signing of an agreement for the acquisition by Suez of all of the hazardous waste assets in France as part of the commitments made by Veolia to address the European Commission competition concerns. The assets represent an enterprise value of EUR 690 Mn.
In June 2019, Bechtel Corporation bagged the contract for self-disposal of the U.S. stockpile of chemical weapons. As part of the contract, more than 15,000 mustard munitions would be disposed of in the Blue Grass Chemical Agent-Destruction Pilot Plant near Richmond, Kentucky, U.S. Destruction of the nerve agent is separately scheduled to begin later in 2019.
Each of these players has been profiled in the hazardous waste management market report based on parameters such as company overview, financial overview, business strategies, product portfolio, business segments, and recent developments.
|
Attribute |
Detail |
|
Market Size Value in 2021 |
US$ 14.16 Bn |
|
Market Forecast Value in 2031 |
US$ 23.76 Bn |
|
Growth Rate (CAGR) |
5.31% |
|
Forecast Period |
2022–2031 |
|
Historical Data Available for |
2020 |
|
Quantitative Units |
US$ Bn for Value & Thousand Ton for Volume |
|
Market Analysis |
It includes cross segment analysis at global as well as regional level. Furthermore, qualitative analysis includes drivers, restraints, opportunities, key trends, Porter’s Five Forces analysis, value chain analysis, and key trend analysis. |
|
Competition Landscape |
|
|
Format |
Electronic (PDF) + Excel |
|
Market Segmentation |
|
|
Regions Covered |
|
|
Countries Covered |
|
|
Companies Profiled |
|
|
Customization Scope |
Available upon request |
|
Pricing |
Available upon request |
The hazardous waste management market stood at US$ 14.16 Bn in 2021
The hazardous waste management market is expected to grow at a CAGR of 5.31% from 2022 to 2031
Stringent regulations on dumping of thermal power plant waste and rising health care costs leading to outsourcing of waste management
The inorganic segment accounted for 87.6% share of the hazardous waste management market in 2021.
North America is more attractive for vendors in the hazardous waste management market
Veolia, Clean Harbors, Inc., Stericycle, Inc., American Waste Management Services, Inc., Suez., Waste Management, Inc., Chloros Environmental Ltd., Republic Services, Inc, SMS ENVOCARE LTD, Morgan Group, Recology Inc., Waste Connections Inc., Environ India, and Bechtel Corporation.
1. Executive Summary
1.1. Hazardous Waste Management Market Snapshot
1.2. Current Market and Future Potential
2. Market Overview
2.1. Market Segmentation
2.2. Market Trends
2.3. Market Dynamics
2.3.1. Drivers
2.3.2. Restraints
2.3.3. Opportunities
2.4. Porter’s Five Forces Analysis
2.5. Regulatory Analysis
2.6. Value Chain Analysis
2.6.1. List of Key Manufacturers
2.6.2. List of Suppliers/ Distributors
2.6.3. List of Potential Customers
3. COVID-19 Impact Analysis
4. Price Trend Analysis
5. Global Hazardous Waste Management Market Analysis and Forecast, by Type, 2020–2031
5.1. Introduction and Definitions
5.2. Global Hazardous Waste Management Market Volume (Thousand Ton) and Value (US$ Bn) Forecast, by Type, 2020–2031
5.2.1. Solid
5.2.2. Liquid
5.2.3. Sludge
5.3. Global Hazardous Waste Management Market Attractiveness, by Type
6. Global Hazardous Waste Management Market Analysis and Forecast, by Waste, 2020–2031
6.1. Introduction and Definitions
6.2. Global Hazardous Waste Management Market Volume (Thousand Ton) and Value (US$ Bn) Forecast, by Waste, 2020–2031
6.2.1. Nuclear
6.2.2. Chemicals
6.2.3. Explosive
6.2.4. Biomedical
6.2.4.1. Infectious
6.2.4.2. Radioactive
6.2.5. Flammable
6.2.6. Others
6.3. Global Hazardous Waste Management Market Attractiveness, by Waste
7. Global Hazardous Waste Management Market Analysis and Forecast, by Chemical Composition, 2020–2031
7.1. Introduction and Definitions
7.2. Global Hazardous Waste Management Market Volume (Thousand Ton) and Value (US$ Bn) Forecast, by Chemical Composition, 2020–2031
7.2.1. Organic
7.2.2. Inorganic
7.3. Global Hazardous Waste Management Market Attractiveness, by Chemical Composition
8. Global Hazardous Waste Management Market Analysis and Forecast, by Treatment, 2020–2031
8.1. Introduction and Definition
8.2. Global Hazardous Waste Management Market Volume (Thousand Ton) and Value (US$ Bn) Forecast, by Treatment, 2020–20311.
8.2.1. Physical & Chemical
8.2.2. Thermal
8.2.3. Biological
8.3. Global Hazardous Waste Management Market Attractiveness, by Treatment
9. Global Hazardous Waste Management Market Analysis and Forecast, by Disposal Method, 2020–2031
9.1. Introduction and Definition
9.2. Global Hazardous Waste Management Market Volume (Thousand Ton) and Value (US$ Bn) Forecast, by Disposal Method, 2020–20311.
9.2.1. Deep-well Injection
9.2.2. Detonation
9.2.3. Engineered Storage
9.2.4. Deep-well Injection
9.2.5. Detonation
9.2.6. Engineered Storage
9.3. Global Hazardous Waste Management Market Attractiveness, by Disposal Method
10. Global Hazardous Waste Management Market Analysis and Forecast, by Region, 2020–2031
10.1. Key Findings
10.2. Global Hazardous Waste Management Market Volume (Thousand Ton) and Value (US$ Bn) Forecast, by Region, 2020–2031
10.2.1. North America
10.2.2. Europe
10.2.3. Asia Pacific
10.2.4. Middle East & Africa
10.2.5. Latin America
10.3. Global Hazardous Waste Management Market Attractiveness, by Region
11. North America Hazardous Waste Management Market Analysis and Forecast, 2020–2031
11.1. Key Findings
11.2. North America Hazardous Waste Management Market Volume (Thousand Ton) and Value (US$ Bn) Forecast, by Type, 2020–2031
11.3. North America Hazardous Waste Management Market Volume (Thousand Ton) and Value (US$ Bn) Forecast, by Waste, 2020–2031
11.4. North America Hazardous Waste Management Market Volume (Thousand Ton) and Value (US$ Bn) Forecast, by Chemical Composition, 2020–2031
11.5. North America Hazardous Waste Management Market Volume (Thousand Ton) and Value (US$ Bn) Forecast, by Treatment, 2020–2031
11.6. North America Hazardous Waste Management Market Volume (Thousand Ton) and Value (US$ Bn) Forecast, by Disposal Method, 2020–2031
11.7. North America Hazardous Waste Management Market Volume (Thousand Ton) and Value (US$ Bn) Forecast, by Country, 2020–2031
11.7.1. U.S. Hazardous Waste Management Market Volume (Thousand Ton) and Value (US$ Bn) Forecast, by Type, 2020–2031
11.7.2. U.S. Hazardous Waste Management Market Volume (Thousand Ton) and Value (US$ Bn) Forecast, by Waste, 2020–2031
11.7.3. U.S. Hazardous Waste Management Market Volume (Thousand Ton) and Value (US$ Bn) Forecast, by Chemical Composition, 2020–2031
11.7.4. U.S. Hazardous Waste Management Market Volume (Thousand Ton) and Value (US$ Bn) Forecast, by Treatment, 2020–2031
11.7.5. U.S. Hazardous Waste Management Market Volume (Thousand Ton) and Value (US$ Bn) Forecast, by Disposal Method, 2020–2031
11.7.6. Canada Hazardous Waste Management Market Volume (Thousand Ton) and Value (US$ Bn) Forecast, by Type, 2020–2031
11.7.7. Canada Hazardous Waste Management Market Volume (Thousand Ton) and Value (US$ Bn) Forecast, by Waste, 2020–2031
11.7.8. Canada Hazardous Waste Management Market Volume (Thousand Ton) and Value (US$ Bn) Forecast, by Chemical Composition, 2020–2031
11.7.9. Canada Hazardous Waste Management Market Volume (Thousand Ton) and Value (US$ Bn) Forecast, by Treatment, 2020–2031
11.7.10. Canada Hazardous Waste Management Market Volume (Thousand Ton) and Value (US$ Bn) Forecast, by Disposal Method, 2020–2031
11.8. North America Hazardous Waste Management Market Attractiveness Analysis
12. Europe Hazardous Waste Management Market Analysis and Forecast, 2020–2031
12.1. Key Finding
12.2. Europe Hazardous Waste Management Market Volume (Thousand Ton) and Value (US$ Bn) Forecast, by Type, 2020–2031
12.3. Europe Hazardous Waste Management Market Volume (Thousand Ton) and Value (US$ Bn) Forecast, by Waste, 2020–2031
12.4. Europe Hazardous Waste Management Market Volume (Thousand Ton) and Value (US$ Bn) Forecast, by Chemical Composition, 2020–2031
12.5. Europe Hazardous Waste Management Market Volume (Thousand Ton) and Value (US$ Bn) Forecast, by Treatment, 2020–2031
12.6. Europe Hazardous Waste Management Market Volume (Thousand Ton) and Value (US$ Bn) Forecast, by Disposal Method, 2020–2031
12.7. Europe Hazardous Waste Management Market Volume (Thousand Ton) and Value (US$ Bn) Forecast, by Country and Sub-region, 2020–2031
12.7.1. Germany Hazardous Waste Management Market Volume (Thousand Ton) and Value (US$ Bn) Forecast, by Type, 2020–2031
12.7.2. Germany Hazardous Waste Management Market Volume (Thousand Ton) and Value (US$ Bn) Forecast, by Waste, 2020–2031
12.7.3. Germany Hazardous Waste Management Market Volume (Thousand Ton) and Value (US$ Bn) Forecast, by Chemical Composition, 2020–2031
12.7.4. Germany Hazardous Waste Management Market Volume (Thousand Ton) and Value (US$ Bn) Forecast, by Treatment, 2020–2031
12.7.5. Germany Hazardous Waste Management Market Volume (Thousand Ton) and Value (US$ Bn) Forecast, by Disposal Method, 2020–2031
12.7.6. France Hazardous Waste Management Market Volume (Thousand Ton) and Value (US$ Bn) Forecast, by Type, 2020–2031
12.7.7. France Hazardous Waste Management Market Volume (Thousand Ton) and Value (US$ Bn) Forecast, by Waste, 2020–2031
12.7.8. France Hazardous Waste Management Market Volume (Thousand Ton) and Value (US$ Bn) Forecast, by Chemical Composition, 2020–2031
12.7.9. France Hazardous Waste Management Market Volume (Thousand Ton) and Value (US$ Bn) Forecast, by Treatment, 2020–2031
12.7.10. France Hazardous Waste Management Market Volume (Thousand Ton) and Value (US$ Bn) Forecast, by Disposal Method, 2020–2031
12.7.11. U.K. Hazardous Waste Management Market Volume (Thousand Ton) and Value (US$ Bn) Forecast, by Type, 2020–2031
12.7.12. U.K. Hazardous Waste Management Market Volume (Thousand Ton) and Value (US$ Bn) Forecast, by Waste, 2020–2031
12.7.13. U.K. Hazardous Waste Management Market Volume (Thousand Ton) and Value (US$ Bn) Forecast, by Chemical Composition, 2020–2031
12.7.14. U.K. Hazardous Waste Management Market Volume (Thousand Ton) and Value (US$ Bn) Forecast, by Treatment, 2020–2031
12.7.15. U.K. Hazardous Waste Management Market Volume (Thousand Ton) and Value (US$ Bn) Forecast, by Disposal Method, 2020–2031
12.7.16. Spain Hazardous Waste Management Market Volume (Thousand Ton) and Value (US$ Bn) Forecast, by Type, 2020–2031
12.7.17. Spain Hazardous Waste Management Market Volume (Thousand Ton) and Value (US$ Bn) Forecast, by Waste, 2020–2031
12.7.18. Spain Hazardous Waste Management Market Volume (Thousand Ton) and Value (US$ Bn) Forecast, by Chemical Composition, 2020–2031
12.7.19. Spain Hazardous Waste Management Market Volume (Thousand Ton) and Value (US$ Bn) Forecast, by Treatment, 2020–2031
12.7.20. Spain Hazardous Waste Management Market Volume (Thousand Ton) and Value (US$ Bn) Forecast, by Disposal Method, 2020–2031
12.7.21. Italy Hazardous Waste Management Market Volume (Thousand Ton) and Value (US$ Bn) Forecast, by Type, 2020–2031
12.7.22. Italy. Hazardous Waste Management Market Volume (Thousand Ton) and Value (US$ Bn) Forecast, by Waste, 2020–2031
12.7.23. Italy Hazardous Waste Management Market Volume (Thousand Ton) and Value (US$ Bn) Forecast, by Chemical Composition, 2020–2031
12.7.24. Italy Hazardous Waste Management Market Volume (Thousand Ton) and Value (US$ Bn) Forecast, by Treatment, 2020–2031
12.7.25. Italy Hazardous Waste Management Market Volume (Thousand Ton) and Value (US$ Bn) Forecast, by Disposal Method, 2020–2031
12.7.26. Russia & CIS Hazardous Waste Management Market Volume (Thousand Ton) and Value (US$ Bn) Forecast, by Type, 2020–2031
12.7.27. Russia & CIS Hazardous Waste Management Market Volume (Thousand Ton) and Value (US$ Bn) Forecast, by Waste, 2020–2031
12.7.28. Russia & CIS Hazardous Waste Management Market Volume (Thousand Ton) and Value (US$ Bn) Forecast, by Chemical Composition 2020–2031
12.7.29. Russia & CIS Hazardous Waste Management Market Volume (Thousand Ton) and Value (US$ Bn) Forecast, by Treatment, 2020–2031
12.7.30. Russia & CIS Hazardous Waste Management Market Volume (Thousand Ton) and Value (US$ Bn) Forecast, by Disposal Method, 2020–2031
12.7.31. Rest of Europe Hazardous Waste Management Market Volume (Thousand Ton) and Value (US$ Bn) Forecast, by Type, 2020–2031
12.7.32. Rest of Europe Hazardous Waste Management Market Volume (Thousand Ton) and Value (US$ Bn) Forecast, by Waste, 2020–2031
12.7.33. Rest of Europe Hazardous Waste Management Market Volume (Thousand Ton) and Value (US$ Bn) Forecast, by Chemical Composition, 2020–2031
12.7.34. Rest of Europe Hazardous Waste Management Market Volume (Thousand Ton) and Value (US$ Bn) Forecast, by Treatment, 2020–2031
12.7.35. Rest of Europe Hazardous Waste Management Market Volume (Thousand Ton) and Value (US$ Bn) Forecast, by Disposal Method, 2020–2031
12.8. Europe Hazardous Waste Management Market Attractiveness Analysis
13. Asia Pacific Hazardous Waste Management Market Analysis and Forecast, 2020–2031
13.1. Key Findings
13.2. Asia Pacific Hazardous Waste Management Market Volume (Thousand Ton) and Value (US$ Bn) Forecast, by Type
13.3. Asia Pacific Hazardous Waste Management Market Volume (Thousand Ton) and Value (US$ Bn) Forecast, by Waste, 2020–2031
13.4. Asia Pacific Hazardous Waste Management Market Volume (Thousand Ton) and Value (US$ Bn) Forecast, by Chemical Composition, 2020–2031
13.5. Asia Pacific Hazardous Waste Management Market Volume (Thousand Ton) and Value (US$ Bn) Forecast, by Treatment, 2020–2031
13.6. Asia Pacific Hazardous Waste Management Market Volume (Thousand Ton) and Value (US$ Bn) Forecast, by Disposal Method, 2020–2031
13.7. Asia Pacific Hazardous Waste Management Market Volume (Thousand Ton) and Value (US$ Bn) Forecast, by Country and Sub-region, 2020–2031
13.7.1. China Hazardous Waste Management Market Volume (Thousand Ton) and Value (US$ Bn) Forecast, by Type, 2020–2031
13.7.2. China Hazardous Waste Management Market Volume (Thousand Ton) and Value (US$ Bn) Forecast, by Waste, 2020–2031
13.7.3. China Hazardous Waste Management Market Volume (Thousand Ton) and Value (US$ Bn) Forecast, by Chemical Composition, 2020–2031
13.7.4. China Hazardous Waste Management Market Volume (Thousand Ton) and Value (US$ Bn) Forecast, by Treatment, 2020–2031
13.7.5. China Hazardous Waste Management Market Volume (Thousand Ton) and Value (US$ Bn) Forecast, by Disposal Method, 2020–2031
13.7.6. Japan Hazardous Waste Management Market Volume (Thousand Ton) and Value (US$ Bn) Forecast, by Type, 2020–2031
13.7.7. Japan Hazardous Waste Management Market Volume (Thousand Ton) and Value (US$ Bn) Forecast, by Waste, 2020–2031
13.7.8. Japan Hazardous Waste Management Market Volume (Thousand Ton) and Value (US$ Bn) Forecast, by Chemical Composition, 2020–2031
13.7.9. Japan Hazardous Waste Management Market Volume (Thousand Ton) and Value (US$ Bn) Forecast, by Treatment, 2020–2031
13.7.10. Japan Hazardous Waste Management Market Volume (Thousand Ton) and Value (US$ Bn) Forecast, by Disposal Method, 2020–2031
13.7.11. India Hazardous Waste Management Market Volume (Thousand Ton) and Value (US$ Bn) Forecast, by Type, 2020–2031
13.7.12. India Hazardous Waste Management Market Volume (Thousand Ton) and Value (US$ Bn) Forecast, by Waste, 2020–2031
13.7.13. India Hazardous Waste Management Market Volume (Thousand Ton) and Value (US$ Bn) Forecast, by Chemical Composition, 2020–2031
13.7.14. India Hazardous Waste Management Market Volume (Thousand Ton) and Value (US$ Bn) Forecast, by Treatment, 2020–2031
13.7.15. India Hazardous Waste Management Market Volume (Thousand Ton) and Value (US$ Bn) Forecast, by Disposal Method, 2020–2031
13.7.16. ASEAN Hazardous Waste Management Market Volume (Thousand Ton) and Value (US$ Bn) Forecast, by Type, 2020–2031
13.7.17. ASEAN Hazardous Waste Management Market Volume (Thousand Ton) and Value (US$ Bn) Forecast, by Waste, 2020–2031
13.7.18. ASEAN Hazardous Waste Management Market Volume (Thousand Ton) and Value (US$ Bn) Forecast, by Chemical Composition, 2020–2031
13.7.19. ASEAN Hazardous Waste Management Market Volume (Thousand Ton) and Value (US$ Bn) Forecast, by Treatment, 2020–2031
13.7.20. ASEAN Hazardous Waste Management Market Volume (Thousand Ton) and Value (US$ Bn) Forecast, by Disposal Method, 2020–2031
13.7.21. Rest of Asia Pacific Hazardous Waste Management Market Volume (Thousand Ton) and Value (US$ Bn) Forecast, by Type, 2020–2031
13.7.22. Rest of Asia Pacific Hazardous Waste Management Market Volume (Thousand Ton) and Value (US$ Bn) Forecast, by Waste, 2020–2031
13.7.23. Rest of Asia Pacific Hazardous Waste Management Market Volume (Thousand Ton) and Value (US$ Bn) Forecast, by Chemical Composition, 2020–2031
13.7.24. Rest of Asia Pacific Hazardous Waste Management Market Volume (Thousand Ton) and Value (US$ Bn) Forecast, by Treatment, 2020–2031
13.7.25. Rest of Asia Pacific Hazardous Waste Management Market Volume (Thousand Ton) and Value (US$ Bn) Forecast, by Disposal Method, 2020–2031
13.8. Asia Pacific Hazardous Waste Management Market Attractiveness Analysis
14. Latin America Hazardous Waste Management Market Analysis and Forecast, 2020–2031
14.1. Key Findings
14.2. Latin America Hazardous Waste Management Market Volume (Thousand Ton) and Value (US$ Bn) Forecast, by Type, 2020–2031
14.3. Latin America Hazardous Waste Management Market Volume (Thousand Ton) and Value (US$ Bn) Forecast, by Waste, 2020–2031
14.4. Latin America Hazardous Waste Management Market Volume (Thousand Ton) and Value (US$ Bn) Forecast, by Chemical Composition 2020–2031
14.5. Latin America Hazardous Waste Management Market Volume (Thousand Ton) and Value (US$ Bn) Forecast, by Treatment, 2020–2031
14.6. Latin America Hazardous Waste Management Market Volume (Thousand Ton) and Value (US$ Bn) Forecast, by Disposal Method, 2020–2031
14.7. Latin America Hazardous Waste Management Market Volume (Thousand Ton) and Value (US$ Bn) Forecast, by Country and Sub-region, 2020–2031
14.7.1. Brazil Hazardous Waste Management Market Volume (Thousand Ton) and Value (US$ Bn) Forecast, by Type, 2020–2031
14.7.2. Brazil Hazardous Waste Management Market Volume (Thousand Ton) and Value (US$ Bn) Forecast, by Waste, 2020–2031
14.7.3. Brazil Hazardous Waste Management Market Volume (Thousand Ton) and Value (US$ Bn) Forecast, by Chemical Composition, 2020–2031
14.7.4. Brazil Hazardous Waste Management Market Volume (Thousand Ton) and Value (US$ Bn) Forecast, by Treatment, 2020–2031
14.7.5. Brazil Hazardous Waste Management Market Volume (Thousand Ton) and Value (US$ Bn) Forecast, by Disposal Method, 2020–2031
14.7.6. Mexico Hazardous Waste Management Market Volume (Thousand Ton) and Value (US$ Bn) Forecast, by Type, 2020–2031
14.7.7. Mexico Hazardous Waste Management Market Volume (Thousand Ton) and Value (US$ Bn) Forecast, by Waste, 2020–2031
14.7.8. Mexico Hazardous Waste Management Market Volume (Thousand Ton) and Value (US$ Bn) Forecast, by Chemical Composition, 2020–2031
14.7.9. Mexico Hazardous Waste Management Market Volume (Thousand Ton) and Value (US$ Bn) Forecast, by Treatment, 2020–2031
14.7.10. Mexico Hazardous Waste Management Market Volume (Thousand Ton) and Value (US$ Bn) Forecast, by Disposal Method, 2020–2031
14.7.11. Rest of Latin America Hazardous Waste Management Market Volume (Thousand Ton) and Value (US$ Bn) Forecast, by Type, 2020–2031
14.7.12. Rest of Latin America Hazardous Waste Management Market Volume (Thousand Ton) and Value (US$ Bn) Forecast, by Waste, 2020–2031
14.7.13. Rest of Latin America Hazardous Waste Management Market Volume (Thousand Ton) and Value (US$ Bn) Forecast, by Chemical Composition, 2020–2031
14.7.14. Rest of Latin America Hazardous Waste Management Market Volume (Thousand Ton) and Value (US$ Bn) Forecast, by Treatment, 2020–2031
14.7.15. Rest of Latin America Hazardous Waste Management Market Volume (Thousand Ton) and Value (US$ Bn) Forecast, by Disposal Method, 2020–2031
14.8. Latin America Hazardous Waste Management Market Attractiveness Analysis
15. Middle East & Africa Hazardous Waste Management Market Analysis and Forecast, 2020–2031
15.1. Key Findings
15.2. Middle East & Africa Hazardous Waste Management Market Volume (Thousand Ton) and Value (US$ Bn) Forecast, by Type, 2020–2031
15.3. Middle East & Africa Hazardous Waste Management Market Volume (Thousand Ton) and Value (US$ Bn) Forecast, by Waste, 2020–2031
15.4. Middle East & Africa Hazardous Waste Management Market Volume (Thousand Ton) and Value (US$ Bn) Forecast, by Chemical Composition, 2020–2031
15.5. Middle East & Africa Hazardous Waste Management Market Volume (Thousand Ton) and Value (US$ Bn) Forecast, by Treatment, 2020–2031
15.6. Middle East & Africa Hazardous Waste Management Market Volume (Thousand Ton) and Value (US$ Bn) Forecast, by Disposal Method, 2020–2031
15.7. Middle East & Africa Hazardous Waste Management Market Volume (Thousand Ton) and Value (US$ Bn) Forecast, by Country and Sub-region, 2020–2031
15.7.1. GCC Hazardous Waste Management Market Volume (Thousand Ton) and Value (US$ Bn) Forecast, by Type, 2020–2031
15.7.2. GCC Hazardous Waste Management Market Volume (Thousand Ton) and Value (US$ Bn) Forecast, by Waste, 2020–2031
15.7.3. GCC Hazardous Waste Management Market Volume (Thousand Ton) and Value (US$ Bn) Forecast, by Chemical Composition, 2020–2031
15.7.4. GCC Hazardous Waste Management Market Volume (Thousand Ton) and Value (US$ Bn) Forecast, by Treatment, 2020–2031
15.7.5. GCC Hazardous Waste Management Market Volume (Thousand Ton) and Value (US$ Bn) Forecast, by Disposal Method, 2020–2031
15.7.6. South Africa Hazardous Waste Management Market Volume (Thousand Ton) and Value (US$ Bn) Forecast, by Type, 2020–2031
15.7.7. South Africa Hazardous Waste Management Market Volume (Thousand Ton) and Value (US$ Bn) Forecast, by Waste, 2020–2031
15.7.8. South Africa Hazardous Waste Management Market Volume (Thousand Ton) and Value (US$ Bn) Forecast, by Chemical Composition, 2020–2031
15.7.9. South Africa Hazardous Waste Management Market Volume (Thousand Ton) and Value (US$ Bn) Forecast, by Treatment, 2020–2031
15.7.10. South Africa Hazardous Waste Management Market Volume (Thousand Ton) and Value (US$ Bn) Forecast, by Disposal Method, 2020–2031
15.7.11. Rest of Middle East & Africa Hazardous Waste Management Market Volume (Thousand Ton) and Value (US$ Bn) Forecast, by Type, 2020–2031
15.7.12. Rest of Middle East & Africa Hazardous Waste Management Market Volume (Thousand Ton) and Value (US$ Bn) Forecast, by Waste, 2020–2031
15.7.13. Rest of Middle East & Africa Hazardous Waste Management Market Volume (Thousand Ton) and Value (US$ Bn) Forecast, by Chemical Composition, 2020–2031
15.7.14. Rest of Middle East & Africa Hazardous Waste Management Market Volume (Thousand Ton) and Value (US$ Bn) Forecast, by Treatment, 2020–2031
15.7.15. Rest of Middle East & Africa Hazardous Waste Management Market Volume (Thousand Ton) and Value (US$ Bn) Forecast, by Disposal Method, 2020–2031
15.8. Middle East & Africa Hazardous Waste Management Market Attractiveness Analysis
16. Competition Landscape
16.1. Global Hazardous Waste Management Company Market Share Analysis, 2021
16.2. Company Profiles (Details – Overview, Financials, Recent Developments, and Strategy)
16.2.1. Veolia
16.2.1.1. Company Description
16.2.1.2. Business Overview
16.2.1.3. Financial Overview
16.2.1.4. Strategic Overview
16.2.2. Clean Harbors Inc.
16.2.2.1. Company Description
16.2.2.2. Business Overview
16.2.2.3. Financial Overview
16.2.2.4. Strategic Overview
16.2.3. Stericycle, Inc.
16.2.3.1. Company Description
16.2.3.2. Business Overview
16.2.3.3. Financial Overview
16.2.3.4. Strategic Overview
16.2.4. American Waste Management Services, Inc.
16.2.4.1. Company Description
16.2.4.2. Business Overview
16.2.4.3. Financial Overview
16.2.4.4. Strategic Overview
16.2.5. Suez
16.2.5.1. Company Description
16.2.5.2. Business Overview
16.2.5.3. Financial Overview
16.2.5.4. Strategic Overview
16.2.6. Waste Management, Inc.
16.2.6.1. Company Description
16.2.6.2. Business Overview
16.2.6.3. Financial Overview
16.2.6.4. Strategic Overview
16.2.7. Chloros Environmental Ltd.
16.2.7.1. Company Description
16.2.7.2. Business Overview
16.2.7.3. Financial Overview
16.2.7.4. Strategic Overview
16.2.8. Republic Services
16.2.8.1. Company Description
16.2.8.2. Business Overview
16.2.8.3. Financial Overview
16.2.8.4. Strategic Overview
16.2.9. SMS ENVOCARE LTD
16.2.9.1. Company Description
16.2.9.2. Business Overview
16.2.9.3. Financial Overview
16.2.9.4. Strategic Overview
16.2.10. Morgan Group
16.2.10.1. Company Description
16.2.10.2. Business Overview
16.2.10.3. Financial Overview
16.2.10.4. Strategic Overview
16.2.11. Recology Inc
16.2.11.1. Company Description
16.2.11.2. Business Overview
16.2.11.3. Financial Overview
16.2.11.4. Strategic Overview
16.2.12. Waste Connections
16.2.12.1. Company Description
16.2.12.2. Business Overview
16.2.12.3. Financial Overview
16.2.12.4. Strategic Overview
16.2.13. Environ India
16.2.13.1. Company Description
16.2.13.2. Business Overview
16.2.13.3. Financial Overview
16.2.14. Bechtel Corporation
16.2.14.1. Company Description
16.2.14.2. Business Overview
16.2.14.3. Financial Overview
16.2.14.4. Strategic Overview
17. Primary Research: Key Insights
18. Appendix
List of Tables
Table 01: Global Hazardous Waste Management Market Volume (Thousand Ton) Forecast, by Type, 2020–2031
Table 02: Global Hazardous Waste Management Market Value (US$ Bn) Forecast, by Type, 2020–2031
Table 03: Global Hazardous Waste Management Market Volume (Thousand Ton) Forecast, by Waste, 2020–2031
Table 04: Global Hazardous Waste Management Market Value (US$ Bn) Forecast, by Waste, 2020–2031
Table 05: Global Hazardous Waste Management Market Volume (Thousand Ton) Forecast, by Chemical Composition, 2020–2031
Table 06: Global Hazardous Waste Management Market Size (US$ Mn) Forecast, by Chemical Composition, 2020–2031
Table 07: Global Hazardous Waste Management Market Volume (Thousand Ton) Forecast, by Treatment, 2020–2031
Table 08: Global Hazardous Waste Management Market Value (US$ Bn) Forecast, by Treatment, 2020–2031
Table 09: Global Hazardous Waste Management Market Volume (Thousand Ton) Forecast, by Disposal Method, 2020–2031
Table 10: Global Hazardous Waste Management Market Value (US$ Bn) Forecast, by Disposal Method, 2020–2031
Table 11: Global Hazardous Waste Management Market Volume (Thousand Ton) Forecast, by Region, 2020–2031
Table 12: Global Hazardous Waste Management Market Value (US$ Bn) Forecast, by Region, 2020–2031
Table 13: North America Hazardous Waste Management Market Volume (Thousand Ton) Forecast, by Country and Sub-region, 2020–2031
Table 14: North America Hazardous Waste Management Market Value (US$ Bn) Forecast, by Country and Sub-region, 2020–2031
Table 15: North America Hazardous Waste Management Market Volume (Thousand Ton) Forecast, by Type, 2020–2031
Table 16: North America Hazardous Waste Management Market Value (US$ Bn) Forecast, by Type, 2020–2031
Table 17: North America Hazardous Waste Management Market Volume (Thousand Ton) Forecast, by Waste, 2020–2031
Table 18: North America Hazardous Waste Management Market Value (US$ Bn) Forecast, by Waste, 2020–2031
Table 19: North America Hazardous Waste Management Market Volume (Thousand Ton) Forecast, by Treatment, 2020–2031
Table 20: North America Hazardous Waste Management Market Value (US$ Bn) Forecast, by Treatment, 2020–2031
Table 21: North America Hazardous Waste Management Market Volume (Thousand Ton) Forecast, by Chemical Composition, 2020–2031
Table 22: North America Hazardous Waste Management Market Value (US$ Bn) Forecast, by Chemical Composition, 2020–2031
Table 23: North America Hazardous Waste Management Market Volume (Thousand Ton) Forecast, by Disposal Method, 2020–2031
Table 24: North America Hazardous Waste Management Market Value (US$ Bn) Forecast, by Disposal Method, 2020–2031
Table 25: U.S. Hazardous Waste Management Market Volume (Thousand Ton) Forecast, by Type, 2020–2031
Table 26: U.S. Hazardous Waste Management Market Value (US$ Bn) Forecast, by Type, 2020–2031
Table 27: U.S. Hazardous Waste Management Market Volume (Thousand Ton) Forecast, by Waste, 2020–2031
Table 28: U.S. Hazardous Waste Management Market Value (US$ Bn) Forecast, by Waste, 2020–2031
Table 29: U.S. Hazardous Waste Management Market Volume (Thousand Ton) Forecast, by Treatment, 2020–2031
Table 30: U.S. Hazardous Waste Management Market Value (US$ Bn) Forecast, by Treatment, 2020–2031
Table 31: U.S. Hazardous Waste Management Market Volume (Thousand Ton) Forecast, by Chemical Composition, 2020–2031
Table 32: U.S. Hazardous Waste Management Market Value (US$ Bn) Forecast, by Type, 2020–2031
Table 33: U.S. Hazardous Waste Management Market Volume (Thousand Ton) Forecast, by Disposal Method, 2020–2031
Table 34: U.S. Hazardous Waste Management Market Value (US$ Bn) Forecast, by Disposal Method, 2020–2031
Table 35: Canada Hazardous Waste Management Market Volume (Thousand Ton) Forecast, by Chemical Composition, 2020–2031
Table 36: Canada Hazardous Waste Management Market Value (US$ Bn) Forecast, by Chemical Composition, 2020–2031
Table 37: Canada Hazardous Waste Management Market Volume (Thousand Ton) Forecast, by Waste, 2020–2031
Table 38: Canada Hazardous Waste Management Market Value (US$ Bn) Forecast, by Waste, 2020–2031
Table 39: Canada Hazardous Waste Management Market Volume (Thousand Ton) Forecast, by Treatment, 2020–2031
Table 40: Canada Hazardous Waste Management Market Value (US$ Bn) Forecast, by Treatment, 2020–2031
Table 41: Canada Hazardous Waste Management Market Volume (Thousand Ton) Forecast, by Type, 2020–2031
Table 42: Canada Hazardous Waste Management Market Value (US$ Bn) Forecast, by Type, 2020–2031
Table 43: Canada Hazardous Waste Management Market Volume (Thousand Ton) Forecast, by Disposal Method, 2020–2031
Table 44: Canada Hazardous Waste Management Market Value (US$ Bn) Forecast, by Disposal Method, 2020–2031
Table 45: Europe Hazardous Waste Management Market Volume (Thousand Ton) Forecast, by Country and Sub-region, 2020–2031
Table 46: Europe Hazardous Waste Management Market Value (US$ Bn) Forecast, by Country and Sub-region, 2020–2031
Table 47: Europe Hazardous Waste Management Market Volume (Thousand Ton) Forecast, by Chemical Composition, 2020–2031
Table 48: Europe Hazardous Waste Management Market Value (US$ Bn) Forecast, by Chemical Composition, 2020–2031
Table 49: Europe Hazardous Waste Management Market Volume (Thousand Ton) Forecast, by Waste, 2020–2031
Table 50: Europe Hazardous Waste Management Market Value (US$ Bn) Forecast, by Waste, 2020–2031
Table 51: Europe Hazardous Waste Management Market Volume (Thousand Ton) Forecast, by Treatment, 2020–2031
Table 52: Europe Hazardous Waste Management Market Value (US$ Bn) Forecast, by Treatment, 2020–2031
Table 53: Europe Hazardous Waste Management Market Volume (Thousand Ton) Forecast, by Type, 2020–2031
Table 54: Europe Hazardous Waste Management Market Value (US$ Bn) Forecast, by Type, 2020–2031
Table 55: Europe Hazardous Waste Management Market Volume (Thousand Ton) Forecast, by Disposal Method, 2020–2031
Table 56: Europe Hazardous Waste Management Market Value (US$ Bn) Forecast, by Disposal Method, 2020–2031
Table 57: Germany Hazardous Waste Management Market Volume (Thousand Ton) Forecast, by Type, 2020–2031
Table 58: Germany Hazardous Waste Management Market Value (US$ Bn) Forecast, by Chemical Composition, 2020–2031
Table 59: Germany Hazardous Waste Management Market Volume (Thousand Ton) Forecast, by Waste, 2020–2031
Table 60: Germany Hazardous Waste Management Market Value (US$ Bn) Forecast, by Waste, 2020–2031
Table 61: Germany Hazardous Waste Management Market Volume (Thousand Ton) Forecast, by Treatment, 2020–2031
Table 62: Germany Hazardous Waste Management Market Value (US$ Bn) Forecast, by Treatment, 2020–2031
Table 63: Germany Hazardous Waste Management Market Volume (Thousand Ton) Forecast, by Type, 2020–2031
Table 64: Germany Hazardous Waste Management Market Value (US$ Bn) Forecast, by Type, 2020–2031
Table 65: Germany Hazardous Waste Management Market Volume (Thousand Ton) Forecast, by Disposal Method, 2020–2031
Table 66: Germany Hazardous Waste Management Market Value (US$ Bn) Forecast, by Disposal Method, 2020–2031
Table 67: Italy Hazardous Waste Management Market Volume (Thousand Ton) Forecast, by Chemical Composition, 2020–2031
Table 68: Italy Hazardous Waste Management Market Value (US$ Bn) Forecast, by Type, 2020–2031
Table 69: Italy Hazardous Waste Management Market Volume (Thousand Ton) Forecast, by Waste, 2020–2031
Table 70: Italy Hazardous Waste Management Market Value (US$ Bn) Forecast, by Waste, 2020–2031
Table 71: Italy Hazardous Waste Management Market Volume (Thousand Ton) Forecast, by Treatment, 2020–2031
Table 72: Italy Hazardous Waste Management Market Value (US$ Bn) Forecast, by Treatment, 2020–2031
Table 73: Italy Hazardous Waste Management Market Volume (Thousand Ton) Forecast, by Type, 2020–2031
Table 74: Italy Hazardous Waste Management Market Value (US$ Bn) Forecast, by Chemical Composition, 2020–2031
Table 75: Italy Hazardous Waste Management Market Volume (Thousand Ton) Forecast, by Disposal Method, 2020–2031
Table 76: Italy Hazardous Waste Management Market Value (US$ Bn) Forecast, by Disposal Method, 2020–2031
Table 77: U.K. Hazardous Waste Management Market Volume (Thousand Ton) Forecast, by Type, 2020–2031
Table 78: U.K. Hazardous Waste Management Market Value (US$ Bn) Forecast, by Type, 2020–2031
Table 79: U.K. Hazardous Waste Management Market Volume (Thousand Ton) Forecast, by Waste, 2020–2031
Table 80: U.K. Hazardous Waste Management Market Value (US$ Bn) Forecast, by Waste, 2020–2031
Table 81: U.K. Hazardous Waste Management Market Volume (Thousand Ton) Forecast, by Treatment, 2020–2031
Table 82: U.K. Hazardous Waste Management Market Value (US$ Bn) Forecast, by Treatment, 2020–2031
Table 83: U.K. Hazardous Waste Management Market Volume (Thousand Ton) Forecast, by Chemical Composition, 2020–2031
Table 84: U.K. Hazardous Waste Management Market Value (US$ Bn) Forecast, by Type, 2020–2031
Table 85: U.K. Hazardous Waste Management Market Volume (Thousand Ton) Forecast, by Disposal Method, 2020–2031
Table 86: U.K. Hazardous Waste Management Market Value (US$ Bn) Forecast, by Disposal Method, 2020–2031
Table 87: Spain Hazardous Waste Management Market Volume (Thousand Ton) Forecast, by Type, 2020–2031
Table 88: Spain Hazardous Waste Management Market Value (US$ Bn) Forecast, by Chemical Composition, 2020–2031
Table 89: Spain Hazardous Waste Management Market Volume (Thousand Ton) Forecast, by Waste, 2020–2031
Table 90: Spain Hazardous Waste Management Market Value (US$ Bn) Forecast, by Waste, 2020–2031
Table 91: Spain Hazardous Waste Management Market Volume (Thousand Ton) Forecast, by Treatment, 2020–2031
Table 92: Spain Hazardous Waste Management Market Value (US$ Bn) Forecast, by Treatment, 2020–2031
Table 93: Spain Hazardous Waste Management Market Volume (Thousand Ton) Forecast, by Type, 2020–2031
Table 94: Spain Hazardous Waste Management Market Value (US$ Bn) Forecast, by Type, 2020–2031
Table 95: Spain Hazardous Waste Management Market Volume (Thousand Ton) Forecast, by Disposal Method, 2020–2031
Table 96: Spain Hazardous Waste Management Market Value (US$ Bn) Forecast, by Disposal Method, 2020–2031
Table 97: France Hazardous Waste Management Market Volume (Thousand Ton) Forecast, by Chemical Composition, 2020–2031
Table 98: France Hazardous Waste Management Market Value (US$ Bn) Forecast, by Chemical Composition, 2020–2031
Table 99: France Hazardous Waste Management Market Volume (Thousand Ton) Forecast, by Waste, 2020–2031
Table 100: France Hazardous Waste Management Market Value (US$ Bn) Forecast, by Waste, 2020–2031
Table 101: France Hazardous Waste Management Market Volume (Thousand Ton) Forecast, by Treatment, 2020–2031
Table 102: France Hazardous Waste Management Market Value (US$ Bn) Forecast, by Treatment, 2020–2031
Table 103: France Hazardous Waste Management Market Volume (Thousand Ton) Forecast, by Type, 2020–2031
Table 104: France Hazardous Waste Management Market Value (US$ Bn) Forecast, by Type, 2020–2031
Table 105: France Hazardous Waste Management Market Volume (Thousand Ton) Forecast, by Disposal Method, 2020–2031
Table 106: France Hazardous Waste Management Market Value (US$ Bn) Forecast, by Disposal Method, 2020–2031
Table 107: Russia & CIS Hazardous Waste Management Market Volume (Thousand Ton) Forecast, by Type, 2020–2031
Table 108: Russia & CIS Hazardous Waste Management Market Value (US$ Bn) Forecast, by Type, 2020–2031
Table 109: Russia & CIS Hazardous Waste Management Market Volume (Thousand Ton) Forecast, by Waste, 2020–2031
Table 110: Russia & CIS Hazardous Waste Management Market Value (US$ Bn) Forecast, by Waste, 2020–2031
Table 111: Russia & CIS Hazardous Waste Management Market Volume (Thousand Ton) Forecast, by Treatment, 2020–2031
Table 112: Russia & CIS Hazardous Waste Management Market Value (US$ Bn) Forecast, by Treatment, 2020–2031
Table 113: Russia & CIS Hazardous Waste Management Market Volume (Thousand Ton) Forecast, by Chemical Composition, 2020–2031
Table 114: Russia & CIS Hazardous Waste Management Market Value (US$ Bn) Forecast, by Type, 2020–2031
Table 115: Russia & CIS Hazardous Waste Management Market Volume (Thousand Ton) Forecast, by Disposal Method, 2020–2031
Table 116: Russia & CIS Hazardous Waste Management Market Value (US$ Bn) Forecast, by Disposal Method, 2020–2031
Table 117: Rest of Europe Hazardous Waste Management Market Volume (Thousand Ton) Forecast, by Type, 2020–2031
Table 118: Rest of Europe Hazardous Waste Management Market Value (US$ Bn) Forecast, by Type, 2020–2031
Table 119: Rest of Europe Hazardous Waste Management Market Volume (Thousand Ton) Forecast, by Waste, 2020–2031
Table 120: Rest of Europe Hazardous Waste Management Market Value (US$ Bn) Forecast, by Waste, 2020–2031
Table 121: Rest of Europe Hazardous Waste Management Market Volume (Thousand Ton) Forecast, by Treatment, 2020–2031
Table 122: Rest of Europe Hazardous Waste Management Market Value (US$ Bn) Forecast, by Treatment, 2020–2031
Table 123: Rest of Europe Hazardous Waste Management Market Volume (Thousand Ton) Forecast, by Chemical Composition, 2020–2031
Table 124: Rest of Europe Hazardous Waste Management Market Value (US$ Bn) Forecast, by Type, 2020–2031
Table 125: Rest of Europe Hazardous Waste Management Market Volume (Thousand Ton) Forecast, by Disposal Method, 2020–2031
Table 126: Rest of Europe Hazardous Waste Management Market Value (US$ Bn) Forecast, by Disposal Method, 2020–2031
Table 127: Asia Pacific Hazardous Waste Management Market Volume (Thousand Ton) Forecast, by Country and Sub-region, 2020–2031
Table 128: Asia Pacific Hazardous Waste Management Market Value (US$ Bn) Forecast, by Country and Sub-region, 2020–2031
Table 129: Asia Pacific Hazardous Waste Management Market Volume (Thousand Ton) Forecast, by Type, 2020–2031
Table 130: Asia Pacific Hazardous Waste Management Market Value (US$ Bn) Forecast, by Chemical Composition, 2020–2031
Table 131: Asia Pacific Hazardous Waste Management Market Volume (Thousand Ton) Forecast, by Waste, 2020–2031
Table 132: Asia Pacific Hazardous Waste Management Market Value (US$ Bn) Forecast, by Waste, 2020–2031
Table 133: Asia Pacific Hazardous Waste Management Market Volume (Thousand Ton) Forecast, by Treatment, 2020–2031
Table 134: Asia Pacific Hazardous Waste Management Market Value (US$ Bn) Forecast, by Treatment, 2020–2031
Table 135: Asia Pacific Hazardous Waste Management Market Volume (Thousand Ton) Forecast, by Chemical Composition, 2020–2031
Table 136: Asia Pacific Hazardous Waste Management Market Value (US$ Bn) Forecast, by Type, 2020–2031
Table 137: Asia Pacific Hazardous Waste Management Market Volume (Thousand Ton) Forecast, by Disposal Method, 2020–2031
Table 138: Asia Pacific Hazardous Waste Management Market Value (US$ Bn) Forecast, by Disposal Method, 2020–2031
Table 139: China Hazardous Waste Management Market Volume (Thousand Ton) Forecast, by Type, 2020–2031
Table 140: China Hazardous Waste Management Market Value (US$ Bn) Forecast, by Chemical Composition, 2020–2031
Table 141: China Hazardous Waste Management Market Volume (Thousand Ton) Forecast, by Waste, 2020–2031
Table 142: China Hazardous Waste Management Market Value (US$ Bn) Forecast, by Waste, 2020–2031
Table 143: China Hazardous Waste Management Market Volume (Thousand Ton) Forecast, by Treatment, 2020–2031
Table 144: China Hazardous Waste Management Market Value (US$ Bn) Forecast, by Treatment, 2020–2031
Table 145: China Hazardous Waste Management Market Volume (Thousand Ton) Forecast, by Chemical Composition, 2020–2031
Table 146: China Hazardous Waste Management Market Value (US$ Bn) Forecast, by Type, 2020–2031
Table 147: China Hazardous Waste Management Market Volume (Thousand Ton) Forecast, by Disposal Method, 2020–2031
Table 148: China Hazardous Waste Management Market Value (US$ Bn) Forecast, by Disposal Method, 2020–2031
Table 149: India Hazardous Waste Management Market Volume (Thousand Ton) Forecast, by Type, 2020–2031
Table 150: India Hazardous Waste Management Market Value (US$ Bn) Forecast, by Chemical Composition, 2020–2031
Table 151: India Hazardous Waste Management Market Volume (Thousand Ton) Forecast, by Waste, 2020–2031
Table 152: India Hazardous Waste Management Market Value (US$ Bn) Forecast, by Waste, 2020–2031
Table 153: India Hazardous Waste Management Market Volume (Thousand Ton) Forecast, by Treatment, 2020–2031
Table 154: India Hazardous Waste Management Market Value (US$ Bn) Forecast, by Treatment, 2020–2031
Table 155: India Hazardous Waste Management Market Volume (Thousand Ton) Forecast, by Type, 2020–2031
Table 156: India Hazardous Waste Management Market Value (US$ Bn) Forecast, by Type, 2020–2031
Table 157: India Hazardous Waste Management Market Volume (Thousand Ton) Forecast, by Disposal Method, 2020–2031
Table 158: India Hazardous Waste Management Market Value (US$ Bn) Forecast, by Disposal Method, 2020–2031
Table 159: Japan Hazardous Waste Management Market Volume (Thousand Ton) Forecast, by Chemical Composition, 2020–2031
Table 160: Japan Hazardous Waste Management Market Value (US$ Bn) Forecast, by Type, 2020–2031
Table 161: Japan Hazardous Waste Management Market Volume (Thousand Ton) Forecast, by Waste, 2020–2031
Table 162: Japan Hazardous Waste Management Market Value (US$ Bn) Forecast, by Waste, 2020–2031
Table 163: Japan Hazardous Waste Management Market Volume (Thousand Ton) Forecast, by Treatment, 2020–2031
Table 164: Japan Hazardous Waste Management Market Value (US$ Bn) Forecast, by Treatment, 2020–2031
Table 165: Japan Hazardous Waste Management Market Volume (Thousand Ton) Forecast, by Type, 2020–2031
Table 166: Japan Hazardous Waste Management Market Value (US$ Bn) Forecast, by Chemical Composition, 2020–2031
Table 167: Japan Hazardous Waste Management Market Volume (Thousand Ton) Forecast, by Disposal Method, 2020–2031
Table 168: Japan Hazardous Waste Management Market Value (US$ Bn) Forecast, by Disposal Method, 2020–2031
Table 169: ASEAN Hazardous Waste Management Market Volume (Thousand Ton) Forecast, by Type, 2020–2031
Table 170: ASEAN Hazardous Waste Management Market Value (US$ Bn) Forecast, by Type, 2020–2031
Table 171: ASEAN Hazardous Waste Management Market Volume (Thousand Ton) Forecast, by Waste, 2020–2031
Table 172: ASEAN Hazardous Waste Management Market Value (US$ Bn) Forecast, by Waste, 2020–2031
Table 173: ASEAN Hazardous Waste Management Market Volume (Thousand Ton) Forecast, by Treatment, 2020–2031
Table 174: ASEAN Hazardous Waste Management Market Value (US$ Bn) Forecast, by Treatment, 2020–2031
Table 175: ASEAN Hazardous Waste Management Market Volume (Thousand Ton) Forecast, by Chemical Composition, 2020–2031
Table 176: ASEAN Hazardous Waste Management Market Value (US$ Bn) Forecast, by Type, 2020–2031
Table 177: ASEAN Hazardous Waste Management Market Volume (Thousand Ton) Forecast, by Disposal Method, 2020–2031
Table 178: ASEAN Hazardous Waste Management Market Value (US$ Bn) Forecast, by Disposal Method, 2020–2031
Table 179: Rest of Asia Pacific Hazardous Waste Management Market Volume (Thousand Ton) Forecast, by Chemical Composition, 2020–2031
Table 180: Rest of Asia Pacific Hazardous Waste Management Market Value (US$ Bn) Forecast, by Type, 2020–2031
Table 181: Rest of Asia Pacific Hazardous Waste Management Market Volume (Thousand Ton) Forecast, by Waste, 2020–2031
Table 182: Rest of Asia Pacific Hazardous Waste Management Market Value (US$ Bn) Forecast, by Waste, 2020–2031
Table 183: Rest of Asia Pacific Hazardous Waste Management Market Volume (Thousand Ton) Forecast, by Treatment, 2020–2031
Table 184: Rest of Asia Pacific Hazardous Waste Management Market Value (US$ Bn) Forecast, by Treatment, 2020–2031
Table 185: Rest of Asia Pacific Hazardous Waste Management Market Volume (Thousand Ton) Forecast, by Type, 2020–2031
Table 186: Rest of Asia Pacific Hazardous Waste Management Market Value (US$ Bn) Forecast, by Chemical Composition, 2020–2031
Table 187: Rest of Asia Pacific Hazardous Waste Management Market Volume (Thousand Ton) Forecast, by Disposal Method, 2020–2031
Table 188: Rest of Asia Pacific Hazardous Waste Management Market Value (US$ Bn) Forecast, by Disposal Method, 2020–2031
Table 189: Latin America Hazardous Waste Management Market Volume (Thousand Ton) Forecast, by Country and Sub-region, 2020–2031
Table 190: Latin America Hazardous Waste Management Market Value (US$ Bn) Forecast, by Country and Sub-region, 2020–2031
Table 191: Latin America Hazardous Waste Management Market Volume (Thousand Ton) Forecast, by Type, 2020–2031
Table 192: Latin America Hazardous Waste Management Market Value (US$ Bn) Forecast, by Type, 2020–2031
Table 193: Latin America Hazardous Waste Management Market Volume (Thousand Ton) Forecast, by Waste, 2020–2031
Table 194: Latin America Hazardous Waste Management Market Value (US$ Bn) Forecast, by Waste, 2020–2031
Table 195: Latin America Hazardous Waste Management Market Volume (Thousand Ton) Forecast, by Treatment, 2020–2031
Table 196: Latin America Hazardous Waste Management Market Value (US$ Bn) Forecast, by Treatment, 2020–2031
Table 197: Latin America Hazardous Waste Management Market Volume (Thousand Ton) Forecast, by Chemical Composition, 2020–2031
Table 198: Latin America Hazardous Waste Management Market Value (US$ Bn) Forecast, by Chemical Composition, 2020–2031
Table 199: Latin America Hazardous Waste Management Market Volume (Thousand Ton) Forecast, by Disposal Method, 2020–2031
Table 200: Latin America Hazardous Waste Management Market Value (US$ Bn) Forecast, by Disposal Method, 2020–2031
Table 201: Brazil Hazardous Waste Management Market Volume (Thousand Ton) Forecast, by Type, 2020–2031
Table 202: Brazil Hazardous Waste Management Market Value (US$ Bn) Forecast, by Type, 2020–2031
Table 203: Brazil Hazardous Waste Management Market Volume (Thousand Ton) Forecast, by Waste, 2020–2031
Table 204: Brazil Hazardous Waste Management Market Value (US$ Bn) Forecast, by Waste, 2020–2031
Table 205: Brazil Hazardous Waste Management Market Volume (Thousand Ton) Forecast, by Treatment, 2020–2031
Table 206: Brazil Hazardous Waste Management Market Value (US$ Bn) Forecast, by Treatment, 2020–2031
Table 207: Brazil Hazardous Waste Management Market Volume (Thousand Ton) Forecast, by Chemical Composition, 2020–2031
Table 208: Brazil Hazardous Waste Management Market Value (US$ Bn) Forecast, by Chemical Composition, 2020–2031
Table 209: Brazil Hazardous Waste Management Market Volume (Thousand Ton) Forecast, by Disposal Method, 2020–2031
Table 210: Brazil Hazardous Waste Management Market Value (US$ Bn) Forecast, by Disposal Method, 2020–2031
Table 211: Mexico Hazardous Waste Management Market Volume (Thousand Ton) Forecast, by Type, 2020–2031
Table 212: Mexico Hazardous Waste Management Market Value (US$ Bn) Forecast, by Type, 2020–2031
Table 213: Mexico Hazardous Waste Management Market Volume (Thousand Ton) Forecast, by Waste, 2020–2031
Table 214: Mexico Hazardous Waste Management Market Value (US$ Bn) Forecast, by Waste, 2020–2031
Table 215: Mexico Hazardous Waste Management Market Volume (Thousand Ton) Forecast, by Treatment, 2020–2031
Table 216: Mexico Hazardous Waste Management Market Value (US$ Bn) Forecast, by Treatment, 2020–2031
Table 217: Mexico Hazardous Waste Management Market Volume (Thousand Ton) Forecast, by Chemical Composition, 2020–2031
Table 218: Mexico Hazardous Waste Management Market Value (US$ Bn) Forecast, by Type, 2020–2031
Table 219: Mexico Hazardous Waste Management Market Volume (Thousand Ton) Forecast, by Disposal Method, 2020–2031
Table 220: Mexico Hazardous Waste Management Market Value (US$ Bn) Forecast, by Disposal Method, 2020–2031
Table 221: Rest of Latin America Hazardous Waste Management Market Volume (Thousand Ton) Forecast, by Type, 2020–2031
Table 222: Rest of Latin America Hazardous Waste Management Market Value (US$ Bn) Forecast, by Chemical Composition, 2020–2031
Table 223: Rest of Latin America Hazardous Waste Management Market Volume (Thousand Ton) Forecast, by Waste, 2020–2031
Table 224: Rest of Latin America Hazardous Waste Management Market Value (US$ Bn) Forecast, by Waste, 2020–2031
Table 225: Rest of Latin America Hazardous Waste Management Market Volume (Thousand Ton) Forecast, by Treatment, 2020–2031
Table 226: Rest of Latin America Hazardous Waste Management Market Value (US$ Bn) Forecast, by Treatment, 2020–2031
Table 227: Rest of Latin America Hazardous Waste Management Market Volume (Thousand Ton) Forecast, by Chemical Composition, 2020–2031
Table 228: Rest of Latin America Hazardous Waste Management Market Value (US$ Bn) Forecast, by Type, 2020–2031
Table 229: Rest of Latin America Hazardous Waste Management Market Volume (Thousand Ton) Forecast, by Disposal Method, 2020–2031
Table 230: Rest of Latin America Hazardous Waste Management Market Value (US$ Bn) Forecast, by Disposal Method, 2020–2031
Table 231: Middle East & Africa Hazardous Waste Management Market Volume (Thousand Ton) Forecast, by Country and Sub-region, 2020–2031
Table 232: Middle East & Africa Hazardous Waste Management Market Value (US$ Bn) Forecast, by Country and Sub-region, 2020–2031
Table 233: Middle East & Africa Hazardous Waste Management Market Volume (Thousand Ton) Forecast, by Type, 2020–2031
Table 234: Middle East & Africa Hazardous Waste Management Market Value (US$ Bn) Forecast, by Chemical Composition, 2020–2031
Table 235: Middle East & Africa Hazardous Waste Management Market Volume (Thousand Ton) Forecast, by Waste, 2020–2031
Table 236: Middle East & Africa Hazardous Waste Management Market Value (US$ Bn) Forecast, by Waste, 2020–2031
Table 237: Middle East & Africa Hazardous Waste Management Market Volume (Thousand Ton) Forecast, by Treatment, 2020–2031
Table 238: Middle East & Africa Hazardous Waste Management Market Value (US$ Bn) Forecast, by Treatment, 2020–2031
Table 239: Middle East & Africa Hazardous Waste Management Market Volume (Thousand Ton) Forecast, by Type, 2020–2031
Table 240: Middle East & Africa Hazardous Waste Management Market Value (US$ Bn) Forecast, by Type, 2020–2031
Table 241: Middle East & Africa Hazardous Waste Management Market Volume (Thousand Ton) Forecast, by Disposal Method, 2020–2031
Table 242: Middle East & Africa Hazardous Waste Management Market Value (US$ Bn) Forecast, by Disposal Method, 2020–2031
Table 243: GCC Hazardous Waste Management Market Volume (Thousand Ton) Forecast, by Chemical Composition, 2020–2031
Table 244: GCC Hazardous Waste Management Market Value (US$ Bn) Forecast, by Type, 2020–2031
Table 245: GCC Hazardous Waste Management Market Volume (Thousand Ton) Forecast, by Waste, 2020–2031
Table 246: GCC Hazardous Waste Management Market Value (US$ Bn) Forecast, by Waste, 2020–2031
Table 247: GCC Hazardous Waste Management Market Volume (Thousand Ton) Forecast, by Treatment, 2020–2031
Table 248: GCC Hazardous Waste Management Market Value (US$ Bn) Forecast, by Treatment, 2020–2031
Table 249: GCC Hazardous Waste Management Market Volume (Thousand Ton) Forecast, by Type, 2020–2031
Table 250: GCC Hazardous Waste Management Market Value (US$ Bn) Forecast, by Chemical Composition, 2020–2031
Table 251: GCC Hazardous Waste Management Market Volume (Thousand Ton) Forecast, by Disposal Method, 2020–2031
Table 252: GCC Hazardous Waste Management Market Value (US$ Bn) Forecast, by Disposal Method, 2020–2031
Table 253: South Africa Hazardous Waste Management Market Volume (Thousand Ton) Forecast, by Type, 2020–2031
Table 254: South Africa Hazardous Waste Management Market Value (US$ Bn) Forecast, by Type, 2020–2031
Table 255: South Africa Hazardous Waste Management Market Volume (Thousand Ton) Forecast, by Waste, 2020–2031
Table 256: South Africa Hazardous Waste Management Market Value (US$ Bn) Forecast, by Waste, 2020–2031
Table 257: South Africa Hazardous Waste Management Market Volume (Thousand Ton) Forecast, by Treatment, 2020–2031
Table 258: South Africa Hazardous Waste Management Market Value (US$ Bn) Forecast, by Treatment, 2020–2031
Table 259: South Africa Hazardous Waste Management Market Volume (Thousand Ton) Forecast, by Chemical Composition, 2020–2031
Table 260: South Africa Hazardous Waste Management Market Value (US$ Bn) Forecast, by Type, 2020–2031
Table 261: South Africa Hazardous Waste Management Market Volume (Thousand Ton) Forecast, by Disposal Method, 2020–2031
Table 262: South Africa Hazardous Waste Management Market Value (US$ Bn) Forecast, by Disposal Method, 2020–2031
Table 263: Rest of Middle East & Africa Hazardous Waste Management Market Volume (Thousand Ton) Forecast, by Chemical Composition, 2020–2031
Table 264: Rest of Middle East & Africa Hazardous Waste Management Market Value (US$ Bn) Forecast, by Type, 2020–2031
Table 265: Rest of Middle East & Africa Hazardous Waste Management Market Volume (Thousand Ton) Forecast, by Waste, 2020–2031
Table 266: Rest of Middle East & Africa Hazardous Waste Management Market Value (US$ Bn) Forecast, by Waste, 2020–2031
Table 267: Rest of Middle East & Africa Hazardous Waste Management Market Volume (Thousand Ton) Forecast, by Treatment, 2020–2031
Table 268: Rest of Middle East & Africa Hazardous Waste Management Market Value (US$ Bn) Forecast, by Treatment, 2020–2031
Table 269: Rest of Middle East & Africa Hazardous Waste Management Market Volume (Thousand Ton) Forecast, by Type, 2020–2031
Table 270: Rest of Middle East & Africa Hazardous Waste Management Market Value (US$ Bn) Forecast, by Chemical Composition, 2020–2031
Table 271: Rest of Middle East & Africa Hazardous Waste Management Market Volume (Thousand Ton) Forecast, by Disposal Method, 2020–2031
Table 272: Rest of Middle East & Africa Hazardous Waste Management Market Value (US$ Bn) Forecast, by Disposal Method, 2020–2031
Table 273: Rest of Middle East & Africa Hazardous Waste Management Market Volume (Thousand Ton) Forecast, by Disposal Method, 2020–2031
Table 274: Rest of Middle East & Africa Hazardous Waste Management Market Value (US$ Bn) Forecast, by Disposal Method, 2020–2031
List of Figures
Figure 01: Global Hazardous Waste Management Market Size (US$ Mn) and Volume (Thousand Ton) Forecast, 2020–2031
Figure 02: Price Comparison Analysis, by Region (US$/Unit), 2020
Figure 03: Global Hazardous Waste Management Market Value Share Analysis, by Type, 2020 and 2031
Figure 04: Global Hazardous Waste Management Market Attractiveness Analysis, by Chemical Composition
Figure 05: Global Hazardous Waste Management Market Value Share Analysis, by Waste, 2020 and 2031
Figure 06: Global Hazardous Waste Management Market Attractiveness Analysis, by Waste
Figure 07: Global Hazardous Waste Management Market Value Share Analysis, by Chemical Composition, 2020 and 2031
Figure 08: Global Hazardous Waste Management Market Attractiveness Analysis, by Type
Figure 09: Global Hazardous Waste Management Market Value Share Analysis, by Treatment, 2020 and 2031
Figure 10: Global Hazardous Waste Management Market Attractiveness Analysis, by Treatment
Figure 11: Global Hazardous Waste Management Market Value Share Analysis, by Disposal Method, 2020 and 2031
Figure 12: Global Hazardous Waste Management Market Attractiveness Analysis, by Disposal Method
Figure 13: Global Hazardous Waste Management Market Value Share Analysis, by Region, 2020 and 2031
Figure 14: Global Hazardous Waste Management Market Attractiveness Analysis, by Region
Figure 15: North America Hazardous Waste Management Market Value Share Analysis, by Type, 2020 and 2031
Figure 16: North America Hazardous Waste Management Market Value Share Analysis, by Waste, 2020 and 2031
Figure 17: North America Hazardous Waste Management Market Value Share Analysis, by Chemical Composition, 2020 and 2031
Figure 18: North America Hazardous Waste Management Market Value Share Analysis, by Treatment, 2020 and 2031
Figure 19: North America Hazardous Waste Management Market Value Share Analysis, by Disposal Method, 2020 and 2031
Figure 20: North America Hazardous Waste Management Market Value Share Analysis, by Country, 2020 and 2031
Figure 22: North America Hazardous Waste Management Market Attractiveness Analysis, by Type
Figure 24: North America Hazardous Waste Management Market Attractiveness Analysis, by Country
Figure 21: North America Hazardous Waste Management Market Attractiveness Analysis, by Waste
Figure 23: North America Hazardous Waste Management Market Attractiveness Analysis, by Chemical Composition
Figure 25: North America Hazardous Waste Management Market Attractiveness Analysis, by Treatment
Figure 26: North America Hazardous Waste Management Market Attractiveness Analysis, by Disposal Method
Figure 27: Europe Hazardous Waste Management Market Value Share Analysis, by Type, 2020 and 2031
Figure 28: Europe Hazardous Waste Management Market Value Share Analysis, by Waste, 2020 and 2031
Figure 29: Europe Hazardous Waste Management Market Value Share Analysis, by Chemical Composition, 2020 and 2031
Figure 30: Europe Hazardous Waste Management Market Value Share Analysis, by Treatment, 2020 and 2031
Figure 31: Europe Hazardous Waste Management Market Value Share Analysis, by Disposal Method, 2020 and 2031
Figure 32: Europe Hazardous Waste Management Market Value Share Analysis, by Country and Sub-region, 2020 and 2031
Figure 34: Europe Hazardous Waste Management Market Attractiveness Analysis, by Type
Figure 36: Europe Hazardous Waste Management Market Attractiveness Analysis, by Country and Sub-region
Figure 33: Europe Hazardous Waste Management Market Attractiveness Analysis, by Waste
Figure 35: Europe Hazardous Waste Management Market Attractiveness Analysis, by Chemical Composition
Figure 37: Europe Hazardous Waste Management Market Attractiveness Analysis, by Treatment
Figure 38: Europe Hazardous Waste Management Market Attractiveness Analysis, by Disposal Method
Figure 39: Asia Pacific Hazardous Waste Management Market Value Share Analysis, by Type, 2020 and 2031
Figure 40: Asia Pacific Hazardous Waste Management Market Value Share Analysis, by Waste, 2020 and 2031
Figure 41: Asia Pacific Hazardous Waste Management Market Value Share Analysis, by Chemical Composition, 2020 and 2031
Figure 42: Asia Pacific Hazardous Waste Management Market Value Share Analysis, by Treatment, 2020 and 2031
Figure 43: Asia Pacific Hazardous Waste Management Market Value Share Analysis, by Disposal Method, 2020 and 2031
Figure 44: Asia Pacific Hazardous Waste Management Market Value Share Analysis, by Country and Sub-region, 2020 and 2031
Figure 46: Asia Pacific Hazardous Waste Management Market Attractiveness Analysis, by Type
Figure 48: Asia Pacific Hazardous Waste Management Market Attractiveness Analysis, by Country and Sub-region
Figure 45: Asia Pacific Hazardous Waste Management Market Attractiveness Analysis, by Waste
Figure 47: Asia Pacific Hazardous Waste Management Market Attractiveness Analysis, by Chemical Composition
Figure 49: Asia Pacific Hazardous Waste Management Market Attractiveness Analysis, by Treatment
Figure 50: Asia Pacific Hazardous Waste Management Market Attractiveness Analysis, by Disposal Method
Figure 51: Latin America Hazardous Waste Management Market Value Share Analysis, by Type, 2020 and 2031
Figure 52: Latin America Hazardous Waste Management Market Value Share Analysis, by Waste, 2020 and 2031
Figure 53: Latin America Hazardous Waste Management Market Value Share Analysis, by Chemical Composition, 2020 and 2031
Figure 54: Latin America Hazardous Waste Management Market Value Share Analysis, by Treatment, 2020 and 2031
Figure 55: Latin America Hazardous Waste Management Market Value Share Analysis, by Disposal Method, 2020 and 2031
Figure 56: Latin America Hazardous Waste Management Market Value Share Analysis, by Country and Sub-region, 2020 and 2031
Figure 58: Latin America Hazardous Waste Management Market Attractiveness Analysis, by Type
Figure 60: Latin America Hazardous Waste Management Market Attractiveness Analysis, by Country and Sub-region
Figure 57: Latin America Hazardous Waste Management Market Attractiveness Analysis, by Waste
Figure 59: Latin America Hazardous Waste Management Market Attractiveness Analysis, by Chemical Composition
Figure 61: Latin America Hazardous Waste Management Market Attractiveness Analysis, by Treatment
Figure 62: Latin America Hazardous Waste Management Market Attractiveness Analysis, by Disposal Method
Figure 63: Middle East & Africa Hazardous Waste Management Market Value Share Analysis, by Type, 2020 and 2031
Figure 64: Middle East & Africa Hazardous Waste Management Market Value Share Analysis, by Waste, 2020 and 2031
Figure 65: Middle East & Africa Hazardous Waste Management Market Value Share Analysis, by Chemical Composition, 2020 and 2031
Figure 66: Middle East & Africa Hazardous Waste Management Market Value Share Analysis, by Treatment, 2020 and 027
Figure 67: Middle East & Africa Hazardous Waste Management Market Value Share Analysis, by Disposal Method, 2020 and 2031
Figure 68: Middle East & Africa Hazardous Waste Management Market Value Share Analysis, by Country and Sub-region, 2020 and 2031
Figure 70: Middle East & Africa Hazardous Waste Management Market Attractiveness Analysis, by Waste
Figure 72: Middle East & Africa Hazardous Waste Management Market Attractiveness Analysis, by Country and Sub-region
Figure 69: Middle East & Africa Hazardous Waste Management Market Attractiveness Analysis, by Chemical Composition,
Figure 71: Middle East & Africa Hazardous Waste Management Market Attractiveness Analysis, by Chemical Composition
Figure 73: Middle East & Africa Hazardous Waste Management Market Attractiveness Analysis, by Treatment
Figure 74: Middle East & Africa Hazardous Waste Management Market Attractiveness Analysis, by Disposal Method
Figure 75: Global Hazardous Waste Management Market Analysis, by Company (2020)
Copyright © Transparency Market Research, Inc. All Rights reserved
Trust Online

Hazardous Waste Management Market