
Reports
Reports
Analysts’ Viewpoint on Market Scenario
Peer-to-peer lending platforms are loan disbursement marketplaces that directly connect borrowers to investors. The popularity of peer-to-peer lending apps has been rising, as these apps have lower operation and loan generation costs; lower interest rates; and simplified and faster loan disbursement and risk assessment process compared to traditional financial institutions.
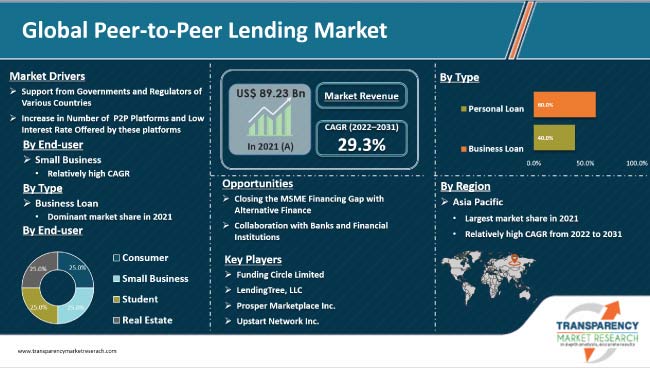
Governments of various countries and financial regulatory bodies recognize peer-to-peer financing and implement regulations and policies that support online peer-to-peer lending. Small industries are opting for peer-to-peer business lending to meet their financial needs due to the stringent credit assessment and time-consuming loan process of banks.
Collaboration of traditional banks and financial institutions with peer-to-peer financing platforms is expected to create lucrative opportunities for companies operating in the global peer-to-peer lending market.
Peer-to-peer lending is an alternative finance method of lending money to businesses or individuals through online lending platforms. Online peer-to-peer lending is also known as “crowd lending” or “social lending.” Peer-to-peer lending platforms connect individuals or businesses in need of credit with others willing to lend. These platforms allow borrowers to lend money from individuals and big investors at a lower interest rate than traditional financial institutions.
Peer-to-peer lending apps allow investors to go through a list of verified borrowers before they lend to them. Lenders can diversify their investments by lending to multiple borrowers. Peer-to-peer financing and peer-to-peer business loans are major components of the financial technology or the fintech sector. Rise in adoption of the best peer-to-peer lending platforms for investors and borrowers; and increase in popularity of peer-to-peer loan management software are anticipated to augment the global peer-to-peer lending market share during the forecast period.
Peer-to-peer investing is gradually gaining popularity among investors and borrowers across the world. Peer-to-peer business lending provides easy loans and additional credit to small and medium businesses. It also makes money lending more efficient than conventional financial organizations and digital lending platforms; and saves operational costs through online platforms. Thus, demand for peer-to-peer borrowing has been surging across the globe.
Rapid expansion of small and medium businesses, transparency in lending, lower market risks, and improved interest rates are some of the major factors that are driving the peer-to-peer business loan market. Furthermore, demand for peer-to-peer lending is expected to rise with the development of different economies, with easy availability of credit.
China, the U.S., and the U.K. spearhead the peer-to-peer lending marketplace. These countries have evolved into mature peer-to-peer lending ecosystems. However, according to the market forecast, countries such as India, France, Spain, Brazil, Mexico, and ASEAN states are emerging markets for peer-to-peer personal loans due to the lack of credit access for borrowers. Peer-to-peer lending platforms have been actively seeking cross-border funding to expand into international markets.
Governments and regulatory bodies of various countries are encouraging peer-to-peer lending platforms by providing a specific and suitable framework that supports the industry and protects peer-to-peer lending providers from potential risks. The Financial Conduct Authority of the U.K. has implemented regulatory standards for the peer-to-peer financing industry to address the risks and other typical features related to the industry.
The peer-to-peer investing industry has also received substantial support from the Government of France, which has created a full-fledged website that provides a directory of leading online peer-to-peer lending projects. Additionally, the website provides back-office support and information about important industry activities.
The Reserve Bank of India (RBI) has regulated peer-to-peer lending platforms and standardized the scope of peer-to-peer borrowing activities. The norms state that every peer-to-peer lending platform has to be registered for an NBFC-P2P license to provide P2P lending services. The lending amount cannot be disbursed without the approval of the individual lender and a signed loan contract by both parties. Thus, outlook for the peer-to-peer lending market appears positive due to the rise in support from government and regulatory bodies across various countries.
According to the World Trade Organization’s (WTO) MSMEs Day 2020 report, 95% of global companies are MSMEs (micro, small, and medium enterprises), which account for 60% of total employment. MSMEs contribute around 35% and 50% of total GDP in developing and developed countries, respectively. As per the article ‘The Rise of Digital SME (small and medium enterprises) Lending’ published by Fincog (Fintech Consultancy Group), the European Commission, there are more than 25 million SMEs present in the European region that employed around 97 million people, accounting for about 67% of total workforce of the region.
Furthermore, SMEs generate approximately US$ 4 Trn every year in Europe. MSMEs struggle to access financing for fixed investments, inventory & working capital, and development & product launch despite providing the majority of employment and significantly contributing to the global economy. Traditional banks and financial institutions are hesitant to lend to MSMEs due to high default rates, lack of data, and small lending amount, which is less profitable.
Peer-to-peer lending platforms have emerged as a solution for lending issues faced by SMEs, as these platforms provide a simplified lending process without the need to mortgage. This enables MSMEs to reduce their financial constraints. Online peer-to-peer platforms assess borrowers’ risk levels and credit scores by using advanced technologies and algorithms. Thus, rise in number of MSMEs inclined toward peer-to-peer business loan platforms is creating lucrative opportunities for the peer-to-peer lending market.
Asia Pacific is anticipated to dominate the global peer-to-peer lending market during the forecast period. Growth of the market in Asia Pacific can be ascribed to the increase in demand for peer-to-peer lending apps from retail investors due to higher returns in comparison to traditional financial institutions.
The number of peer-to-peer lending platforms and the amount of loan disbursement through these platforms has been rising in developing countries such as India, Indonesia, Malaysia, and South Korea, owing to the presence of unbanked and under-banked MSMEs (micro, small, and medium enterprises); and poor credit history of individuals.
The global market is consolidated, with a few large-scale vendors controlling majority of the share. Expansion of product portfolios and mergers and acquisitions are key strategies adopted by prominent players. Detailed profiles of peer-to-peer lending companies have been included in the market report to evaluate their financials, key product offerings, recent developments, and strategies.
Prominent players operating in the global peer-to-peer lending market are Estateguru, Funding Circle Limited, Kabbage Inc., LendingTree, LLC, Lendwise, Lendbox, Max Crowdfund B.V., Peerform, Prosper Marketplace Inc., PYT FUNDS, RateSetter, Rendity GmbH, and Upstart Network Inc.
Each of these players has been profiled in the peer-to-peer lending market report based on parameters such as company overview, financial overview, business strategies, product portfolio, business segments, and recent developments.
|
Attribute |
Detail |
|
Market Size Value in 2021 |
US$ 89.23 Bn |
|
Market Forecast Value in 2031 |
US$ 1.14 Trn |
|
Growth Rate(CAGR) |
29.3% |
|
Forecast Period |
2022–2031 |
|
Historical Data Available for |
2017–2020 |
|
Quantitative Units |
US$ Bn/Trn for Value |
|
Market Analysis |
Includes cross segment analysis at global as well as regional level. Furthermore, qualitative analysis includes drivers, restraints, opportunities, key trends, Porter’s Five Forces analysis, value chain analysis, and key trend analysis. |
|
Competition Landscape |
|
|
Format |
Electronic (PDF) + Excel |
|
Market Segmentation |
|
|
Regions Covered |
|
|
Countries Covered |
|
|
Companies Profiled |
|
|
Customization Scope |
Available upon request |
|
Pricing |
Available upon request |
The market stood at US$ 89.23 Bn in 2021.
The market is estimated to grow at the rate of 29.3% during the forecast period.
Governmental and regulatory support, and increase in number of P2P platforms and low interest rates offered by these platforms.
Business loan was the largest type segment of the market in 2021.
Asia Pacific is expected to dominate the market during the forecast period.
Estateguru, Funding Circle Limited, Kabbage Inc., LendingTree, LLC, Lendwise, Lendbox, Max Crowdfund B.V., Peerform, Prosper Marketplace Inc., PYT FUNDS, RateSetter, Rendity GmbH, and Upstart Network Inc.
1. Preface
1.1. Market Introduction
1.2. Market Segmentation
1.3. Key Research Objectives
2. Assumptions and Research Methodology
2.1. Research Methodology
2.1.1. List of Primary and Secondary Sources
2.2. Key Assumptions for Data Modelling
3. Executive Summary: Global Peer-to-Peer Lending Market
4. Market Overview
4.1. Market Definition
4.2. Technology/ Product Roadmap
4.3. Market Factor Analysis
4.3.1. Forecast Factors
4.3.2. Ecosystem/ Value Chain Analysis
4.3.3. Market Dynamics (Growth Influencers)
4.3.3.1. Drivers
4.3.3.2. Restraints
4.3.3.3. Opportunities
4.3.3.4. Impact Analysis of Drivers and Restraints
4.4. COVID-19 Impact Analysis
4.4.1. Impact of COVID-19 on Peer-to-Peer Lending Market
4.4.2. End-user Sentiment Analysis: Comparative Analysis on Spending
4.4.2.1. Increase in Spending
4.4.2.2. Decrease in Spending
4.4.3. Short Term and Long Term Impact on the Market
4.5. Market Opportunity Assessment – by Region (North America/ Europe/ Asia Pacific/ Middle East & Africa/ South America)
4.5.1. By Type
4.5.2. By End-user
5. Global Peer-to-Peer Lending Market Analysis and Forecast
5.1. Market Revenue Analysis (US$ Bn), 2016-2031
5.1.1. Historic Growth Trends, 2016-2021
5.1.2. Forecast Trends, 2022-2031
6. Global Peer-to-Peer Lending Market Analysis, by Type
6.1. Overview and Definitions
6.2. Key Segment Analysis
6.3. Peer-to-Peer Lending Market Size (US$ Bn) Forecast, by Type, 2018 - 2031
6.3.1. Personal Loan
6.3.2. Business Loan
7. Global Peer-to-Peer Lending Market Analysis, by End-user
7.1. Overview and Definitions
7.2. Key Segment Analysis
7.3. Peer-to-Peer Lending Market Size (US$ Bn) Forecast, by End-user, 2018 - 2031
7.3.1. Consumer
7.3.2. Small Business
7.3.3. Student
7.3.4. Real Estate
8. Global Peer-to-Peer Lending Market Analysis and Forecasts, by Region
8.1. Key Findings
8.2. Market Size (US$ Bn) Forecast by Region, 2018-2031
8.2.1. North America
8.2.2. Europe
8.2.3. Asia Pacific
8.2.4. Middle East & Africa
8.2.5. South America
9. North America Peer-to-Peer Lending Market Analysis and Forecast
9.1. Regional Outlook
9.2. Peer-to-Peer Lending Market Size (US$ Bn) Analysis and Forecast (2018 - 2031)
9.2.1. By Type
9.2.2. By End-user
9.3. Peer-to-Peer Lending Market Size (US$ Bn) Forecast, by Country, 2018 - 2031
9.3.1. U.S.
9.3.2. Canada
9.3.3. Mexico
10. Europe Peer-to-Peer Lending Market Analysis and Forecast
10.1. Regional Outlook
10.2. Peer-to-Peer Lending Market Size (US$ Bn) Analysis and Forecast (2018 - 2031)
10.2.1. By Type
10.2.2. By End-user
10.3. Peer-to-Peer Lending Market Size (US$ Bn) Forecast, by Country & Sub-region, 2018 - 2031
10.3.1. Germany
10.3.2. UK
10.3.3. France
10.3.4. Italy
10.3.5. Spain
10.3.6. Rest of Europe
11. Asia Pacific Peer-to-Peer Lending Market Analysis and Forecast
11.1. Regional Outlook
11.2. Peer-to-Peer Lending Market Size (US$ Bn) Analysis and Forecast (2018 - 2031)
11.2.1. By Type
11.2.2. By End-user
11.3. Peer-to-Peer Lending Market Size (US$ Bn) Forecast, by Country & Sub-region, 2018 - 2031
11.3.1. China
11.3.2. India
11.3.3. Japan
11.3.4. ASEAN
11.3.5. Rest of Asia Pacific
12. Middle East & Africa Peer-to-Peer Lending Market Analysis and Forecast
12.1. Regional Outlook
12.2. Peer-to-Peer Lending Market Size (US$ Bn) Analysis and Forecast (2018 - 2031)
12.2.1. By Type
12.2.2. By End-user
12.3. Peer-to-Peer Lending Market Size (US$ Bn) Forecast, by Country & Sub-region, 2018 - 2031
12.3.1. Saudi Arabia
12.3.2. United Arab Emirates
12.3.3. South Africa
12.3.4. Rest of Middle East & Africa
13. South America Peer-to-Peer Lending Market Analysis and Forecast
13.1. Regional Outlook
13.2. Peer-to-Peer Lending Market Size (US$ Bn) Analysis and Forecast (2018 - 2031)
13.2.1. By Type
13.2.2. By End-user
13.3. Peer-to-Peer Lending Market Size (US$ Bn) Forecast, by Country & Sub-region, 2018 - 2031
13.3.1. Brazil
13.3.2. Argentina
13.3.3. Rest of South America
14. Competition Landscape
14.1. Market Competition Matrix, by Leading Players
14.2. Market Revenue Share Analysis (%), by Leading Players (2021)
14.3. Competitive Scenario
14.3.1. List of Emerging, Prominent and Leading Players
14.3.2. Major Mergers & Acquisitions, Expansions, Partnership, Contacts, Deals, etc.
15. Company Profiles
15.1. Estateguru
15.1.1. Business Overview
15.1.2. Company Revenue
15.1.3. Product Portfolio
15.1.4. Geographic Footprint
15.1.5. Strategic Partnership
15.1.6. Merger & Acquisition
15.1.7. Business Expansion
15.1.8. New Product Launch
15.1.9. Innovation etc.
15.2. Funding Circle Limited
15.2.1. Business Overview
15.2.2. Company Revenue
15.2.3. Product Portfolio
15.2.4. Geographic Footprint
15.2.5. Strategic Partnership
15.2.6. Merger & Acquisition
15.2.7. Business Expansion
15.2.8. New Product Launch
15.2.9. Innovation etc.
15.3. Kabbage Inc.
15.3.1. Business Overview
15.3.2. Company Revenue
15.3.3. Product Portfolio
15.3.4. Geographic Footprint
15.3.5. Strategic Partnership
15.3.6. Merger & Acquisition
15.3.7. Business Expansion
15.3.8. New Product Launch
15.3.9. Innovation etc.
15.4. LendingTree, LLC
15.4.1. Business Overview
15.4.2. Company Revenue
15.4.3. Product Portfolio
15.4.4. Geographic Footprint
15.4.5. Strategic Partnership
15.4.6. Merger & Acquisition
15.4.7. Business Expansion
15.4.8. New Product Launch
15.4.9. Innovation etc.
15.5. Lendwise
15.5.1. Business Overview
15.5.2. Company Revenue
15.5.3. Product Portfolio
15.5.4. Geographic Footprint
15.5.5. Strategic Partnership
15.5.6. Merger & Acquisition
15.5.7. Business Expansion
15.5.8. New Product Launch
15.5.9. Innovation etc.
15.6. Lendbox
15.6.1. Business Overview
15.6.2. Company Revenue
15.6.3. Product Portfolio
15.6.4. Geographic Footprint
15.6.5. Strategic Partnership
15.6.6. Merger & Acquisition
15.6.7. Business Expansion
15.6.8. New Product Launch
15.6.9. Innovation etc.
15.7. Max Crowdfund B.V.
15.7.1. Business Overview
15.7.2. Company Revenue
15.7.3. Product Portfolio
15.7.4. Geographic Footprint
15.7.5. Strategic Partnership
15.7.6. Merger & Acquisition
15.7.7. Business Expansion
15.7.8. New Product Launch
15.7.9. Innovation etc.
15.8. Peerform
15.8.1. Business Overview
15.8.2. Company Revenue
15.8.3. Product Portfolio
15.8.4. Geographic Footprint
15.8.5. Strategic Partnership
15.8.6. Merger & Acquisition
15.8.7. Business Expansion
15.8.8. New Product Launch
15.8.9. Innovation etc.
15.9. Prosper Marketplace Inc.
15.9.1. Business Overview
15.9.2. Company Revenue
15.9.3. Product Portfolio
15.9.4. Geographic Footprint
15.9.5. Strategic Partnership
15.9.6. Merger & Acquisition
15.9.7. Business Expansion
15.9.8. New Product Launch
15.9.9. Innovation etc.
15.10. PYT FUNDS
15.10.1. Business Overview
15.10.2. Company Revenue
15.10.3. Product Portfolio
15.10.4. Geographic Footprint
15.10.5. Strategic Partnership
15.10.6. Merger & Acquisition
15.10.7. Business Expansion
15.10.8. New Product Launch
15.10.9. Innovation etc.
15.11. RateSetter
15.11.1. Business Overview
15.11.2. Company Revenue
15.11.3. Product Portfolio
15.11.4. Geographic Footprint
15.11.5. Strategic Partnership
15.11.6. Merger & Acquisition
15.11.7. Business Expansion
15.11.8. New Product Launch
15.11.9. Innovation etc.
15.12. Rendity GmbH
15.12.1. Business Overview
15.12.2. Company Revenue
15.12.3. Product Portfolio
15.12.4. Geographic Footprint
15.12.5. Strategic Partnership
15.12.6. Merger & Acquisition
15.12.7. Business Expansion
15.12.8. New Product Launch
15.12.9. Innovation etc.
15.13. Upstart Network Inc.
15.13.1. Business Overview
15.13.2. Company Revenue
15.13.3. Product Portfolio
15.13.4. Geographic Footprint
15.13.5. Strategic Partnership
15.13.6. Merger & Acquisition
15.13.7. Business Expansion
15.13.8. New Product Launch
15.13.9. Innovation etc.
15.14. Others
15.14.1. Business Overview
15.14.2. Company Revenue
15.14.3. Product Portfolio
15.14.4. Geographic Footprint
15.14.5. Strategic Partnership
15.14.6. Merger & Acquisition
15.14.7. Business Expansion
15.14.8. New Product Launch
15.14.9. Innovation etc.
16. Key Takeaways
List of Tables
Table 1: Acronyms Used in Peer-to-Peer Lending Market
Table 2: North America Peer-to-Peer Lending Market Revenue Analysis, by Country, 2022 - 2031 (US$ Bn)
Table 3: Europe Peer-to-Peer Lending Market Revenue Analysis, by Country, 2022 - 2031 (US$ Bn)
Table 4: Asia Pacific Peer-to-Peer Lending Market Revenue Analysis, by Country, 2022 - 2031 (US$ Bn)
Table 5: Middle East & Africa Peer-to-Peer Lending Market Revenue Analysis, by Country, 2022 and 2031 (US$ Bn)
Table 6: South America Peer-to-Peer Lending Market Revenue Analysis, by Country, 2022 - 2031 (US$ Bn)
Table 7: Forecast Factors: Relevance and Impact
Table 8: Global Peer-to-Peer Lending Market Value (US$ Bn) Forecast, by Type, 2018 – 2031
Table 9: Global Peer-to-Peer Lending Market Value (US$ Bn) Forecast, by End-user, 2018 – 2031
Table 10: Global Peer-to-Peer Lending Market Volume (US$ Bn) Forecast, by Region, 2018 – 2031
Table 11: North America Peer-to-Peer Lending Market Value (US$ Bn) Forecast, by Type, 2018 – 2031
Table 12: North America Peer-to-Peer Lending Market Value (US$ Bn) Forecast, by End-user, 2018 – 2031
Table 13: North America Peer-to-Peer Lending Market Value (US$ Bn) Forecast, by Country, 2018 - 2031
Table 14: U.S. Peer-to-Peer Lending Market Revenue CAGR Breakdown (%), by Growth Term
Table 15: Canada Peer-to-Peer Lending Market Revenue CAGR Breakdown (%), by Growth Term
Table 16: Mexico Peer-to-Peer Lending Market Revenue CAGR Breakdown (%), by Growth Term
Table 17: Europe Peer-to-Peer Lending Market Value (US$ Bn) Forecast, by Type, 2018 – 2031
Table 18: Europe Peer-to-Peer Lending Market Value (US$ Bn) Forecast, by End-user, 2018 – 2031
Table 19: Europe Peer-to-Peer Lending Market Value (US$ Bn) Forecast, by Country, 2018 - 2031
Table 20: Germany Peer-to-Peer Lending Market Revenue CAGR Breakdown (%), by Growth Term
Table 21: U.K. Peer-to-Peer Lending Market Revenue CAGR Breakdown (%), by Growth Term
Table 22: France Peer-to-Peer Lending Market Revenue CAGR Breakdown (%), by Growth Term
Table 23: Spain Peer-to-Peer Lending Market Revenue CAGR Breakdown (%), by Growth Term
Table 24: Italy Peer-to-Peer Lending Market Revenue CAGR Breakdown (%), by Growth Term
Table 25: Asia Pacific Peer-to-Peer Lending Market Value (US$ Bn) Forecast, by Type, 2018 – 2031
Table 26: Asia Pacific Peer-to-Peer Lending Market Value (US$ Bn) Forecast, by End-user, 2018 – 2031
Table 27: Asia Pacific Peer-to-Peer Lending Market Value (US$ Bn) Forecast, by Country, 2018 - 2031
Table 28: China Peer-to-Peer Lending Market Revenue CAGR Breakdown (%), by Growth Term
Table 29: India Peer-to-Peer Lending Market Revenue CAGR Breakdown (%), by Growth Term
Table 30: Japan Peer-to-Peer Lending Market Revenue CAGR Breakdown (%), by Growth Term
Table 31: ASEAN Peer-to-Peer Lending Market Revenue CAGR Breakdown (%), by Growth Term
Table 32: Middle East & Africa Peer-to-Peer Lending Market Value (US$ Bn) Forecast, by Type, 2018 – 2031
Table 33: Middle East & Africa Peer-to-Peer Lending Market Value (US$ Bn) Forecast, by End-user, 2018 – 2031
Table 34: Middle East & Africa Peer-to-Peer Lending Market Value (US$ Bn) Forecast, by Country, 2018 - 2031
Table 35: Saudi Arabia Peer-to-Peer Lending Market Revenue CAGR Breakdown (%), by Growth Term
Table 36: United Arab Emirates Peer-to-Peer Lending Market Revenue CAGR Breakdown (%), by Growth Term
Table 37: South Africa Peer-to-Peer Lending Market Revenue CAGR Breakdown (%), by Growth Term
Table 38: South America Peer-to-Peer Lending Market Value (US$ Bn) Forecast, by Type, 2018 – 2031
Table 39: South America Peer-to-Peer Lending Market Value (US$ Bn) Forecast, by End-user, 2018 – 2031
Table 40: South America Peer-to-Peer Lending Market Value (US$ Bn) Forecast, by Country, 2018 - 2031
Table 41: Brazil Emirates Peer-to-Peer Lending Market Revenue CAGR Breakdown (%), by Growth Term
Table 42: Argentina Peer-to-Peer Lending Market Revenue CAGR Breakdown (%), by Growth Term
Table 43: Mergers & Acquisitions, Expansions, Product Launch, etc. (1/2)
Table 44: Mergers & Acquisitions, Expansions, Product Launch, etc. (2/2)
List of Figures
Figure 1: Global Peer-to-Peer Lending Market Size (US$ Bn) Forecast, 2018–2031
Figure 2: Global Peer-to-Peer Lending Market Revenue (US$ Bn) Opportunity Assessment, by Region, 2022E
Figure 3: Top Segment Analysis of Peer-to-Peer Lending Market
Figure 4: Global Peer-to-Peer Lending Market Revenue (US$ Bn) Opportunity Assessment, by Region, 2031F
Figure 5: Global Peer-to-Peer Lending Market Attractiveness Assessment, by Type
Figure 6: Global Peer-to-Peer Lending Market Attractiveness Assessment, by End-user
Figure 7: Global Peer-to-Peer Lending Market Attractiveness Assessment, by Region
Figure 8: Global Peer-to-Peer Lending Market Revenue (US$ Bn) Historic Trends, 2016 - 2021
Figure 9: Global Peer-to-Peer Lending Market Revenue Opportunity (US$ Bn) Historic Trends, 2016 - 2021
Figure 10: Absolute Dollar Opportunity
Figure 11: Global Peer-to-Peer Lending Market Value Share Analysis, by Type, 2022
Figure 12: Global Peer-to-Peer Lending Market Value Share Analysis, by Type, 2031
Figure 13: Global Peer-to-Peer Lending Market Absolute Opportunity (US$ Bn), by Personal Loan, 2022 – 2031
Figure 14: Global Peer-to-Peer Lending Market Absolute Opportunity (US$ Bn), by Business Loan, 2022 – 2031
Figure 15: Global Peer-to-Peer Lending Market Value Share Analysis, by End-user, 2022
Figure 16: Global Peer-to-Peer Lending Market Value Share Analysis, by End-user, 2031
Figure 17: Global Peer-to-Peer Lending Market Absolute Opportunity (US$ Bn), by Consumer, 2022 – 2031
Figure 18: Global Peer-to-Peer Lending Market Absolute Opportunity (US$ Bn), by Small Business, 2022 – 2031
Figure 19: Global Peer-to-Peer Lending Market Absolute Opportunity (US$ Bn), by Student, 2022 – 2031
Figure 20: Global Peer-to-Peer Lending Market Absolute Opportunity (US$ Bn), by Real Estate, 2022 – 2031
Figure 21: Global Peer-to-Peer Lending Market Opportunity (US$ Bn), by Region
Figure 22: Global Peer-to-Peer Lending Market Opportunity Share (%), by Region, 2022–2031
Figure 23: Global Peer-to-Peer Lending Market Size (US$ Bn), by Region, 2022 & 2031
Figure 24: Global Peer-to-Peer Lending Market Value Share Analysis, by Region, 2022
Figure 25: Global Peer-to-Peer Lending Market Value Share Analysis, by Region, 2031
Figure 26: North America Peer-to-Peer Lending Market Absolute Opportunity (US$ Bn), 2022 – 2031
Figure 27: Europe Peer-to-Peer Lending Market Absolute Opportunity (US$ Bn), 2022 – 2031
Figure 28: Asia Pacific Peer-to-Peer Lending Market Absolute Opportunity (US$ Bn), 2022 – 2031
Figure 29: Middle East & Africa Peer-to-Peer Lending Market Absolute Opportunity (US$ Bn), 2022 – 2031
Figure 30: South America Peer-to-Peer Lending Market Absolute Opportunity (US$ Bn), 2022 – 2031
Figure 31: North America Absolute Dollar Opportunity
Figure 32: North America Peer-to-Peer Lending Market Revenue Opportunity Share, by Type
Figure 33: North America Peer-to-Peer Lending Market Revenue Opportunity Share, by End-user
Figure 34: North America Peer-to-Peer Lending Market Revenue Opportunity Share, by Country
Figure 35: North America Peer-to-Peer Lending Market Value Share Analysis, by Type, 2031
Figure 36: North America Peer-to-Peer Lending Market Absolute Opportunity (US$ Bn), by Personal Loan, 2022 – 2031
Figure 37: North America Peer-to-Peer Lending Market Absolute Opportunity (US$ Bn), by Business Loan, 2022 – 2031
Figure 38: North America Peer-to-Peer Lending Market Value Share Analysis, by End-user, 2022
Figure 39: North America Peer-to-Peer Lending Market Value Share Analysis, by End-user, 2031
Figure 40: North America Peer-to-Peer Lending Market Absolute Opportunity (US$ Bn), by Consumer, 2022 – 2031
Figure 41: North America Peer-to-Peer Lending Market Absolute Opportunity (US$ Bn), by Small Business, 2022 – 2031
Figure 42: North America Peer-to-Peer Lending Market Absolute Opportunity (US$ Bn), by Student, 2022 – 2031
Figure 43: North America Peer-to-Peer Lending Market Absolute Opportunity (US$ Bn), by Real Estate, 2022 – 2031
Figure 44: North America Peer-to-Peer Lending Market Value Share Analysis, by Country, 2022
Figure 45: North America Peer-to-Peer Lending Market Value Share Analysis, by Country, 2031
Figure 46: U.S. Peer-to-Peer Lending Market Opportunity Growth Analysis (US$ Bn) Forecast, 2022 – 2031
Figure 47: Canada Peer-to-Peer Lending Market Opportunity Growth Analysis (US$ Bn) Forecast, 2022 – 2031
Figure 48: Mexico Peer-to-Peer Lending Market Opportunity Growth Analysis (US$ Bn) Forecast, 2022 – 2031
Figure 49: Europe Absolute Dollar Opportunity
Figure 50: Europe Peer-to-Peer Lending Market Revenue Opportunity Share, by Type
Figure 51: Europe Peer-to-Peer Lending Market Revenue Opportunity Share, by End-user
Figure 52: Europe Peer-to-Peer Lending Market Revenue Opportunity Share, by Country
Figure 53: Europe Peer-to-Peer Lending Market Value Share Analysis, by Type, 2022
Figure 54: Europe Peer-to-Peer Lending Market Value Share Analysis, by Type, 2031
Figure 55: Europe Peer-to-Peer Lending Market Absolute Opportunity (US$ Bn), by Personal Loan, 2022 – 2031
Figure 56: Europe Peer-to-Peer Lending Market Absolute Opportunity (US$ Bn), by Business Loan, 2022 – 2031
Figure 57: Europe Peer-to-Peer Lending Market Value Share Analysis, by End-user, 2022
Figure 58: Europe Peer-to-Peer Lending Market Value Share Analysis, by End-user, 2031
Figure 59: Europe Peer-to-Peer Lending Market Absolute Opportunity (US$ Bn), by Consumer, 2022 – 2031
Figure 60: Europe Peer-to-Peer Lending Market Absolute Opportunity (US$ Bn), by Small Business, 2022 – 2031
Figure 61: Europe Peer-to-Peer Lending Market Absolute Opportunity (US$ Bn), by Student, 2022 – 2031
Figure 62: Europe Peer-to-Peer Lending Market Absolute Opportunity (US$ Bn), by Real Estate, 2022 – 2031
Figure 63: Europe Peer-to-Peer Lending Market Value Share Analysis, by Country, 2022
Figure 64: Europe Peer-to-Peer Lending Market Value Share Analysis, by Country, 2031
Figure 65: Germany Peer-to-Peer Lending Market Opportunity Growth Analysis (US$ Bn) Forecast, 2022 – 2031
Figure 66: U.K. Peer-to-Peer Lending Market Opportunity Growth Analysis (US$ Bn) Forecast, 2022 – 2031
Figure 67: France Peer-to-Peer Lending Market Opportunity Growth Analysis (US$ Bn) Forecast, 2022 – 2031
Figure 68: Spain Peer-to-Peer Lending Market Opportunity Growth Analysis (US$ Bn) Forecast, 2022 – 2031
Figure 69: Italy Peer-to-Peer Lending Market Opportunity Growth Analysis (US$ Bn) Forecast, 2022 – 2031
Figure 70: Asia Pacific Absolute Dollar Opportunity
Figure 71: Asia Pacific Peer-to-Peer Lending Market Revenue Opportunity Share, by Type
Figure 72: Asia Pacific Peer-to-Peer Lending Market Revenue Opportunity Share, by End-user
Figure 73: Asia Pacific Peer-to-Peer Lending Market Revenue Opportunity Share, by Country
Figure 74: Asia Pacific Peer-to-Peer Lending Market Value Share Analysis, by Type, 2022
Figure 75: Asia Pacific Peer-to-Peer Lending Market Value Share Analysis, by Type, 2031
Figure 76: Asia Pacific Peer-to-Peer Lending Market Absolute Opportunity (US$ Bn), by Personal Loan, 2022 – 2031
Figure 77: Asia Pacific Peer-to-Peer Lending Market Absolute Opportunity (US$ Bn), by Business Loan, 2022 – 2031
Figure 78: Asia Pacific Peer-to-Peer Lending Market Value Share Analysis, by End-user, 2022
Figure 79: Asia Pacific Peer-to-Peer Lending Market Value Share Analysis, by End-user, 2031
Figure 80: Asia Pacific Peer-to-Peer Lending Market Absolute Opportunity (US$ Bn), by Consumer, 2022 – 2031
Figure 81: Asia Pacific Peer-to-Peer Lending Market Absolute Opportunity (US$ Bn), by Small Business, 2022 – 2031
Figure 82: Asia Pacific Peer-to-Peer Lending Market Absolute Opportunity (US$ Bn), by Student, 2022 – 2031
Figure 83: Asia Pacific Peer-to-Peer Lending Market Absolute Opportunity (US$ Bn), by Real Estate, 2022 – 2031
Figure 84: Asia Pacific Peer-to-Peer Lending Market Value Share Analysis, by Country, 2022
Figure 85: Asia Pacific Peer-to-Peer Lending Market Value Share Analysis, by Country, 2031
Figure 86: China Peer-to-Peer Lending Market Opportunity Growth Analysis (US$ Bn) Forecast, 2022 – 2031
Figure 87: India Peer-to-Peer Lending Market Opportunity Growth Analysis (US$ Bn) Forecast, 2022 – 2031
Figure 88: Japan Peer-to-Peer Lending Market Opportunity Growth Analysis (US$ Bn) Forecast, 2022 – 2031
Figure 89: ASEAN Peer-to-Peer Lending Market Opportunity Growth Analysis (US$ Bn) Forecast, 2022 – 2031
Figure 90: Middle East & Africa Absolute Dollar Opportunity
Figure 91: Middle East & Africa Peer-to-Peer Lending Market Revenue Opportunity Share, by Type
Figure 92: Middle East & Africa Peer-to-Peer Lending Market Revenue Opportunity Share, by End-user
Figure 93: Middle East & Africa Peer-to-Peer Lending Market Revenue Opportunity Share, by Country
Figure 94: Middle East & Africa Peer-to-Peer Lending Market Value Share Analysis, by Type, 2022
Figure 95: Middle East & Africa Peer-to-Peer Lending Market Value Share Analysis, by Type, 2031
Figure 96: Middle East & Africa Peer-to-Peer Lending Market Absolute Opportunity (US$ Bn), by Personal Loan, 2022 – 2031
Figure 97: Middle East & Africa Peer-to-Peer Lending Market Absolute Opportunity (US$ Bn), by Business Loan, 2022 – 2031
Figure 98: North Middle East & Africa Peer-to-Peer Lending Market Value Share Analysis, by End-user, 2022
Figure 99: Middle East & Africa Peer-to-Peer Lending Market Value Share Analysis, by End-user, 2031
Figure 100: Middle East & Africa Peer-to-Peer Lending Market Absolute Opportunity (US$ Bn), by Consumer, 2022 – 2031
Figure 101: Middle East & Africa Peer-to-Peer Lending Market Absolute Opportunity (US$ Bn), by Small Business, 2022 – 2031
Figure 102: Middle East & Africa Peer-to-Peer Lending Market Absolute Opportunity (US$ Bn), by Student, 2022 – 2031
Figure 103: Middle East & Africa Peer-to-Peer Lending Market Absolute Opportunity (US$ Bn), by Real Estate, 2022 – 2031
Figure 104: Middle East & Africa Peer-to-Peer Lending Market Value Share Analysis, by Country, 2022
Figure 105: Middle East & Africa Peer-to-Peer Lending Market Value Share Analysis, by Country, 2031
Figure 106: Saudi Arabia Peer-to-Peer Lending Market Opportunity Growth Analysis (US$ Bn) Forecast, 2022 – 2031
Figure 107: United Arab Emirates Peer-to-Peer Lending Market Opportunity Growth Analysis (US$ Bn) Forecast, 2022 – 2031
Figure 108: South Africa Peer-to-Peer Lending Market Opportunity Growth Analysis (US$ Bn) Forecast, 2022 – 2031
Figure 109: South America Absolute Dollar Opportunity
Figure 110: South America Peer-to-Peer Lending Market Revenue Opportunity Share, by Type
Figure 111: South America Peer-to-Peer Lending Market Revenue Opportunity Share, by End-user
Figure 112: South America Peer-to-Peer Lending Market Revenue Opportunity Share, by Country
Figure 113: South America Peer-to-Peer Lending Market Value Share Analysis, by Type, 2022
Figure 114: South America Peer-to-Peer Lending Market Value Share Analysis, by Type, 2031
Figure 115: South America Peer-to-Peer Lending Market Absolute Opportunity (US$ Bn), by Personal Loan, 2022 – 2031
Figure 116: South America Peer-to-Peer Lending Market Absolute Opportunity (US$ Bn), by Business Loan, 2022 – 2031
Figure 117: South America Peer-to-Peer Lending Market Value Share Analysis, by End-user, 2022
Figure 118: South America Peer-to-Peer Lending Market Value Share Analysis, by End-user, 2031
Figure 119: South America Peer-to-Peer Lending Market Absolute Opportunity (US$ Bn), by Consumer, 2022 – 2031
Figure 120: South America Peer-to-Peer Lending Market Absolute Opportunity (US$ Bn), by Small Business, 2022 – 2031
Figure 121: South America Peer-to-Peer Lending Market Absolute Opportunity (US$ Bn), by Student, 2022 – 2031
Figure 122: South America Peer-to-Peer Lending Market Absolute Opportunity (US$ Bn), by Real Estate, 2022 – 2031
Figure 123: South America Peer-to-Peer Lending Market Value Share Analysis, by Country, 2022
Figure 124: South America Peer-to-Peer Lending Market Value Share Analysis, by Country, 2031
Figure 125: Brazil Peer-to-Peer Lending Market Opportunity Growth Analysis (US$ Bn) Forecast, 2022 – 2031
Figure 126: Argentina Peer-to-Peer Lending Market Opportunity Growth Analysis (US$ Bn) Forecast, 2022 – 2031
Copyright © Transparency Market Research, Inc. All Rights reserved
Trust Online

Peer-to-Peer Lending Market