
Reports
Reports
Petrochemical-derived products such as carbon black, solvents, resins, mineral oils, and intermediates are used as key raw materials in the production of flexographic inks. Flexographic printing is an important printing process used in flexible package printing. Its popularity can be attributed to its high versatility in terms of printing on a wide range of substrates. Flexographic inks exhibit high adherence to the substrate surface and offer excellent printing quality, irrespective of the material of the substrate.
Packaging is considered a highly important aspect of marketing, which influences the consumer’s purchasing decision. The packaging industry is a major consumer of printing inks. Growth of the food & beverages sector and increased demand for flexible packaging from the health care sector are expected to boost the demand for flexographic inks in the next few years.
The trend of e-commerce is growing at a significant rate across the globe. It is hampering the publication & commercial printing industry. Thus, a substantial decrease in paper-based communication is estimated to restrict the global flexographic inks market during the forecast period. The trend of e-commerce comprises e-books, event tickets, sporting goods, toys, and hotel and airline reservations. Especially, rising adoption of e-books is anticipated to hamper the global flexographic inks market during the forecast period.
Water-based Flexographic Inks the Most Commonly Used Inks
In terms of type, the flexographic inks market has been segmented into solvent-based inks, water-based inks, and UV-cured inks. In 2017, the water-based inks segment held the leading share of the global market. Water-based flexographic inks contain water as its major constituent along with glycol. These inks are more eco-friendly than solvent-based flexographic inks. Globally, the demand for water-based flexographic inks is rising due to stringent regulations related to the environment.
On the other hand, UV-cured inks do not contain any volatile compounds and, therefore, they are used in various printing applications such as gravure, inkjet, and flexography printing. They offer several advantages over the conventional printing inks. Demand for VOC-free printing inks is gaining momentum, due to increased number of regulations imposed on the usage of inks emitting VOCs. Furthermore, strict monitoring of usage of toxic chemicals, which possess high vapor pressure at room temperature, and government investments in the renewable energy sector are anticipated to drive the demand for UV-cured flexographic inks in the next few years.
In terms of application, the flexographic inks market has been classified into packaging and others. The others segment comprises newspapers, magazines, and journals. The packaging segment has been sub-segregated into flexible packaging, corrugated containers, folding cartons, tags & labels, and others. In 2017, the packaging segment held the leading share of the global market. The packaging industry is a major consumer of printing inks. Rise in the demand for flexible packaging in the food & beverages industry led by lower weight and better aesthetic packaging is anticipated to fuel the packaging segment of the global flexographic inks market during the forecast period. This, in turn, is estimated to propel the global market for flexographic inks in the near future.
In 2017, the flexible packaging sub-segment dominated the packaging segment of the global flexographic inks market, followed by the corrugated containers sub-segment. Flexographic inks are most commonly used in applications such as corrugated containers and flexible packaging, with the latter being largely employed in the food & beverages industry. Flexographic inks are also used in cartons, folds, labels, and newspapers.
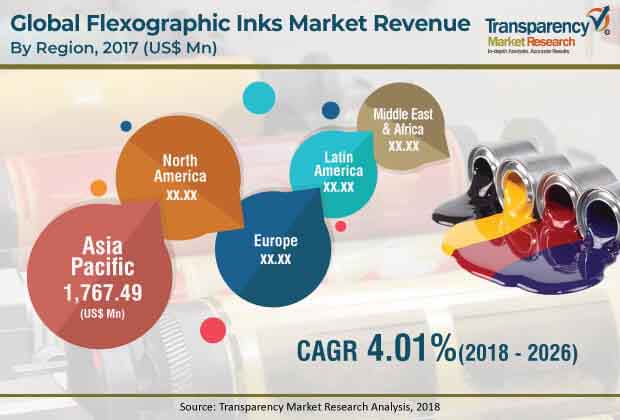
Asia Pacific a Prominent Consumer of Flexographic Inks
In terms of region, the global flexographic inks market has been classified into North America, Europe, Asia Pacific, Middle East & Africa, and Latin America. In 2017, Asia Pacific accounted for a major share of the global market. Rise in the demand for packaging in food & beverages and personal care industries to achieve better aesthetic packaging in Asia Pacific is expected to boost the packaging segment of the market in the region during the forecast period. China, India, and Japan collectively constitute a major share of the flexographic inks market in Asia Pacific. The market in the region is expected to expand at a more rapid rate than the market in other regions. Both North America and Europe are actively investing in the development and manufacture of VOC-free inks to comply with government regulations. Thus, the demand for UV-cured inks in these regions is expected to increase substantially in the next few years.
In terms of resin, the global flexographic inks market has been segregated into nitrocellulose, polyamide, polyurethane, acrylic, and others. Out of these, polyurethane is the most commonly used resin, as polyurethane-based flexographic inks can be used with plastic packaging such as flexible packaging, folding cartons, tags, and labels. As plastic packaging is widely used, so is polyurethane as a resin. This trend is expected to continue during the forecast period.
Flexographic Inks Market Moderately Consolidated in Nature
The global flexographic inks market is moderately consolidated, with a few multinational companies holding a key market share. Key manufacturers of flexographic inks include Altana AG, Zeller+Gmelin GmbH & Co. KG, Flint Group, Sun Chemical Corporation, and INX International Ink Co.
1. Preface
1.1. Report Scope
1.2. Market Segmentation
1.3. Research Highlights
2. Assumptions and Research Methodology
2.1. Assumptions and Acronyms Used
2.2. Research Methodology
3. Executive Summary
3.1. Global Flexographic Inks Market Volume (Kilo Tons) and Value (US$ Mn), 2017–2026
3.2. Market Snapshot
4. Market Overview
4.1. Introduction
4.2. Market Indicators
4.3. Driver 1 – Growing Packaging Industry
4.4. Driver 2 – Rising Demand for UV-cured Printing Inks
4.5. Restraint
4.6. Opportunity Analysis
4.7. Opportunities
4.8. Porter's Five Forces Analysis
4.9. Regulatory Scenario
4.10. Value Chain Analysis
5. Global Flexographic Inks Market Analysis
5.1. Global Flexographic Inks Market Overview
5.2. Key Findings
6. Global Flexographic Inks Market Analysis, by Type
6.1. Definitions
6.2. Global Flexographic Inks Market Value Share Analysis, by Type
6.3. Global Flexographic Inks Market Analysis & Forecast, by Type, 2017–2026
6.3.1. Water-based
6.3.2. Solvent-based
6.3.3. UV-cured
6.4. Global Flexographic Inks Market Attractiveness Analysis, by Type
7. Global Flexographic Inks Market Analysis, by Application
7.1. Definitions
7.2. Global Flexographic Inks Market Value Share Analysis, by Application
7.3. Global Flexographic Inks Market Analysis & Forecast, by Application, 2017–2026
7.3.1. Packaging
7.3.1.1. Flexible Packaging
7.3.1.2. Corrugated Containers
7.3.1.3. Folding Cartons
7.3.1.4. Tags & Labels
7.3.1.5. Others
7.3.2. Others
7.4. Global Flexographic Inks Market Attractiveness Analysis, by Application
8. Global Flexographic Inks Market Analysis, by Resin
8.1. Definitions
8.2. Global Flexographic Inks Market Value Share Analysis, by Resin
8.3. Global Flexographic Inks Market Analysis & Forecast, by Resin, 2017–2026
8.3.1. Nitrocellulose
8.3.2. Polyamide
8.3.3. Polyurethane
8.3.4. Acrylic
8.3.5. Others
8.4. Global Flexographic Inks Market Attractiveness Analysis, by Resin
9. Global Flexographic Inks Market Analysis, by Region
9.1. Global Flexographic Inks Market Value Share Analysis, by Region
9.2. Global Flexographic Inks Market Analysis & Forecast, by Region, 2017–2026
9.2.1. North America
9.2.2. Latin America
9.2.3. Europe
9.2.4. Asia Pacific
9.2.5. Middle East & Africa
9.3. Global Flexographic Inks Market Attractiveness Analysis, by Region
10. North America Flexographic Inks Market Analysis
10.1. North America Flexographic Inks Market Overview
10.2. North America Flexographic Inks Market Volume and Value Share Analysis, by Type, Application, Resin, and Country
10.3. North America Flexographic Inks Market Volume (Kilo Tons) & Value (US$ Mn) Forecast, by Type, 2017–2026
10.4. North America Flexographic Inks Market Volume (Kilo Tons) & Value (US$ Mn) Forecast, by Resin, 2017–2026
10.5. North America Flexographic Inks Market Volume (Kilo Tons) & Value (US$ Mn) Forecast, by Application, 2017–2026
10.6. North America Flexographic Inks Market Volume (Kilo Tons) & Value (US$ Mn) Forecast, by Country, 2017–2026
10.6.1. U.S.
10.6.2. Canada
10.7. U.S. Flexographic Inks Market Forecast, by Type
10.8. U.S. Flexographic Inks Market Forecast, by Resin
10.9. U.S. Flexographic Inks Market Forecast, by Application
10.10. Canada Flexographic Inks Market Forecast, by Type
10.11. Canada Flexographic Inks Market Forecast, by Resin
10.12. Canada Flexographic Inks Market Forecast, by Application
10.13. North America Flexographic Inks Market Attractiveness Analysis
11. Latin America Flexographic Inks Market Analysis
11.1. Latin America Flexographic Inks Market Overview
11.2. Latin America Flexographic Inks Market Volume and Value Share Analysis, by Type, Resin, Application, and Country and Sub-region
11.3. Latin America Flexographic Inks Market Volume (Kilo Tons) & Value (US$ Mn) Forecast, by Type, 2017–2026
11.4. Latin America Flexographic Inks Market Volume (Kilo Tons) & Value (US$ Mn) Forecast, by Resin, 2017–2026
11.5. Latin America Flexographic Inks Market Volume (Kilo Tons) & Value (US$ Mn) Forecast, by Application, 2017–2026
11.6. Latin America Flexographic Inks Market Volume (Kilo Tons) & Value (US$ Mn) Forecast, by Country and Sub-region, 2017–2026
11.6.1. Brazil
11.6.2. Mexico
11.6.3. Rest of Latin America
11.7. Brazil Flexographic Inks Market Forecast, by Type
11.8. Brazil Flexographic Inks Market Forecast, by Resin
11.9. Brazil Flexographic Inks Market Forecast, by Application
11.10. Mexico Flexographic Inks Market Forecast, by Type
11.11. Mexico Flexographic Inks Market Forecast, by Resin
11.12. Mexico Flexographic Inks Market Forecast, by Application
11.13. Rest of Latin America Flexographic Inks Market Forecast, by Type
11.14. Rest of Latin America Flexographic Inks Market Forecast, by Resin
11.15. Rest of Latin America Flexographic Inks Market Forecast, by Application
11.16. Latin America Flexographic Inks Market Attractiveness Analysis
12. Europe Flexographic Inks Market Analysis
12.1. Europe Flexographic Inks Market Overview
12.2. Europe Flexographic Inks Market Volume and Value Share Analysis, by Type, Resin, Application, and Country and Sub-region
12.3. Europe Flexographic Inks Market Volume (Kilo Tons) & Value (US$ Mn) Forecast, by Type, 2017–2026
12.4. Europe Flexographic Inks Market Volume (Kilo Tons) & Value (US$ Mn) Forecast, by Resin, 2017–2026
12.5. Europe Flexographic Inks Market Volume (Kilo Tons) & Value (US$ Mn) Forecast, by Application, 2017–2026
12.6. Europe Flexographic Inks Market Volume (Kilo Tons) & Value (US$ Mn) Forecast, by Country and Sub-region, 2017–2026
12.6.1. Germany
12.6.2. France
12.6.3. U.K.
12.6.4. Italy
12.6.5. Spain
12.6.6. Russia & CIS
12.6.7. Rest of Europe
12.7. Germany Flexographic Inks Market Forecast, by Type
12.8. Germany Flexographic Inks Market Forecast, by Resin
12.9. Germany Flexographic Inks Market Forecast, by Application
12.10. France Flexographic Inks Market Forecast, by Type
12.11. France Flexographic Inks Market Forecast, by Resin
12.12. France Flexographic Inks Market Forecast, by Application
12.13. U.K. Flexographic Inks Market Forecast, by Type
12.14. U.K. Flexographic Inks Market Forecast, by Resin
12.15. U.K. Flexographic Inks Market Forecast, by Application
12.16. Italy Flexographic Inks Market Forecast, by Type
12.17. Italy Flexographic Inks Market Forecast, by Resin
12.18. Italy Flexographic Inks Market Forecast, by Application
12.19. Spain Flexographic Inks Market Forecast, by Type
12.20. Spain Flexographic Inks Market Forecast, by Resin
12.21. Spain Flexographic Inks Market Forecast, by Application
12.22. Russia & CIS Flexographic Inks Market Forecast, by Type
12.23. Russia & CIS Flexographic Inks Market Forecast, by Resin
12.24. Russia & CIS Flexographic Inks Market Forecast, by Application
12.25. Rest of Europe Flexographic Inks Market Forecast, by Type
12.26. Rest of Europe Flexographic Inks Market Forecast, by Resin
12.27. Rest of Europe Flexographic Inks Market Forecast, by Application
12.28. Europe Flexographic Inks Market Attractiveness Analysis
13. Asia Pacific Flexographic Inks Market Analysis
13.1. Asia Pacific Flexographic Inks Market Overview
13.2. Asia Pacific Flexographic Inks Market Volume and Value Share Analysis, by Type, Resin, Application, and Country and Sub-region
13.3. Asia Pacific Flexographic Inks Market Volume (Kilo Tons) & Value (US$ Mn) Forecast, by Type, 2017–2026
13.4. Asia Pacific Flexographic Inks Market Volume (Kilo Tons) & Value (US$ Mn) Forecast, by Resin, 2017–2026
13.5. Asia Pacific Flexographic Inks Market Volume (Kilo Tons) & Value (US$ Mn) Forecast, by Application, 2017–2026
13.6. Asia Pacific Flexographic Inks Market Volume (Kilo Tons) & Value (US$ Mn) Forecast, by Country and Sub-region, 2017–2026
13.6.1. China
13.6.2. India
13.6.3. Japan
13.6.4. Australia
13.6.5. ASEAN
13.6.6. Rest of Asia Pacific
13.7. China Flexographic Inks Market Forecast, by Type
13.8. China Flexographic Inks Market Forecast, by Resin
13.9. China Flexographic Inks Market Forecast, by Application
13.10. India Flexographic Inks Market Forecast, by Type
13.11. India Flexographic Inks Market Forecast, by Resin
13.12. India Flexographic Inks Market Forecast, by Application
13.13. Japan Flexographic Inks Market Forecast, by Type
13.14. Japan Flexographic Inks Market Forecast, by Resin
13.15. Japan Flexographic Inks Market Forecast, by Application
13.16. Australia Flexographic Inks Market Forecast, by Type
13.17. Australia Flexographic Inks Market Forecast, by Resin
13.18. Australia Flexographic Inks Market Forecast, by Application
13.19. ASEAN Flexographic Inks Market Forecast, by Type
13.20. ASEAN Flexographic Inks Market Forecast, by Resin
13.21. ASEAN Flexographic Inks Market Forecast, by Application
13.22. Rest of Asia Pacific Flexographic Inks Market Forecast, by Type
13.23. Rest of Asia Pacific Flexographic Inks Market Forecast, by Resin
13.24. Rest of Asia Pacific Flexographic Inks Market Forecast, by Application
13.25. Asia Pacific Flexographic Inks Market Attractiveness Analysis
14. Middle East & Africa Flexographic Inks Market Analysis
14.1. Middle East & Africa Flexographic Inks Market Overview
14.2. Middle East & Africa Flexographic Inks Market Volume and Value Share Analysis, by Type, Resin, Application, Country and Sub-region
14.3. Middle East & Africa Flexographic Inks Market Volume (Kilo Tons) & Value (US$ Mn) Forecast, by Type, 2017–2026
14.4. Middle East & Africa Flexographic Inks Market Volume (Kilo Tons) & Value (US$ Mn) Forecast, by Resin, 2017–2026
14.5. Middle East & Africa Flexographic Inks Market Volume (Kilo Tons) & Value (US$ Mn) Forecast, by Application, 2017–2026
14.6. Middle East & Africa Flexographic Inks Market Volume (Kilo Tons) & Value (US$ Mn) Forecast, by Country and Sub-region, 2017–2026
14.6.1. South Africa
14.6.2. GCC
14.6.3. Rest of Middle East & Africa
14.7. South Africa Flexographic Inks Market Forecast, by Type
14.8. South Africa Flexographic Inks Market Forecast, by Resin
14.9. South Africa Flexographic Inks Market Forecast, by Application
14.10. GCC Flexographic Inks Market Forecast, by Type
14.11. GCC Flexographic Inks Market Forecast, by Resin
14.12. GCC Flexographic Inks Market Forecast, by Application
14.13. Rest of Middle East & Africa Flexographic Inks Market Forecast, by Type
14.14. Rest of Middle East & Africa Flexographic Inks Market Forecast, by Resin
14.15. Rest of Middle East & Africa Flexographic Inks Market Forecast, by Application
14.16. Middle East & Africa Flexographic Inks Market Attractiveness Analysis
15. Competition Landscape
15.1. Competition Matrix
15.2. Global Flexographic Inks Market Share Analysis, by Company (2017)
15.3. Sun Chemical Corporation
15.3.1. Company Details
15.3.2. Company Description
15.3.3. Business Overview
15.3.4. Financial Details
15.3.5. Strategic Overview
15.4. Flint Group
15.4.1. Company Details
15.4.2. Company Description
15.4.3. Business Overview
15.4.4. Recent Developments
15.4.5. Strategic Overview
15.5. Wikoff Color Corporation
15.5.1. Company Details
15.5.2. Company Description
15.5.3. Business Overview
15.6. Siegwerk Druckfarben AG & Co. KGaA
15.6.1. Company Details
15.6.2. Company Description
15.6.3. Business Overview
15.6.4. Financial Details
15.6.5. Strategic Overview
15.7. Toyo Inc. SC Holdings Co. Ltd.
15.7.1. Company Details
15.7.2. Company Description
15.7.3. Business Overview
15.7.4. Financial Details
15.7.5. Strategic Overview
15.8. INX International Inc. Co.
15.8.1. Company Details
15.8.2. Company Description
15.8.3. Business Overview
15.9. Huber Group
15.9.1. Company Details
15.9.2. Company Description
15.9.3. Business Overview
15.9.4. Recent Developments
15.9.5. Strategic Overview
15.10. Altana AG
15.10.1. Company Details
15.10.2. Company Description
15.10.3. Business Overview
15.10.4. Financial Details
15.10.5. Strategic Overview
15.11. T&K Toka Co., Ltd.
15.11.1. Company Details
15.11.2. Company Description
15.11.3. Business Overview
15.11.4. Financial Details
15.11.5. Strategic Overview
15.12. Zeller+Gmelin GmbH & Co. KG
15.12.1. Company Details
15.12.2. Company Description
15.12.3. Business Overview
15.12.4. Recent Developments
15.12.5. Strategic Overview
16. Key Findings
17. Primary Insights
List of Tables
Table 01: Global Flexographic Printing Inks Market Volume (Kilo Tons) Forecast, by Type, 2017–2026
Table 02: Global Flexographic Printing Inks Market Value (US$ Mn) Forecast, by Type, 2017–2026
Table 03: Global Flexographic Printing Inks Market Volume (Kilo Tons) Forecast, by Resin, 2017–2026
Table 04: Global Flexographic Printing Inks Market Value (US$ Mn) Forecast, by Resin, 2017–2026
Table 05: Global Flexographic Inks Market Volume (Kilo Tons) Forecast, by Application, 2017–2026
Table 06: Global Flexographic Inks Market Value (US$ Mn) Forecast, by Application, 2017–2026
Table 07: Global Flexographic Inks Market Volume (Kilo Tons) Forecast, by Region, 2017–2026
Table 08: Global Flexographic Inks Market Value (US$ Mn) Forecast, by Region, 2017–2026
Table 09: North America Flexographic Printing Inks Market Volume (Kilo Tons) Forecast, by Type, 2017–2026
Table 10: North America Flexographic Printing Inks Market Value (US$ Mn) Forecast, by Type, 2017–2026
Table 11: North America Flexographic Inks Market Volume (Kilo Tons) Forecast, by Application, 2017–2026
Table 12: North America Flexographic Inks Market Value (US$ Mn) Forecast, by Application, 2017–2026
Table 13: North America Flexographic Printing Inks Market Volume (Kilo Tons) Forecast, by Resin, 2017–2026
Table 14: North America Flexographic Printing Inks Market Value (US$ Mn) Forecast, by Resin, 2017–2026
Table 15: North America Flexographic Printing Inks Market Volume (Kilo Tons) Forecast, by Country, 2017–2026
Table 16: North America Flexographic Printing Inks Market Value (US$ Mn) Forecast, by Country, 2017–2026
Table 17: U.S. Flexographic Printing Inks Market Volume (Kilo Tons) Forecast, by Type, 2017–2026
Table 18: U.S. Flexographic Printing Inks Market Value (US$ Mn) Forecast, by Type, 2017–2026
Table 19: U.S. Flexographic Inks Market Volume (Kilo Tons) Forecast, by Application, 2017–2026
Table 20: U.S. Flexographic Inks Market Value (US$ Mn) Forecast, by Application, 2017–2026
Table 21: U.S. Flexographic Printing Inks Market Volume (Kilo Tons) Forecast, by Resin, 2017–2026
Table 22: U.S. Flexographic Printing Inks Market Value (US$ Mn) Forecast, by Resin, 2017–2026
Table 23: Canada Flexographic Printing Inks Market Volume (Kilo Tons) Forecast, by Type, 2017–2026
Table 24: Canada Flexographic Printing Inks Market Value (US$ Mn) Forecast, by Type, 2017–2026
Table 25: Canada Flexographic Inks Market Volume (Kilo Tons) Forecast, by Application, 2017–2026
Table 26: Canada Flexographic Inks Market Value (US$ Mn) Forecast, by Application, 2017–2026
Table 27: Canada Flexographic Printing Inks Market Volume (Kilo Tons) Forecast, by Resin, 2017–2026
Table 28: Canada Flexographic Printing Inks Market Value (US$ Mn) Forecast, by Resin, 2017–2026
Table 29: Latin America Flexographic Printing Inks Market Volume (Kilo Tons) Forecast, by Type, 2017–2026
Table 30: Latin America Flexographic Printing Inks Market Value (US$ Mn) Forecast, by Type, 2017–2026
Table 31: Latin America Flexographic Inks Market Volume (Kilo Tons) Forecast, by Application, 2017–2026
Table 32: Latin America Flexographic Inks Market Value (US$ Mn) Forecast, by Application, 2017–2026
Table 33: Latin America Flexographic Printing Inks Market Volume (Kilo Tons) Forecast, by Resin, 2017–2026
Table 34: Latin America Flexographic Printing Inks Market Value (US$ Mn) Forecast, by Resin, 2017–2026
Table 35: Latin America Flexographic Printing Inks Market Volume (Kilo Tons) Forecast, by Country and Sub-region, 2017–2026
Table 36: Latin America Flexographic Printing Inks Market Value (US$ Mn) Forecast, by Country and Sub-region, 2017–2026
Table 37: Brazil Flexographic Printing Inks Market Volume (Kilo Tons) Forecast, by Type, 2017–2026
Table 38: Brazil Flexographic Printing Inks Market Value (US$ Mn) Forecast, by Type, 2017–2026
Table 39: Brazil Flexographic Inks Market Volume (Kilo Tons) Forecast, by Application, 2017–2026
Table 40: Brazil Flexographic Inks Market Value (US$ Mn) Forecast, by Application, 2017–2026
Table 41: Brazil Flexographic Printing Inks Market Volume (Kilo Tons) Forecast, by Resin, 2017–2026
Table 42: Brazil Flexographic Printing Inks Market Value (US$ Mn) Forecast, by Resin, 2017–2026
Table 43: Mexico Flexographic Printing Inks Market Volume (Kilo Tons) Forecast, by Type, 2017–2026
Table 44: Mexico Flexographic Printing Inks Market Value (US$ Mn) Forecast, by Type, 2017–2026
Table 45: Mexico Flexographic Inks Market Volume (Kilo Tons) Forecast, by Application, 2017–2026
Table 46: Mexico Flexographic Inks Market Value (US$ Mn) Forecast, by Application, 2017–2026
Table 47: Mexico Flexographic Printing Inks Market Volume (Kilo Tons) Forecast, by Resin, 2017–2026
Table 48: Mexico Flexographic Printing Inks Market Value (US$ Mn) Forecast, by Resin, 2017–2026
Table 49: Rest of Latin America Flexographic Printing Inks Market Volume (Kilo Tons) Forecast, by Type, 2017–2026
Table 50: Rest of Latin America Flexographic Printing Inks Market Value (US$ Mn) Forecast, by Type, 2017–2026
Table 51: Rest of Latin America Flexographic Inks Market Volume (Kilo Tons) Forecast, by Application, 2017–2026
Table 52: Rest of Latin America Flexographic Inks Market Value (US$ Mn) Forecast, by Application, 2017–2026
Table 53: Rest of Latin America Flexographic Printing Inks Market Volume (Kilo Tons) Forecast, by Resin, 2017–2026
Table 54: Rest of Latin America Flexographic Printing Inks Market Value (US$ Mn) Forecast, by Resin, 2017–2026
Table 55: Europe Flexographic Printing Inks Market Volume (Kilo Tons) Forecast, by Type, 2017–2026
Table 56: Europe Flexographic Printing Inks Market Value (US$ Mn) Forecast, by Type, 2017–2026
Table 57: Europe Flexographic Inks Market Volume (Kilo Tons) Forecast, by Application, 2017–2026
Table 58: Europe Flexographic Inks Market Value (US$ Mn) Forecast, by Application, 2017–2026
Table 59: Europe Flexographic Printing Inks Market Volume (Kilo Tons) Forecast, by Resin, 2017–2026
Table 60: Europe Flexographic Printing Inks Market Value (US$ Mn) Forecast, by Resin, 2017–2026
Table 61: Europe Flexographic Printing Inks Market Volume (Kilo Tons) Forecast, by Country and Sub-region, 2017–2026
Table 62: Europe Flexographic Printing Inks Market Value (US$ Mn) Forecast, by Country and Sub-region, 2017–2026
Table 63: Germany Flexographic Printing Inks Market Volume (Kilo Tons) Forecast, by Type, 2017–2026
Table 64: Germany Flexographic Printing Inks Market Value (US$ Mn) Forecast, by Type, 2017–2026
Table 65: Germany Flexographic Inks Market Volume (Kilo Tons) Forecast, by Application, 2017–2026
Table 66: Germany Flexographic Inks Market Value (US$ Mn) Forecast, by Application, 2017–2026
Table 67: Germany Flexographic Printing Inks Market Volume (Kilo Tons) Forecast, by Resin, 2017–2026
Table 68: Germany Flexographic Printing Inks Market Value (US$ Mn) Forecast, by Resin, 2017–2026
Table 69: U.K. Flexographic Printing Inks Market Volume (Kilo Tons) Forecast, by Type, 2017–2026
Table 70: U.K. Flexographic Printing Inks Market Value (US$ Mn) Forecast, by Type, 2017–2026
Table 71: U.K. Flexographic Inks Market Volume (Kilo Tons) Forecast, by Application, 2017–2026
Table 72: U.K. Flexographic Inks Market Value (US$ Mn) Forecast, by Application, 2017–2026
Table 73: U.K. Flexographic Printing Inks Market Volume (Kilo Tons) Forecast, by Resin, 2017–2026
Table 74: U.K. Flexographic Printing Inks Market Value (US$ Mn) Forecast, by Resin, 2017–2026
Table 75: France Flexographic Printing Inks Market Volume (Kilo Tons) Forecast, by Type, 2017–2026
Table 76: France Flexographic Printing Inks Market Value (US$ Mn) Forecast, by Type, 2017–2026
Table 77: France Flexographic Inks Market Volume (Kilo Tons) Forecast, by Application, 2017–2026
Table 78: France Flexographic Inks Market Value (US$ Mn) Forecast, by Application, 2017–2026
Table 79: France Flexographic Printing Inks Market Volume (Kilo Tons) Forecast, by Resin, 2017–2026
Table 80: France Flexographic Printing Inks Market Value (US$ Mn) Forecast, by Resin, 2017–2026
Table 81: Italy Flexographic Printing Inks Market Volume (Kilo Tons) Forecast, by Type, 2017–2026
Table 82: Italy Flexographic Printing Inks Market Value (US$ Mn) Forecast, by Type, 2017–2026
Table 83: Italy Flexographic Inks Market Volume (Kilo Tons) Forecast, by Application, 2017–2026
Table 84: Italy Flexographic Inks Market Value (US$ Mn) Forecast, by Application, 2017–2026
Table 85: Italy Flexographic Printing Inks Market Volume (Kilo Tons) Forecast, by Resin, 2017–2026
Table 86: Italy Flexographic Printing Inks Market Value (US$ Mn) Forecast, by Resin, 2017–2026
Table 87: Spain Flexographic Printing Inks Market Volume (Kilo Tons) Forecast, by Type, 2017–2026
Table 88: Spain Flexographic Printing Inks Market Value (US$ Mn) Forecast, by Type, 2017–2026
Table 89: Spain Flexographic Inks Market Volume (Kilo Tons) Forecast, by Application, 2017–2026
Table 90: Spain Flexographic Inks Market Value (US$ Mn) Forecast, by Application, 2017–2026
Table 91: Spain Flexographic Printing Inks Market Volume (Kilo Tons) Forecast, by Resin, 2017–2026
Table 92: Spain Flexographic Printing Inks Market Value (US$ Mn) Forecast, by Resin, 2017–2026
Table 93: Russia & CIS Flexographic Printing Inks Market Volume (Kilo Tons) Forecast, by Type, 2017–2026
Table 94: Russia & CIS Flexographic Printing Inks Market Value (US$ Mn) Forecast, by Type, 2017–2026
Table 95: Russia & CIS Flexographic Inks Market Volume (Kilo Tons) Forecast, by Application, 2017–2026
Table 96: Russia & CIS Flexographic Inks Market Value (US$ Mn) Forecast, by Application, 2017–2026
Table 97: Russia & CIS Flexographic Printing Inks Market Volume (Kilo Tons) Forecast, by Resin, 2017–2026
Table 98: Russia & CIS Flexographic Printing Inks Market Value (US$ Mn) Forecast, by Resin, 2017–2026
Table 99: Rest of Europe Flexographic Printing Inks Market Volume (Kilo Tons) Forecast, by Type, 2017–2026
Table 100: Rest of Europe Flexographic Printing Inks Market Value (US$ Mn) Forecast, by Type, 2017–2026
Table 101: Rest of Europe Flexographic Inks Market Volume (Kilo Tons) Forecast, by Application, 2017–2026
Table 102: Rest of Europe Flexographic Inks Market Value (US$ Mn) Forecast, by Application, 2017–2026
Table 103: Rest of Europe Flexographic Printing Inks Market Volume (Kilo Tons) Forecast, by Resin, 2017–2026
Table 104: Rest of Europe Flexographic Printing Inks Market Value (US$ Mn) Forecast, by Resin, 2017–2026
Table 105: Asia Pacific Flexographic Printing Inks Market Volume (Kilo Tons) Forecast, by Type, 2017–2026
Table 106: Asia Pacific Flexographic Printing Inks Market Value (US$ Mn) Forecast, by Type, 2017–2026
Table 107: Asia Pacific Flexographic Inks Market Volume (Kilo Tons) Forecast, by Application, 2017–2026
Table 108: Asia Pacific Flexographic Inks Market Value (US$ Mn) Forecast, by Application, 2017–2026
Table 109: Asia Pacific Flexographic Printing Inks Market Volume (Kilo Tons) Forecast, by Resin, 2017–2026
Table 110: Asia Pacific Flexographic Printing Inks Market Value (US$ Mn) Forecast, by Resin, 2017–2026
Table 111: Asia Pacific Flexographic Printing Inks Market Volume (Kilo Tons) Forecast, by Country and Sub-region, 2017–2026
Table 112: Asia Pacific Flexographic Printing Inks Market Value (US$ Mn) Forecast, by Country and Sub-region, 2017–2026
Table 113: China Flexographic Printing Inks Market Volume (Kilo Tons) Forecast, by Type, 2017–2026
Table 114: China Flexographic Printing Inks Market Value (US$ Mn) Forecast, by Type, 2017–2026
Table 115: China Flexographic Inks Market Volume (Kilo Tons) Forecast, by Application, 2017–2026
Table 116: China Flexographic Inks Market Value (US$ Mn) Forecast, by Application, 2017–2026
Table 117: China Flexographic Printing Inks Market Volume (Kilo Tons) Forecast, by Resin, 2017–2026
Table 118: China Flexographic Printing Inks Market Value (US$ Mn) Forecast, by Resin, 2017–2026
Table 119: India Flexographic Printing Inks Market Volume (Kilo Tons) Forecast, by Type, 2017–2026
Table 120: India Flexographic Printing Inks Market Value (US$ Mn) Forecast, by Type, 2017–2026
Table 121: India Flexographic Inks Market Volume (Kilo Tons) Forecast, by Application, 2017–2026
Table 122: India Flexographic Inks Market Value (US$ Mn) Forecast, by Application, 2017–2026
Table 123: India Flexographic Printing Inks Market Volume (Kilo Tons) Forecast, by Resin, 2017–2026
Table 124: India Flexographic Printing Inks Market Value (US$ Mn) Forecast, by Resin, 2017–2026
Table 125: Japan Flexographic Printing Inks Market Volume (Kilo Tons) Forecast, by Type, 2017–2026
Table 126: Japan Flexographic Printing Inks Market Value (US$ Mn) Forecast, by Type, 2017–2026
Table 127: Japan Flexographic Inks Market Volume (Kilo Tons) Forecast, by Application, 2017–2026
Table 128: Japan Flexographic Inks Market Value (US$ Mn) Forecast, by Application, 2017–2026
Table 129: Japan Flexographic Printing Inks Market Volume (Kilo Tons) Forecast, by Resin, 2017–2026
Table 130: Japan Flexographic Printing Inks Market Value (US$ Mn) Forecast, by Resin, 2017–2026
Table 131: ASEAN Flexographic Printing Inks Market Volume (Kilo Tons) Forecast, by Type, 2017–2026
Table 132: ASEAN Flexographic Printing Inks Market Value (US$ Mn) Forecast, by Type, 2017–2026
Table 133: ASEAN Flexographic Inks Market Volume (Kilo Tons) Forecast, by Application, 2017–2026
Table 134: ASEAN Flexographic Inks Market Value (US$ Mn) Forecast, by Application, 2017–2026
Table 135: ASEAN Flexographic Printing Inks Market Volume (Kilo Tons) Forecast, by Resin, 2017–2026
Table 136: ASEAN Flexographic Printing Inks Market Value (US$ Mn) Forecast, by Resin, 2017–2026
Table 137: Rest of Asia Pacific Flexographic Printing Inks Market Volume (Kilo Tons) Forecast, by Type, 2017–2026
Table 138: Rest of Asia Pacific Flexographic Printing Inks Market Value (US$ Mn) Forecast, by Type, 2017–2026
Table 139: Rest of Asia Pacific Flexographic Inks Market Volume (Kilo Tons) Forecast, by Application, 2017–2026
Table 140: Rest of Asia Pacific Flexographic Inks Market Value (US$ Mn) Forecast, by Application, 2017–2026
Table 141: Rest of Asia Pacific Flexographic Printing Inks Market Volume (Kilo Tons) Forecast, by Resin, 2017–2026
Table 142: Rest of Asia Pacific Flexographic Printing Inks Market Value (US$ Mn) Forecast, by Resin, 2017–2026
Table 143: Middle East & Africa Flexographic Printing Inks Market Volume (Kilo Tons) Forecast, by Type, 2017–2026
Table 144: Middle East & Africa Flexographic Printing Inks Market Value (US$ Mn) Forecast, by Type, 2017–2026
Table 145: Middle East & Africa Flexographic Inks Market Volume (Kilo Tons) Forecast, by Application, 2017–2026
Table 146: Middle East & Africa Flexographic Inks Market Value (US$ Mn) Forecast, by Application, 2017–2026
Table 147: Middle East & Africa Flexographic Printing Inks Market Volume (Kilo Tons) Forecast, by Resin, 2017–2026
Table 148: Middle East & Africa Flexographic Printing Inks Market Value (US$ Mn) Forecast, by Resin, 2017–2026
Table 149: Middle East & Africa Flexographic Printing Inks Market Volume (Kilo Tons) Forecast, by Country and Sub-region, 2017–2026
Table 150: Middle East & Africa Flexographic Printing Inks Market Value (US$ Mn) Forecast, by Country and Sub-region, 2017–2026
Table 151: GCC Flexographic Printing Inks Market Volume (Kilo Tons) Forecast, by Type, 2017–2026
Table 152: GCC Flexographic Printing Inks Market Value (US$ Mn) Forecast, by Type, 2017–2026
Table 153: GCC Flexographic Inks Market Volume (Kilo Tons) Forecast, by Application, 2017–2026
Table 154: GCC Flexographic Inks Market Value (US$ Mn) Forecast, by Application, 2017–2026
Table 155: GCC Flexographic Printing Inks Market Volume (Kilo Tons) Forecast, by Resin, 2017–2026
Table 156: GCC Flexographic Printing Inks Market Value (US$ Mn) Forecast, by Resin, 2017–2026
Table 157: South Africa Flexographic Printing Inks Market Volume (Kilo Tons) Forecast, by Type, 2017–2026
Table 158: South Africa Flexographic Printing Inks Market Value (US$ Mn) Forecast, by Type, 2017–2026
Table 159: South Africa Flexographic Inks Market Volume (Kilo Tons) Forecast, by Application, 2017–2026
Table 160: South Africa Flexographic Inks Market Value (US$ Mn) Forecast, by Application, 2017–2026
Table 161: South Africa Flexographic Printing Inks Market Volume (Kilo Tons) Forecast, by Resin, 2017–2026
Table 162: South Africa Flexographic Printing Inks Market Value (US$ Mn) Forecast, by Resin, 2017–2026
Table 163: Rest of Middle East & Africa Flexographic Printing Inks Market Volume (Kilo Tons) Forecast, by Type, 2017–2026
Table 164: Rest of Middle East & Africa Flexographic Printing Inks Market Value (US$ Mn) Forecast, by Type, 2017–2026
Table 165: Rest of Middle East & Africa Flexographic Inks Market Volume (Kilo Tons) Forecast, by Application, 2017–2026
Table 166: Rest of Middle East & Africa Flexographic Inks Market Value (US$ Mn) Forecast, by Application, 2017–2026
Table 167: Rest of Middle East & Africa Flexographic Printing Inks Market Volume (Kilo Tons) Forecast, by Resin, 2017–2026
Table 168: Rest of Middle East & Africa Flexographic Printing Inks Market Value (US$ Mn) Forecast, by Resin, 2017–2026
List of Figures
Figure 01: Global Flexographic Inks Market
Figure 02: Global Flexographic Inks Market Volume (Kilo Tons) and Value (US$ Mn) Forecast, 2017–2026
Figure 03: Global Flexographic Printing Inks Market Value Share Analysis, by Type, 2017 and 2026
Figure 04: Global Flexographic Printing Inks Market Attractiveness Analysis, by Type, 2017
Figure 05: Global Flexographic Printing Inks Market Value Share Analysis, by Resin, 2017 and 2026
Figure 06: Global Flexographic Printing Inks Market Attractiveness Analysis, by Resin, 2017
Figure 07: Global Flexographic Inks Market Value Share Analysis, by Application, 2017 and 2026
Figure 08: Global Flexographic Inks Market Attractiveness Analysis, by Application, 2017
Figure 09: Global Flexographic Inks Market Value Share Analysis, by Region, 2017 and 2026
Figure 10: Global Flexographic Inks Market Attractiveness Analysis, by Region
Figure 11: North America Flexographic Inks Market Volume (Kilo Tons) Forecast, 2017–2026
Figure 12: North America Flexographic Inks Market Value (US$ Mn) Forecast, 2017–2026
Figure 13: North America Flexographic Inks Market Value Share Analysis, by Type, 2017 and 2026
Figure 14: North America Flexographic Inks Market Value Share Analysis, by Application, 2017 and 2026
Figure 15: North America Flexographic Inks Market Value Share Analysis, by Resin, 2017 and 2026
Figure 16: North America Flexographic Inks Market Value Share Analysis, by Country, 2017 and 2026
Figure 17: North America Flexographic Inks Market Attractiveness Analysis, by Type, 2017
Figure 18: North America Flexographic Inks Market Attractiveness Analysis, by Application, 2017
Figure 19: North America Flexographic Inks Market Attractiveness Analysis, by Resin, 2017
Figure 20: North America Flexographic Inks Market Attractiveness Analysis, by Country, 2017
Figure 21: Latin America Flexographic Inks Market Volume (Kilo Tons) Forecast, 2017–2026
Figure 22: Latin America Flexographic Inks Market Value (US$ Mn) Forecast, 2017–2026
Figure 23: Latin America Flexographic Inks Market Value Share Analysis, by Type, 2017 and 2026
Figure 24: Latin America Flexographic Inks Market Value Share Analysis, by Application, 2017 and 2026
Figure 25: Latin America Flexographic Inks Market Value Share Analysis, by Resin, 2017 and 2026
Figure 26: Latin America Flexographic Inks Market Value Share Analysis, by Country and Sub-region, 2017 and 2026
Figure 27: Latin America Flexographic Inks Market Attractiveness Analysis, by Type, 2017
Figure 28: Latin America Flexographic Inks Market Attractiveness Analysis, by Application, 2017
Figure 29: Latin America Flexographic Inks Market Attractiveness Analysis, by Resin, 2017
Figure 30: Latin America Flexographic Inks Market Attractiveness Analysis, by Country and Sub-region, 2017
Figure 31: Europe Flexographic Inks Market Volume (Kilo Tons) Forecast, 2017–2026
Figure 32: Europe Flexographic Inks Market Value (US$ Mn) Forecast, 2017–2026
Figure 33: Europe Flexographic Inks Market Value Share Analysis, by Type, 2017 and 2026
Figure 34: Europe Flexographic Inks Market Value Share Analysis, by Application, 2017 and 2026
Figure 35: Europe Flexographic Inks Market Value Share Analysis, by Resin, 2017 and 2026
Figure 36: Europe Flexographic Inks Market Value Share Analysis, by Country and Sub-region, 2017 and 2026
Figure 37: Europe Flexographic Inks Market Attractiveness Analysis, by Type, 2017
Figure 38: Europe Flexographic Inks Market Attractiveness Analysis, by Application, 2017
Figure 39: Europe Flexographic Inks Market Attractiveness Analysis, by Resin, 2017
Figure 40: Europe Flexographic Inks Market Attractiveness Analysis, by Country and Sub-region, 2017
Figure 41: Asia Pacific Flexographic Inks Market Volume (Kilo Tons) Forecast, 2017–2026
Figure 42: Asia Pacific Flexographic Inks Market Value (US$ Mn) Forecast, 2017–2026
Figure 43: Asia Pacific Flexographic Inks Market Value Share Analysis, by Type, 2017 and 2026
Figure 44: Asia Pacific Flexographic Inks Market Value Share Analysis, by Application, 2017 and 2026
Figure 45: Asia Pacific Flexographic Inks Market Value Share Analysis, by Resin, 2017 and 2026
Figure 46: Asia Pacific Flexographic Inks Market Value Share Analysis, by Country and Sub-region, 2017 and 2026
Figure 47: Asia Pacific Flexographic Inks Market Attractiveness Analysis, by Type, 2017
Figure 48: Asia Pacific Flexographic Inks Market Attractiveness Analysis, by Application, 2017
Figure 49: Asia Pacific Flexographic Inks Market Attractiveness Analysis, by Resin, 2017
Figure 50: Asia Pacific Flexographic Inks Market Attractiveness Analysis, by Country and Sub-region, 2017
Figure 51: Middle East & Africa Flexographic Inks Market Volume (Kilo Tons) Forecast, 2017–2026
Figure 52: Middle East & Africa Flexographic Inks Market Value (US$ Mn) Forecast, 2017–2026
Figure 53: Middle East & Africa Flexographic Inks Market Value Share Analysis, by Type, 2017 and 2026
Figure 54: Middle East & Africa Flexographic Inks Market Value Share Analysis, by Application, 2017 and 2026
Figure 55: Middle East & Africa Flexographic Inks Market Value Share Analysis, by Resin, 2017 and 2026
Figure 56: Middle East & Africa Flexographic Inks Market Value Share Analysis, by Country and Sub-region, 2017 and 2026
Figure 57: Middle East & Africa Flexographic Inks Market Attractiveness Analysis, by Type, 2017
Figure 58: Middle East & Africa Flexographic Inks Market Attractiveness Analysis, by Application, 2017
Figure 59: Middle East & Africa Flexographic Inks Market Attractiveness Analysis, by Resin, 2017
Figure 60: Middle East & Africa Flexographic Inks Market Attractiveness Analysis, by Country and Sub-region, 2017
Figure 61: Global Flexographic Inks Market Share Analysis, by Company (2017)
Copyright © Transparency Market Research, Inc. All Rights reserved
Trust Online

Flexographic Inks Market Forecast 2017 - 2025