
Reports
Reports
Manufacturers in the fully automatic beverage machines market are addressing the growing consumer demand for products that offer a true bean-to-cup experience in espresso and novel coffee machines. This has catalyzed the need for quality coffee drinks in restaurants and ready-to-drink (RTD) beverages at home.
As such, manufacturers are offering a range of one-touch fully automatic coffee and beverage machines to engage with customer preferences. Smart technology-enhanced manual machines and customizable drip coffeemakers are enhancing the coffee experience of consumers.
There is a high growth potential for fully automatic beverage machines, since the industry-wide demand for premium coffee options is on the rise. For instance, Costa Coffee — a U.K.-based global coffee brand, serves premium coffee options through its prominent channel of more than 8,000 fully automatic vending machines. Also, ready-to-drink coffee is catching up with the soft drinks category in terms of sales, as the global out-of-home (OOH) and RTD segments were valued at ~US$ 360 and ~US$ 85 billion, respectively, in the year 2017.
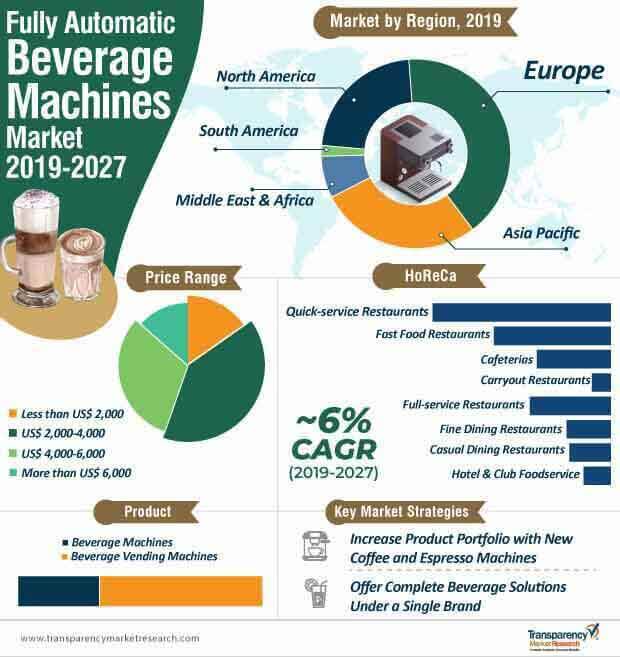
Apart from the shift in customer preference for coffee and other beverages, technological innovations are creating potential incremental opportunities for manufacturers in the fully automatic beverage machines landscape. The global volume sales for fully automatic beverage machines accounted for ~940 thousand units in 2018, being the highest for machines in the price range of US$ 2,000 to US$ 4,000. This shows the strong spending capacity of consumers for high-end coffee and brewing machines.
Seamless integration into the existing working of fully automatic beverage machines, such as supplementation of optional milk systems, has provided consumers with the freshly filtered coffee option. Also, individual inclusion of hot and cold milk foam additives compliments the process of professionally produced coffee.
Manufacturers in the fully automatic beverage machines ecosystem are focusing on offering complete beverage solutions under one roof. They are expanding their portfolios to offer hot, cold, and frozen beverage machines in the fully automatic space. Innovative espresso coffee machines act as a strategic addition in fully automatic beverage technology for the fast-growing coffee market. For instance, in April 2019, Electrolux — a Swedish multinational home appliance manufacturer, announced its acquisition of UNIC S.A.S — a French manufacturer of professional espresso machines, to increase its product offerings for beverage services in the hospitality industry.
The automatic cleaning cycle of beverage machines adds as a maintenance-free aspect for consumers in the fully automatic space. However, certain functional limitations and cost concerns of fully automatic beverage machines are likely to influence the growth of the market.
Many consumers have encountered loud gear-turning noises with the self-cleaning procedure, which eventually led to a wastage of large volumes of water. Fully automatic beverage machines are also prone to the risk of spilling liquid.
Also, the high price tag of fully automatic beverage machines hampers smooth sales, which could be one of the reasons for its just above-moderate CAGR of ~6%. To overcome these challenges and limitations, manufacturers are developing better interfaces with sensor-controlled monitoring of position and functionality for machines and advanced technology to efficiently manage water wastage.
Analysts’ Viewpoint
The advanced technology of fully automatic beverage machines is projected to witness growing prominence amongst consumers and stakeholders in the hospitality industry in Europe and Asia Pacific. Manufacturers are focusing on increasing their product offerings under one brand to emerge as leaders for complete beverage solutions in the hospitality industry. Speed and multi-cup brewing in less than a minute add as important factors for consumers while choosing a machine. However, automatic beverage machines face tough competition from manual machines, as the latter are observed to make great-tasting espresso and other coffee options. As such, manufacturers are innovating on professional coffee machines that freshly grind and brew coffee beans to provide premium coffee options.
1. Preface
1.1. Market Definition and Scope
1.2. Market Segmentation
1.3. Key Research Objectives
1.4. Research Highlights
2. Assumptions and Research Methodology
3. Executive Summary
4. Market Overview
4.1. Introduction
4.2. Market Dynamics
4.2.1. Drivers
4.2.2. Restraints
4.2.3. Opportunities
4.3. Industry SWOT Analysis
4.4. Porter’s Five Forces Analysis
4.5. Value Chain Analysis
4.6. Key Trends Analysis
4.6.1. Demand Side
4.6.2. Supply Side
4.7. Macro-Economic Factors
4.8. Key Market Indicators
4.9. Global Fully Automatic Beverage Machines Market Analysis and Forecast, 2017 - 2027
4.9.1. Market Value Projection (US$ Mn)
4.9.2. Market Volume Projection (Thousand Units)
5. Global Fully Automatic Beverage Machines Market Analysis and Forecast, By Product
5.1. Definitions/ Overview
5.2. Fully Automatic Beverage Machines Market Size (US$ Mn and Thousand Units) Forecast, By Product, 2017-2027
5.2.1. Beverage Machine
5.2.2. Beverage Vending Machine
5.3. Incremental Opportunity Analysis, By Product
6. Global Fully Automatic Beverage Machines Market Analysis and Forecast, By Electric Drive
6.1. Fully Automatic Beverage Machines Market Size (US$ Mn and Thousand Units) Forecast, By Electric Drive, 2017 - 2027
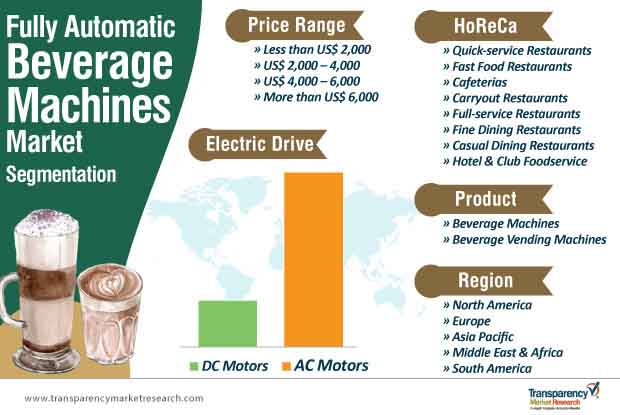
6.1.1. DC Motors
6.1.2. AC Motors
6.2. Incremental Opportunity Analysis, By Electric Drive
7. Global Fully Automatic Beverage Machines Market Analysis and Forecast, By Price Range
7.1. Fully Automatic Beverage Machines Market Size (US$ Mn and Thousand Units) Forecast, By Price Range, 2017 - 2027
7.1.1. Less than US$ 2,000
7.1.2. US$ 2,000-US$ 4,000
7.1.3. US$ 4,000-US$ 6,000
7.1.4. More than US$ 6,000
7.2. Incremental Opportunity Analysis, By Price Range
8. Global Fully Automatic Beverage Machines Market Analysis and Forecast, By HoReCa
8.1. Fully Automatic Beverage Machines Market Size (US$ Mn and Thousand Units) Forecast, By HoReCa, 2017 - 2027
8.1.1. Quick-service Restaurants
8.1.1.1. Fast Food Restaurants
8.1.1.2. Cafeterias
8.1.1.3. Carryout Restaurants
8.1.2. Full-service Restaurants
8.1.2.1. Fine Dining Restaurants
8.1.2.2. Casual Dining Restaurants
8.1.2.3. Hotel & Club Foodservice
8.2. Incremental Opportunity Analysis, By HoReCa
9. Global Fully Automatic Beverage Machines Market Analysis and Forecast, by Region
9.1. Fully Automatic Beverage Machines Market Size (US$ Mn and Thousand Units) Forecast, by Region, 2017 - 2027
9.1.1. North America
9.1.2. Europe
9.1.3. Asia Pacific
9.1.4. Middle East & Africa
9.1.5. South America
9.2. Incremental Opportunity Analysis, by Region
10. North America Fully Automatic Beverage Machines Market Analysis and Forecast
10.1. Regional Snapshot
10.1.1. By Product
10.1.2. By Electric Drive
10.1.3. By Price Range
10.1.4. By HoReCa
10.1.5. By Country/Sub-region
10.2. Key Trends Impact Analysis
10.3. Price Trend Analysis
10.3.1. Weighted Average Price
10.4. North America Fully Automatic Beverage Machines Market Size (US$ Mn and Thousand Units) Forecast, By Product, 2017 - 2027
10.4.1. Beverage Machine
10.4.2. Beverage Vending Machine
10.5. North America Fully Automatic Beverage Machines Market Size (US$ Mn and Thousand Units) Forecast, By Electric Drive, 2017 - 2027
10.5.1. DC Motors
10.5.2. AC Motors
10.6. North America Fully Automatic Beverage Machines Market Size (US$ Mn and Thousand Units) Forecast, By Price Range, 2017 - 2027
10.6.1. Less than US$ 2,000
10.6.2. US$ 2,000-US$ 4,000
10.6.3. US$ 4,000-US$ 6,000
10.6.4. More than US$ 6,000
10.7. North America Fully Automatic Beverage Machines Market Size (US$ Mn and Thousand Units) Forecast, By HoReCa, 2017 - 2027
10.7.1. Quick-service Restaurant
10.7.1.1. Fast Food Restaurants
10.7.1.2. Cafeterias
10.7.1.3. Carryout Restaurants
10.7.2. Full-service Restaurants
10.7.2.1. Fine Dining Restaurants
10.7.2.2. Casual Dining Restaurants
10.7.2.3. Hotel & Club Foodservice
10.8. North America Fully Automatic Beverage Machines Market Size (US$ Mn and Thousand Units) Forecast, By Country/Sub-region, 2017 - 2027
10.8.1. U.S.
10.8.2. Canada
10.8.3. Mexico
10.8.4. Rest of North America
10.9. Incremental Opportunity Analysis
10.9.1. By Country/Sub-region
11. U.S. Fully Automatic Beverage Machines Market Analysis and Forecast
11.1. Country Snapshot
11.1.1. By Product
11.1.2. By Electric Drive
11.1.3. By Price Range
11.1.4. By HoReCa
11.2. Key Trends Impact Analysis
11.3. Market Share Analysis, by Top Players
11.4. Price Trend Analysis
11.4.1. Weighted Average Price
11.5. U.S. Fully Automatic Beverage Machines Market Size (US$ Mn and Thousand Units) Forecast, By Product, 2017 - 2027
11.5.1. Beverage Machine
11.5.2. Beverage Vending Machine
11.6. U.S. Fully Automatic Beverage Machines Market Size (US$ Mn and Thousand Units) Forecast, By Electric Drive, 2017 - 2027
11.6.1. DC Motors
11.6.2. AC Motors
11.7. U.S. Fully Automatic Beverage Machines Market Size (US$ Mn and Thousand Units) Forecast, By Price Range, 2017 - 2027
11.7.1. Less than US$ 2,000
11.7.2. US$ 2,000-US$ 4,000
11.7.3. US$ 4,000-US$ 6,000
11.7.4. More than US$ 6,000
11.8. U.S. Fully Automatic Beverage Machines Market Size (US$ Mn and Thousand Units) Forecast, By HoReCa, 2017 - 2027
11.8.1. Quick-service Restaurant
11.8.1.1. Fast Food Restaurants
11.8.1.2. Cafeterias
11.8.1.3. Carryout Restaurants
11.8.2. Full-service Restaurants
11.8.2.1. Fine Dining Restaurants
11.8.2.2. Casual Dining Restaurants
11.8.2.3. Hotel & Club Foodservice
11.9. Incremental Opportunity Analysis
11.9.1. By Product
11.9.2. By Electric Drive
11.9.3. By Price Range
11.9.4. By HoReCa
12. Canada Fully Automatic Beverage Machines Market Analysis and Forecast
12.1. Country Snapshot
12.1.1. By Product
12.1.2. By Electric Drive
12.1.3. By Price Range
12.1.4. By HoReCa
12.2. Key Trends Impact Analysis
12.3. Market Share Analysis, by Top Players
12.4. Price Trend Analysis
12.4.1. Weighted Average Price
12.5. Canada Fully Automatic Beverage Machines Market Size (US$ Mn and Thousand Units) Forecast, By Product, 2017 - 2027
12.5.1. Beverage Machine
12.5.2. Beverage Vending Machine
12.6. Canada Fully Automatic Beverage Machines Market Size (US$ Mn and Thousand Units) Forecast, By Electric Drive, 2017 - 2027
12.6.1. DC Motors
12.6.2. AC Motors
12.7. Canada Fully Automatic Beverage Machines Market Size (US$ Mn and Thousand Units) Forecast, By Price Range, 2017 - 2027
12.7.1. Less than US$ 2,000
12.7.2. US$ 2,000-US$ 4,000
12.7.3. US$ 4,000-US$ 6,000
12.7.4. More than US$ 6,000
12.8. Canada Fully Automatic Beverage Machines Market Size (US$ Mn and Thousand Units) Forecast, By HoReCa, 2017 - 2027
12.8.1. Quick-service Restaurant
12.8.1.1. Fast Food Restaurants
12.8.1.2. Cafeterias
12.8.1.3. Carryout Restaurants
12.8.2. Full-service Restaurants
12.8.2.1. Fine Dining Restaurants
12.8.2.2. Casual Dining Restaurants
12.8.2.3. Hotel & Club Foodservice
12.9. Incremental Opportunity Analysis
12.9.1. By Product
12.9.2. By Electric Drive
12.9.3. By Price Range
12.9.4. By HoReCa
13. Mexico Fully Automatic Beverage Machines Market Analysis and Forecast
13.1. Country Snapshot
13.1.1. By Product
13.1.2. By Electric Drive
13.1.3. By Price Range
13.1.4. By HoReCa
13.2. Key Trends Impact Analysis
13.3. Market Share Analysis, by Top Players
13.4. Price Trend Analysis
13.4.1. Weighted Average Price
13.5. Mexico Fully Automatic Beverage Machines Market Size (US$ Mn and Thousand Units) Forecast, By Product, 2017 - 2027
13.5.1. Beverage Machine
13.5.2. Beverage Vending Machine
13.6. Mexico Fully Automatic Beverage Machines Market Size (US$ Mn and Thousand Units) Forecast, By Electric Drive, 2017 - 2027
13.6.1. DC Motors
13.6.2. AC Motors
13.7. Mexico Fully Automatic Beverage Machines Market Size (US$ Mn and Thousand Units) Forecast, By Price Range, 2017 - 2027
13.7.1. Less than US$ 2,000
13.7.2. US$ 2,000-US$ 4,000
13.7.3. US$ 4,000-US$ 6,000
13.7.4. More than US$ 6,000
13.8. Mexico Fully Automatic Beverage Machines Market Size (US$ Mn and Thousand Units) Forecast, By HoReCa, 2017 - 2027
13.8.1. Quick-service Restaurant
13.8.1.1. Fast Food Restaurants
13.8.1.2. Cafeterias
13.8.1.3. Carryout Restaurants
13.8.2. Full-service Restaurants
13.8.2.1. Fine Dining Restaurants
13.8.2.2. Casual Dining Restaurants
13.8.2.3. Hotel & Club Foodservice
13.9. Incremental Opportunity Analysis
13.9.1. By Product
13.9.2. By Electric Drive
13.9.3. By Price Range
13.9.4. By HoReCa
14. Europe Fully Automatic Beverage Machines Market Analysis and Forecast
14.1. Regional Snapshot
14.1.1. By Product
14.1.2. By Electric Drive
14.1.3. By Price Range
14.1.4. By HoReCa
14.1.5. By Country/Sub-region
14.2. Key Trends Impact Analysis
14.3. Price Trend Analysis
14.3.1. Weighted Average Price
14.4. Europe Fully Automatic Beverage Machines Market Size (US$ Mn and Thousand Units) Forecast, By Product, 2017 - 2027
14.4.1. Beverage Machine
14.4.2. Beverage Vending Machine
14.5. Europe Fully Automatic Beverage Machines Market Size (US$ Mn and Thousand Units) Forecast, By Electric Drive, 2017 - 2027
14.5.1. DC Motors
14.5.2. AC Motors
14.6. Europe Fully Automatic Beverage Machines Market Size (US$ Mn and Thousand Units) Forecast, By Price Range, 2017 - 2027
14.6.1. Less than US$ 2,000
14.6.2. US$ 2,000-US$ 4,000
14.6.3. US$ 4,000-US$ 6,000
14.6.4. More than US$ 6,000
14.7. Europe Fully Automatic Beverage Machines Market Size (US$ Mn and Thousand Units) Forecast, By HoReCa, 2017 - 2027
14.7.1. Quick-service Restaurant
14.7.1.1. Fast Food Restaurants
14.7.1.2. Cafeterias
14.7.1.3. Carryout Restaurants
14.7.2. Full-service Restaurants
14.7.2.1. Fine Dining Restaurants
14.7.2.2. Casual Dining Restaurants
14.7.2.3. Hotel & Club Foodservice
14.8. Europe Fully Automatic Beverage Machines Market Size (US$ Mn and Thousand Units) Forecast, By Country/Sub-region, 2017 - 2027
14.8.1. Germany
14.8.2. U.K.
14.8.3. France
14.8.4. Italy
14.8.5. Spain
14.8.6. Rest of Europe
14.9. Incremental Opportunity Analysis
14.9.1. By Country/Sub-region
15. Germany Fully Automatic Beverage Machines Market Analysis and Forecast
15.1. Country Snapshot
15.1.1. By Product
15.1.2. By Electric Drive
15.1.3. By Price Range
15.1.4. By HoReCa
15.2. Key Trends Impact Analysis
15.3. Market Share Analysis, by Top Players
15.4. Price Trend Analysis
15.4.1. Weighted Average Price
15.5. Germany Fully Automatic Beverage Machines Market Size (US$ Mn and Thousand Units) Forecast, By Product, 2017 - 2027
15.5.1. Beverage Machine
15.5.2. Beverage Vending Machine
15.6. Germany Fully Automatic Beverage Machines Market Size (US$ Mn and Thousand Units) Forecast, By Electric Drive, 2017 - 2027
15.6.1. DC Motors
15.6.2. AC Motors
15.7. Germany Fully Automatic Beverage Machines Market Size (US$ Mn and Thousand Units) Forecast, By Price Range, 2017 - 2027
15.7.1. Less than US$ 2,000
15.7.2. US$ 2,000-US$ 4,000
15.7.3. US$ 4,000-US$ 6,000
15.7.4. More than US$ 6,000
15.8. Germany Fully Automatic Beverage Machines Market Size (US$ Mn and Thousand Units) Forecast, By HoReCa, 2017 - 2027
15.8.1. Quick-service Restaurant
15.8.1.1. Fast Food Restaurants
15.8.1.2. Cafeterias
15.8.1.3. Carryout Restaurants
15.8.2. Full-service Restaurants
15.8.2.1. Fine Dining Restaurants
15.8.2.2. Casual Dining Restaurants
15.8.2.3. Hotel & Club Foodservice
15.9. Incremental Opportunity Analysis
15.9.1. By Country/Sub-region
16. U.K. Fully Automatic Beverage Machines Market Analysis and Forecast
16.1. Country Snapshot
16.1.1. By Product
16.1.2. By Electric Drive
16.1.3. By Price Range
16.1.4. By HoReCa
16.2. Key Trends Impact Analysis
16.3. Market Share Analysis, by Top Players
16.4. Price Trend Analysis
16.4.1. Weighted Average Price
16.5. U.K. Fully Automatic Beverage Machines Market Size (US$ Mn and Thousand Units) Forecast, By Product, 2017 - 2027
16.5.1. Beverage Machine
16.5.2. Beverage Vending Machine
16.6. U.K. Fully Automatic Beverage Machines Market Size (US$ Mn and Thousand Units) Forecast, By Electric Drive, 2017 - 2027
16.6.1. DC Motors
16.6.2. AC Motors
16.7. U.K. Fully Automatic Beverage Machines Market Size (US$ Mn and Thousand Units) Forecast, By Price Range, 2017 - 2027
16.7.1. Less than US$ 2,000
16.7.2. US$ 2,000-US$ 4,000
16.7.3. US$ 4,000-US$ 6,000
16.7.4. More than US$ 6,000
16.8. U.K. Fully Automatic Beverage Machines Market Size (US$ Mn and Thousand Units) Forecast, By HoReCa, 2017 - 2027
16.8.1. Quick-service Restaurant
16.8.1.1. Fast Food Restaurants
16.8.1.2. Cafeterias
16.8.1.3. Carryout Restaurants
16.8.2. Full-service Restaurants
16.8.2.1. Fine Dining Restaurants
16.8.2.2. Casual Dining Restaurants
16.8.2.3. Hotel & Club Foodservice
16.9. Incremental Opportunity Analysis
16.9.1. By Product
16.9.2. By Electric Drive
16.9.3. By Price Range
16.9.4. By HoReCa
17. France Fully Automatic Beverage Machines Market Analysis and Forecast
17.1. Country Snapshot
17.1.1. By Product
17.1.2. By Electric Drive
17.1.3. By Price Range
17.1.4. By HoReCa
17.2. Key Trends Impact Analysis
17.3. Market Share Analysis, by Top Players
17.4. Price Trend Analysis
17.4.1. Weighted Average Price
17.5. France Fully Automatic Beverage Machines Market Size (US$ Mn and Thousand Units) Forecast, By Product, 2017 - 2027
17.5.1. Beverage Machine
17.5.2. Beverage Vending Machine
17.6. France Fully Automatic Beverage Machines Market Size (US$ Mn and Thousand Units) Forecast, By Electric Drive, 2017 - 2027
17.6.1. DC Motors
17.6.2. AC Motors
17.7. France Fully Automatic Beverage Machines Market Size (US$ Mn and Thousand Units) Forecast, By Price Range, 2017 - 2027
17.7.1. Less than US$ 2,000
17.7.2. US$ 2,000-US$ 4,000
17.7.3. US$ 4,000-US$ 6,000
17.7.4. More than US$ 6,000
17.8. France Fully Automatic Beverage Machines Market Size (US$ Mn and Thousand Units) Forecast, By HoReCa, 2017 - 2027
17.8.1. Quick-service Restaurant
17.8.1.1. Fast Food Restaurants
17.8.1.2. Cafeterias
17.8.1.3. Carryout Restaurants
17.8.2. Full-service Restaurants
17.8.2.1. Fine Dining Restaurants
17.8.2.2. Casual Dining Restaurants
17.8.2.3. Hotel & Club Foodservice
17.9. Incremental Opportunity Analysis
17.9.1. By Country/Sub-region
18. Italy Fully Automatic Beverage Machines Market Analysis and Forecast
18.1. Country Snapshot
18.1.1. By Product
18.1.2. By Electric Drive
18.1.3. By Price Range
18.1.4. By HoReCa
18.2. Key Trends Impact Analysis
18.3. Market Share Analysis, by Top Players
18.4. Price Trend Analysis
18.4.1. Weighted Average Price
18.5. Italy Fully Automatic Beverage Machines Market Size (US$ Mn and Thousand Units) Forecast, By Product, 2017 - 2027
18.5.1. Beverage Machine
18.5.2. Beverage Vending Machine
18.6. Italy Fully Automatic Beverage Machines Market Size (US$ Mn and Thousand Units) Forecast, By Electric Drive, 2017 - 2027
18.6.1. DC Motors
18.6.2. AC Motors
18.7. Italy Fully Automatic Beverage Machines Market Size (US$ Mn and Thousand Units) Forecast, By Price Range, 2017 - 2027
18.7.1. Less than US$ 2,000
18.7.2. US$ 2,000-US$ 4,000
18.7.3. US$ 4,000-US$ 6,000
18.7.4. More than US$ 6,000
18.8. Italy Fully Automatic Beverage Machines Market Size (US$ Mn and Thousand Units) Forecast, By HoReCa, 2017 - 2027
18.8.1. Quick-service Restaurant
18.8.1.1. Fast Food Restaurants
18.8.1.2. Cafeterias
18.8.1.3. Carryout Restaurants
18.8.2. Full-service Restaurants
18.8.2.1. Fine Dining Restaurants
18.8.2.2. Casual Dining Restaurants
18.8.2.3. Hotel & Club Foodservice
18.9. Incremental Opportunity Analysis
18.9.1. By Country/Sub-region
19. Spain Fully Automatic Beverage Machines Market Analysis and Forecast
19.1. Country Snapshot
19.1.1. By Product
19.1.2. By Electric Drive
19.1.3. By Price Range
19.1.4. By HoReCa
19.2. Key Trends Impact Analysis
19.3. Market Share Analysis, by Top Players
19.4. Price Trend Analysis
19.4.1. Weighted Average Price
19.5. Spain Fully Automatic Beverage Machines Market Size (US$ Mn and Thousand Units) Forecast, By Product, 2017 - 2027
19.5.1. Beverage Machine
19.5.2. Beverage Vending Machine
19.6. Spain Fully Automatic Beverage Machines Market Size (US$ Mn and Thousand Units) Forecast, By Electric Drive, 2017 - 2027
19.6.1. DC Motors
19.6.2. AC Motors
19.7. Spain Fully Automatic Beverage Machines Market Size (US$ Mn and Thousand Units) Forecast, By Price Range, 2017 - 2027
19.7.1. Less than US$ 2,000
19.7.2. US$ 2,000-US$ 4,000
19.7.3. US$ 4,000-US$ 6,000
19.7.4. More than US$ 6,000
19.8. Spain Fully Automatic Beverage Machines Market Size (US$ Mn and Thousand Units) Forecast, By HoReCa, 2017 - 2027
19.8.1. Quick-service Restaurant
19.8.1.1. Fast Food Restaurants
19.8.1.2. Cafeterias
19.8.1.3. Carryout Restaurants
19.8.2. Full-service Restaurants
19.8.2.1. Fine Dining Restaurants
19.8.2.2. Casual Dining Restaurants
19.8.2.3. Hotel & Club Foodservice
19.9. Incremental Opportunity Analysis
19.9.1. By Country/Sub-region
20. Asia Pacific Fully Automatic Beverage Machines Market Analysis and Forecast
20.1. Regional Snapshot
20.1.1. By Product
20.1.2. By Electric Drive
20.1.3. By Price Range
20.1.4. By HoReCa
20.1.5. By Country/Sub-region
20.2. Key Trends Impact Analysis
20.3. Price Trend Analysis
20.3.1. Weighted Average Price
20.4. Asia Pacific Fully Automatic Beverage Machines Market Size (US$ Mn and Thousand Units) Forecast, By Product, 2017 - 2027
20.4.1. Beverage Machine
20.4.2. Beverage Vending Machine
20.5. Asia Pacific Fully Automatic Beverage Machines Market Size (US$ Mn and Thousand Units) Forecast, By Electric Drive, 2017 - 2027
20.5.1. DC Motors
20.5.2. AC Motors
20.6. Asia Pacific Fully Automatic Beverage Machines Market Size (US$ Mn and Thousand Units) Forecast, By Price Range, 2017 - 2027
20.6.1. Less than US$ 2,000
20.6.2. US$ 2,000-US$ 4,000
20.6.3. US$ 4,000-US$ 6,000
20.6.4. More than US$ 6,000
20.7. Asia Pacific Fully Automatic Beverage Machines Market Size (US$ Mn and Thousand Units) Forecast, By HoReCa Technology, 2017 - 2027
20.7.1. Quick-service Restaurant
20.7.1.1. Fast Food Restaurants
20.7.1.2. Cafeterias
20.7.1.3. Carryout Restaurants
20.7.2. Full-service Restaurants
20.7.2.1. Fine Dining Restaurants
20.7.2.2. Casual Dining Restaurants
20.7.2.3. Hotel & Club Foodservice
20.8. Asia Pacific Fully Automatic Beverage Machines Market Size (US$ Mn and Thousand Units) Forecast, By Country/Sub-region, 2017 - 2027
20.8.1. China
20.8.2. Japan
20.8.3. Korea
20.8.4. Singapore
20.8.5. Australia
20.8.6. Malaysia
20.8.7. Indonesia
20.8.8. Philippines
20.8.9. Vietnam
20.8.10. Thailand
20.8.11. Cambodia
20.8.12. Myanmar
20.8.13. Rest of Asia Pacific
20.9. Incremental Opportunity Analysis
20.9.1. By Country/Sub-region
21. China Fully Automatic Beverage Machines Market Analysis and Forecast
21.1. Country Snapshot
21.1.1. By Product
21.1.2. By Electric Drive
21.1.3. By Price Range
21.1.4. By HoReCa
21.2. Key Trends Impact Analysis
21.3. Market Share Analysis, by Top Players
21.4. Price Trend Analysis
21.4.1. Weighted Average Price
21.5. China Fully Automatic Beverage Machines Market Size (US$ Mn and Thousand Units) Forecast, By Product, 2017 - 2027
21.5.1. Beverage Machine
21.5.2. Beverage Vending Machine
21.6. China Fully Automatic Beverage Machines Market Size (US$ Mn and Thousand Units) Forecast, By Electric Drive, 2017 - 2027
21.6.1. DC Motors
21.6.2. AC Motors
21.7. China Fully Automatic Beverage Machines Market Size (US$ Mn and Thousand Units) Forecast, By Price Range, 2017 - 2027
21.7.1. Less than US$ 2,000
21.7.2. US$ 2,000-US$ 4,000
21.7.3. US$ 4,000-US$ 6,000
21.7.4. More than US$ 6,000
21.8. China Fully Automatic Beverage Machines Market Size (US$ Mn and Thousand Units) Forecast, By HoReCa, 2017 - 2027
21.8.1. Quick-service Restaurant
21.8.1.1. Fast Food Restaurants
21.8.1.2. Cafeterias
21.8.1.3. Carryout Restaurants
21.8.2. Full-service Restaurants
21.8.2.1. Fine Dining Restaurants
21.8.2.2. Casual Dining Restaurants
21.8.2.3. Hotel & Club Foodservice
21.9. Incremental Opportunity Analysis
21.9.1. By Product
21.9.2. By Electric Drive
21.9.3. By Price Range
21.9.4. By HoReCa
22. Japan Fully Automatic Beverage Machines Market Analysis and Forecast
22.1. Country Snapshot
22.1.1. By Product
22.1.2. By Electric Drive
22.1.3. By Price Range
22.1.4. By HoReCa
22.2. Key Trends Impact Analysis
22.3. Market Share Analysis, by Top Players
22.4. Price Trend Analysis
22.4.1. Weighted Average Price
22.5. Japan Fully Automatic Beverage Machines Market Size (US$ Mn and Thousand Units) Forecast, By Product, 2017 - 2027
22.5.1. Beverage Machine
22.5.2. Beverage Vending Machine
22.6. Japan Fully Automatic Beverage Machines Market Size (US$ Mn and Thousand Units) Forecast, By Electric Drive, 2017 - 2027
22.6.1. DC Motors
22.6.2. AC Motors
22.7. Japan Fully Automatic Beverage Machines Market Size (US$ Mn and Thousand Units) Forecast, By Price Range, 2017 - 2027
22.7.1. Less than US$ 2,000
22.7.2. US$ 2,000-US$ 4,000
22.7.3. US$ 4,000-US$ 6,000
22.7.4. More than US$ 6,000
22.8. Japan Fully Automatic Beverage Machines Market Size (US$ Mn and Thousand Units) Forecast, By HoReCa, 2017 - 2027
22.8.1. Quick-service Restaurant
22.8.1.1. Fast Food Restaurants
22.8.1.2. Cafeterias
22.8.1.3. Carryout Restaurants
22.8.2. Full-service Restaurants
22.8.2.1. Fine Dining Restaurants
22.8.2.2. Casual Dining Restaurants
22.8.2.3. Hotel & Club Foodservice
22.9. Incremental Opportunity Analysis
22.9.1. By Product
22.9.2. By Electric Drive
22.9.3. By Price Range
22.9.4. By HoReCa
23. Korea Fully Automatic Beverage Machines Market Analysis and Forecast
23.1. Country Snapshot
23.1.1. By Product
23.1.2. By Electric Drive
23.1.3. By Price Range
23.1.4. By HoReCa
23.2. Key Trends Impact Analysis
23.3. Market Share Analysis, by Top Players
23.4. Price Trend Analysis
23.4.1. Weighted Average Price
23.5. Korea Fully Automatic Beverage Machines Market Size (US$ Mn and Thousand Units) Forecast, By Product, 2017 - 2027
23.5.1. Beverage Machine
23.5.2. Beverage Vending Machine
23.6. Korea Fully Automatic Beverage Machines Market Size (US$ Mn and Thousand Units) Forecast, By Electric Drive, 2017 - 2027
23.6.1. DC Motors
23.6.2. AC Motors
23.7. Korea Fully Automatic Beverage Machines Market Size (US$ Mn and Thousand Units) Forecast, By Price Range, 2017 - 2027
23.7.1. Less than US$ 2,000
23.7.2. US$ 2,000-US$ 4,000
23.7.3. US$ 4,000-US$ 6,000
23.7.4. More than US$ 6,000
23.8. Korea Fully Automatic Beverage Machines Market Size (US$ Mn and Thousand Units) Forecast, By HoReCa, 2017 - 2027
23.8.1. Quick-service Restaurant
23.8.1.1. Fast Food Restaurants
23.8.1.2. Cafeterias
23.8.1.3. Carryout Restaurants
23.8.2. Full-service Restaurants
23.8.2.1. Fine Dining Restaurants
23.8.2.2. Casual Dining Restaurants
23.8.2.3. Hotel & Club Foodservice
23.9. Incremental Opportunity Analysis
23.9.1. By Product
23.9.2. By Electric Drive
23.9.3. By Price Range
23.9.4. By HoReCa
24. Singapore Fully Automatic Beverage Machines Market Analysis and Forecast
24.1. Country Snapshot
24.1.1. By Product
24.1.2. By Electric Drive
24.1.3. By Price Range
24.1.4. By HoReCa
24.2. Key Trends Impact Analysis
24.3. Market Share Analysis, by Top Players
24.4. Price Trend Analysis
24.4.1. Weighted Average Price
24.5. Singapore Fully Automatic Beverage Machines Market Size (US$ Mn and Thousand Units) Forecast, By Product, 2017 - 2027
24.5.1. Beverage Machine
24.5.2. Beverage Vending Machine
24.6. Singapore Fully Automatic Beverage Machines Market Size (US$ Mn and Thousand Units) Forecast, By Electric Drive, 2017 - 2027
24.6.1. DC Motors
24.6.2. AC Motors
24.7. Singapore Fully Automatic Beverage Machines Market Size (US$ Mn and Thousand Units) Forecast, By Price Range, 2017 - 2027
24.7.1. Less than US$ 2,000
24.7.2. US$ 2,000-US$ 4,000
24.7.3. US$ 4,000-US$ 6,000
24.7.4. More than US$ 6,000
24.8. Singapore Fully Automatic Beverage Machines Market Size (US$ Mn and Thousand Units) Forecast, By HoReCa, 2017 - 2027
24.8.1. Quick-service Restaurant
24.8.1.1. Fast Food Restaurants
24.8.1.2. Cafeterias
24.8.1.3. Carryout Restaurants
24.8.2. Full-service Restaurants
24.8.2.1. Fine Dining Restaurants
24.8.2.2. Casual Dining Restaurants
24.8.2.3. Hotel & Club Foodservice
24.9. Incremental Opportunity Analysis
24.9.1. By Product
24.9.2. By Electric Drive
24.9.3. By Price Range
24.9.4. By HoReCa
25. Australia Fully Automatic Beverage Country Market Analysis and Forecast
25.1. Regional Snapshot
25.1.1. By Product
25.1.2. By Electric Drive
25.1.3. By Price Range
25.1.4. By HoReCa
25.2. Key Trends Impact Analysis
25.3. Market Share Analysis, by Top Players
25.4. Price Trend Analysis
25.4.1. Weighted Average Price
25.5. Australia Fully Automatic Beverage Machines Market Size (US$ Mn and Thousand Units) Forecast, By Product, 2017 - 2027
25.5.1. Beverage Machine
25.5.2. Beverage Vending Machine
25.6. Australia Fully Automatic Beverage Machines Market Size (US$ Mn and Thousand Units) Forecast, By Electric Drive, 2017 - 2027
25.6.1. DC Motors
25.6.2. AC Motors
25.7. Australia Fully Automatic Beverage Machines Market Size (US$ Mn and Thousand Units) Forecast, By Price Range, 2017 - 2027
25.7.1. Less than US$ 2,000
25.7.2. US$ 2,000-US$ 4,000
25.7.3. US$ 4,000-US$ 6,000
25.7.4. More than US$ 6,000
25.8. Australia Fully Automatic Beverage Machines Market Size (US$ Mn and Thousand Units) Forecast, By HoReCa, 2017 - 2027
25.8.1. Quick-service Restaurant
25.8.1.1. Fast Food Restaurants
25.8.1.2. Cafeterias
25.8.1.3. Carryout Restaurants
25.8.2. Full-service Restaurants
25.8.2.1. Fine Dining Restaurants
25.8.2.2. Casual Dining Restaurants
25.8.2.3. Hotel & Club Foodservice
25.9. Incremental Opportunity Analysis
25.9.1. By Product
25.9.2. By Electric Drive
25.9.3. By Price Range
25.9.4. By HoReCa
26. Malaysia Fully Automatic Beverage Machines Market Analysis and Forecast
26.1. Country Snapshot
26.1.1. By Product
26.1.2. By Electric Drive
26.1.3. By Price Range
26.1.4. By HoReCa
26.2. Key Trends Impact Analysis
26.3. Market Share Analysis, by Top Players
26.4. Price Trend Analysis
26.4.1. Weighted Average Price
26.5. Malaysia Fully Automatic Beverage Machines Market Size (US$ Mn and Thousand Units) Forecast, By Product, 2017 - 2027
26.5.1. Beverage Machine
26.5.2. Beverage Vending Machine
26.6. Malaysia Fully Automatic Beverage Machines Market Size (US$ Mn and Thousand Units) Forecast, By Electric Drive, 2017 - 2027
26.6.1. DC Motors
26.6.2. AC Motors
26.7. Malaysia Fully Automatic Beverage Machines Market Size (US$ Mn and Thousand Units) Forecast, By Price Range, 2017 - 2027
26.7.1. Less than US$ 2,000
26.7.2. US$ 2,000-US$ 4,000
26.7.3. US$ 4,000-US$ 6,000
26.7.4. More than US$ 6,000
26.8. Malaysia Fully Automatic Beverage Machines Market Size (US$ Mn and Thousand Units) Forecast, By HoReCa, 2017 - 2027
26.8.1. Quick-service Restaurant
26.8.1.1. Fast Food Restaurants
26.8.1.2. Cafeterias
26.8.1.3. Carryout Restaurants
26.8.2. Full-service Restaurants
26.8.2.1. Fine Dining Restaurants
26.8.2.2. Casual Dining Restaurants
26.8.2.3. Hotel & Club Foodservice
26.9. Incremental Opportunity Analysis
26.9.1. By Product
26.9.2. By Electric Drive
26.9.3. By Price Range
26.9.4. By HoReCa
27. Indonesia Fully Automatic Beverage Machines Market Analysis and Forecast
27.1. Country Snapshot
27.1.1. By Product
27.1.2. By Electric Drive
27.1.3. By Price Range
27.1.4. By HoReCa
27.2. Key Trends Impact Analysis
27.3. Market Share Analysis, by Top Players
27.4. Price Trend Analysis
27.4.1. Weighted Average Price
27.5. Indonesia Fully Automatic Beverage Machines Market Size (US$ Mn and Thousand Units) Forecast, By Product, 2017 - 2027
27.5.1. Beverage Machine
27.5.2. Beverage Vending Machine
27.6. Indonesia Fully Automatic Beverage Machines Market Size (US$ Mn and Thousand Units) Forecast, By Electric Drive, 2017 - 2027
27.6.1. DC Motors
27.6.2. AC Motors
27.7. Indonesia Fully Automatic Beverage Machines Market Size (US$ Mn and Thousand Units) Forecast, By Price Range, 2017 - 2027
27.7.1. Less than US$ 2,000
27.7.2. US$ 2,000-US$ 4,000
27.7.3. US$ 4,000-US$ 6,000
27.7.4. More than US$ 6,000
27.8. Indonesia Fully Automatic Beverage Machines Market Size (US$ Mn and Thousand Units) Forecast, By HoReCa, 2017 - 2027
27.8.1. Quick-service Restaurant
27.8.1.1. Fast Food Restaurants
27.8.1.2. Cafeterias
27.8.1.3. Carryout Restaurants
27.8.2. Full-service Restaurants
27.8.2.1. Fine Dining Restaurants
27.8.2.2. Casual Dining Restaurants
27.8.2.3. Hotel & Club Foodservice
27.9. Incremental Opportunity Analysis
27.9.1. By Product
27.9.2. By Electric Drive
27.9.3. By Price Range
27.9.4. By HoReCa
28. Philippines Fully Automatic Beverage Machines Market Analysis and Forecast
28.1. Country Snapshot
28.1.1. By Product
28.1.2. By Electric Drive
28.1.3. By Price Range
28.1.4. By HoReCa
28.2. Key Trends Impact Analysis
28.3. Market Share Analysis, by Top Players
28.4. Price Trend Analysis
28.4.1. Weighted Average Price
28.5. Philippines Fully Automatic Beverage Machines Market Size (US$ Mn and Thousand Units) Forecast, By Product, 2017 - 2027
28.5.1. Beverage Machine
28.5.2. Beverage Vending Machine
28.6. Philippines Fully Automatic Beverage Machines Market Size (US$ Mn and Thousand Units) Forecast, By Electric Drive, 2017 - 2027
28.6.1. DC Motors
28.6.2. AC Motors
28.7. Philippines Fully Automatic Beverage Machines Market Size (US$ Mn and Thousand Units) Forecast, By Price Range, 2017 - 2027
28.7.1. Less than US$ 2,000
28.7.2. US$ 2,000-US$ 4,000
28.7.3. US$ 4,000-US$ 6,000
28.7.4. More than US$ 6,000
28.8. Philippines Fully Automatic Beverage Machines Market Size (US$ Mn and Thousand Units) Forecast, By HoReCa, 2017 - 2027
28.8.1. Quick-service Restaurant
28.8.1.1. Fast Food Restaurants
28.8.1.2. Cafeterias
28.8.1.3. Carryout Restaurants
28.8.2. Full-service Restaurants
28.8.2.1. Fine Dining Restaurants
28.8.2.2. Casual Dining Restaurants
28.8.2.3. Hotel & Club Foodservice
28.9. Incremental Opportunity Analysis
28.9.1. By Product
28.9.2. By Electric Drive
28.9.3. By Price Range
28.9.4. By HoReCa
29. Vietnam Fully Automatic Beverage Machines Market Analysis and Forecast
29.1. Country Snapshot
29.1.1. By Product
29.1.2. By Electric Drive
29.1.3. By Price Range
29.1.4. By HoReCa
29.2. Key Trends Impact Analysis
29.3. Market Share Analysis, by Top Players
29.4. Price Trend Analysis
29.4.1. Weighted Average Price
29.5. Vietnam Fully Automatic Beverage Machines Market Size (US$ Mn and Thousand Units) Forecast, By Product, 2017 - 2027
29.5.1. Beverage Machine
29.5.2. Beverage Vending Machine
29.6. Vietnam Fully Automatic Beverage Machines Market Size (US$ Mn and Thousand Units) Forecast, By Electric Drive, 2017 - 2027
29.6.1. DC Motors
29.6.2. AC Motors
29.7. Vietnam Fully Automatic Beverage Machines Market Size (US$ Mn and Thousand Units) Forecast, By Price Range, 2017 - 2027
29.7.1. Less than US$ 2,000
29.7.2. US$ 2,000-US$ 4,000
29.7.3. US$ 4,000-US$ 6,000
29.7.4. More than US$ 6,000
29.8. Vietnam Fully Automatic Beverage Machines Market Size (US$ Mn and Thousand Units) Forecast, By HoReCa, 2017 - 2027
29.8.1. Quick-service Restaurant
29.8.1.1. Fast Food Restaurants
29.8.1.2. Cafeterias
29.8.1.3. Carryout Restaurants
29.8.2. Full-service Restaurants
29.8.2.1. Fine Dining Restaurants
29.8.2.2. Casual Dining Restaurants
29.8.2.3. Hotel & Club Foodservice
29.9. Incremental Opportunity Analysis
29.9.1. By Product
29.9.2. By Electric Drive
29.9.3. By Price Range
29.9.4. By HoReCa
30. Thailand Fully Automatic Beverage Machines Market Analysis and Forecast
30.1. Country Snapshot
30.1.1. By Product
30.1.2. By Electric Drive
30.1.3. By Price Range
30.1.4. By HoReCa
30.2. Key Trends Impact Analysis
30.3. Market Share Analysis, by Top Players
30.4. Price Trend Analysis
30.4.1. Weighted Average Price
30.5. Thailand Fully Automatic Beverage Machines Market Size (US$ Mn and Thousand Units) Forecast, By Product, 2017 - 2027
30.5.1. Beverage Machine
30.5.2. Beverage Vending Machine
30.6. Thailand Fully Automatic Beverage Machines Market Size (US$ Mn and Thousand Units) Forecast, By Electric Drive, 2017 - 2027
30.6.1. DC Motors
30.6.2. AC Motors
30.7. Thailand Fully Automatic Beverage Machines Market Size (US$ Mn and Thousand Units) Forecast, By Price Range, 2017 - 2027
30.7.1. Less than US$ 2,000
30.7.2. US$ 2,000-US$ 4,000
30.7.3. US$ 4,000-US$ 6,000
30.7.4. More than US$ 6,000
30.8. Thailand Fully Automatic Beverage Machines Market Size (US$ Mn and Thousand Units) Forecast, By HoReCa, 2017 - 2027
30.8.1. Quick-service Restaurant
30.8.1.1. Fast Food Restaurants
30.8.1.2. Cafeterias
30.8.1.3. Carryout Restaurants
30.8.2. Full-service Restaurants
30.8.2.1. Fine Dining Restaurants
30.8.2.2. Casual Dining Restaurants
30.8.2.3. Hotel & Club Foodservice
30.9. Incremental Opportunity Analysis
30.9.1. By Product
30.9.2. By Electric Drive
30.9.3. By Price Range
30.9.4. By HoReCa
31. Cambodia Fully Automatic Beverage Machines Market Analysis and Forecast
31.1. Country Snapshot
31.1.1. By Product
31.1.2. By Electric Drive
31.1.3. By Price Range
31.1.4. By HoReCa
31.2. Key Trends Impact Analysis
31.3. Market Share Analysis, by Top Players
31.4. Price Trend Analysis
31.4.1. Weighted Average Price
31.5. Cambodia Fully Automatic Beverage Machines Market Size (US$ Mn and Thousand Units) Forecast, By Product, 2017 - 2027
31.5.1. Beverage Machine
31.5.2. Beverage Vending Machine
31.6. Cambodia Fully Automatic Beverage Machines Market Size (US$ Mn and Thousand Units) Forecast, By Electric Drive, 2017 - 2027
31.6.1. DC Motors
31.6.2. AC Motors
31.7. Cambodia Fully Automatic Beverage Machines Market Size (US$ Mn and Thousand Units) Forecast, By Price Range, 2017 - 2027
31.7.1. Less than US$ 2,000
31.7.2. US$ 2,000-US$ 4,000
31.7.3. US$ 4,000-US$ 6,000
31.7.4. More than US$ 6,000
31.8. Cambodia Fully Automatic Beverage Machines Market Size (US$ Mn and Thousand Units) Forecast, By HoReCa, 2017 - 2027
31.8.1. Quick-service Restaurant
31.8.1.1. Fast Food Restaurants
31.8.1.2. Cafeterias
31.8.1.3. Carryout Restaurants
31.8.2. Full-service Restaurants
31.8.2.1. Fine Dining Restaurants
31.8.2.2. Casual Dining Restaurants
31.8.2.3. Hotel & Club Foodservice
31.9. Incremental Opportunity Analysis
31.9.1. By Product
31.9.2. By Electric Drive
31.9.3. By Price Range
31.9.4. By HoReCa
32. Myanmar Fully Automatic Beverage Machines Market Analysis and Forecast
32.1. Country Snapshot
32.1.1. By Product
32.1.2. By Electric Drive
32.1.3. By Price Range
32.1.4. By HoReCa
32.2. Key Trends Impact Analysis
32.3. Market Share Analysis, by Top Players
32.4. Price Trend Analysis
32.4.1. Weighted Average Price
32.5. Myanmar Fully Automatic Beverage Machines Market Size (US$ Mn and Thousand Units) Forecast, By Product, 2017 - 2027
32.5.1. Beverage Machine
32.5.2. Beverage Vending Machine
32.6. Myanmar Fully Automatic Beverage Machines Market Size (US$ Mn and Thousand Units) Forecast, By Electric Drive, 2017 - 2027
32.6.1. DC Motors
32.6.2. AC Motors
32.7. Myanmar Fully Automatic Beverage Machines Market Size (US$ Mn and Thousand Units) Forecast, By Price Range, 2017 - 2027
32.7.1. Less than US$ 2,000
32.7.2. US$ 2,000-US$ 4,000
32.7.3. US$ 4,000-US$ 6,000
32.7.4. More than US$ 6,000
32.8. Myanmar Fully Automatic Beverage Machines Market Size (US$ Mn and Thousand Units) Forecast, By HoReCa, 2017 - 2027
32.8.1. Quick-service Restaurant
32.8.1.1. Fast Food Restaurants
32.8.1.2. Cafeterias
32.8.1.3. Carryout Restaurants
32.8.2. Full-service Restaurants
32.8.2.1. Fine Dining Restaurants
32.8.2.2. Casual Dining Restaurants
32.8.2.3. Hotel & Club Foodservice
32.9. Incremental Opportunity Analysis
32.9.1. By Product
32.9.2. By Electric Drive
32.9.3. By Price Range
32.9.4. By HoReCa
33. Middle East & Africa Fully Automatic Beverage Machines Market Analysis and Forecast
33.1. Regional Snapshot
33.1.1. By Product
33.1.2. By Electric Drive
33.1.3. By Price Range
33.1.4. By HoReCa
33.1.5. By Country/Sub-region
33.2. Key Trends Impact Analysis
33.3. Price Trend Analysis
33.3.1. Weighted Average Price
33.4. Middle East & Africa Fully Automatic Beverage Machines Market Size (US$ Mn and Thousand Units) Forecast, By Product, 2017 - 2027
33.4.1. Beverage Machine
33.4.2. Beverage Vending Machine
33.5. Middle East & Africa Fully Automatic Beverage Machines Market Size (US$ Mn and Thousand Units) Forecast, By Electric Drive, 2017 - 2027
33.5.1. DC Motors
33.5.2. AC Motors
33.6. Middle East & Africa Fully Automatic Beverage Machines Market Size (US$ Mn and Thousand Units) Forecast, By Price Range, 2017 - 2027
33.6.1. Less than US$ 2,000
33.6.2. US$ 2,000-US$ 4,000
33.6.3. US$ 4,000-US$ 6,000
33.6.4. More than US$ 6,000
33.7. Middle East & Africa Fully Automatic Beverage Machines Market Size (US$ Mn and Thousand Units) Forecast, By HoReCa Technology, 2017 - 2027
33.7.1. Quick-service Restaurant
33.7.1.1. Fast Food Restaurants
33.7.1.2. Cafeterias
33.7.1.3. Carryout Restaurants
33.7.2. Full-service Restaurants
33.7.2.1. Fine Dining Restaurants
33.7.2.2. Casual Dining Restaurants
33.7.2.3. Hotel & Club Foodservice
33.8. Middle East & Africa Fully Automatic Beverage Machines Market Size (US$ Mn and Thousand Units) Forecast, By Country/Sub-region, 2017 - 2027
33.8.1. GCC
33.8.2. South Africa
33.8.3. Rest of MEA
33.9. Incremental Opportunity Analysis
33.9.1. By Product
33.9.2. By Electric Drive
33.9.3. By Price Range
33.9.4. By HoReCa
33.9.5. By Country/Sub-region
34. GCC Fully Automatic Beverage Machines Market Analysis and Forecast
34.1. Country Snapshot
34.1.1. By Product
34.1.2. By Electric Drive
34.1.3. By Price Range
34.1.4. By HoReCa
34.2. Key Trends Impact Analysis
34.3. Market Share Analysis, by Top Players
34.4. Price Trend Analysis
34.4.1. Weighted Average Price
34.5. GCC Fully Automatic Beverage Machines Market Size (US$ Mn and Thousand Units) Forecast, By Product, 2017 - 2027
34.5.1. Beverage Machine
34.5.2. Beverage Vending Machine
34.6. GCC Fully Automatic Beverage Machines Market Size (US$ Mn and Thousand Units) Forecast, By Electric Drive, 2017 - 2027
34.6.1. DC Motors
34.6.2. AC Motors
34.7. GCC Fully Automatic Beverage Machines Market Size (US$ Mn and Thousand Units) Forecast, By Price Range, 2017 - 2027
34.7.1. Less than US$ 2,000
34.7.2. US$ 2,000-US$ 4,000
34.7.3. US$ 4,000-US$ 6,000
34.7.4. More than US$ 6,000
34.8. GCC Fully Automatic Beverage Machines Market Size (US$ Mn and Thousand Units) Forecast, By HoReCa, 2017 - 2027
34.8.1. Quick-service Restaurant
34.8.1.1. Fast Food Restaurants
34.8.1.2. Cafeterias
34.8.1.3. Carryout Restaurants
34.8.2. Full-service Restaurants
34.8.2.1. Fine Dining Restaurants
34.8.2.2. Casual Dining Restaurants
34.8.2.3. Hotel & Club Foodservice
34.9. Incremental Opportunity Analysis
34.9.1. By Product
34.9.2. By Electric Drive
34.9.3. By Price Range
34.9.4. By HoReCa
35. South Africa Fully Automatic Beverage Machines Market Analysis and Forecast
35.1. Country Snapshot
35.1.1. By Product
35.1.2. By Electric Drive
35.1.3. By Price Range
35.1.4. By HoReCa
35.2. Key Trends Impact Analysis
35.3. Market Share Analysis, by Top Players
35.4. Price Trend Analysis
35.4.1. Weighted Average Price
35.5. South Africa Fully Automatic Beverage Machines Market Size (US$ Mn and Thousand Units) Forecast, By Product, 2017 - 2027
35.5.1. Beverage Machine
35.5.2. Beverage Vending Machine
35.6. South Africa Fully Automatic Beverage Machines Market Size (US$ Mn and Thousand Units) Forecast, By Electric Drive, 2017 - 2027
35.6.1. DC Motors
35.6.2. AC Motors
35.7. South Africa Fully Automatic Beverage Machines Market Size (US$ Mn and Thousand Units) Forecast, By Price Range, 2017 - 2027
35.7.1. Less than US$ 2,000
35.7.2. US$ 2,000-US$ 4,000
35.7.3. US$ 4,000-US$ 6,000
35.7.4. More than US$ 6,000
35.8. South Africa Fully Automatic Beverage Machines Market Size (US$ Mn and Thousand Units) Forecast, By HoReCa, 2017 - 2027
35.8.1. Quick-service Restaurant
35.8.1.1. Fast Food Restaurants
35.8.1.2. Cafeterias
35.8.1.3. Carryout Restaurants
35.8.2. Full-service Restaurants
35.8.2.1. Fine Dining Restaurants
35.8.2.2. Casual Dining Restaurants
35.8.2.3. Hotel & Club Foodservice
35.9. Incremental Opportunity Analysis
35.9.1. By Product
35.9.2. By Electric Drive
35.9.3. By Price Range
35.9.4. By HoReCa
36. South America Fully Automatic Beverage Machines Market Analysis and Forecast
36.1. Regional Snapshot
36.1.1. By Product
36.1.2. By Electric Drive
36.1.3. By Price Range
36.1.4. By HoReCa
36.1.5. By Country/Sub-region
36.2. Key Trends Impact Analysis
36.3. Price Trend Analysis
36.3.1. Weighted Average Price
36.4. South America Fully Automatic Beverage Machines Market Size (US$ Mn and Thousand Units) Forecast, By Product, 2017 - 2027
36.4.1. Beverage Machine
36.4.2. Beverage Vending Machine
36.5. South America Fully Automatic Beverage Machines Market Size (US$ Mn and Thousand Units) Forecast, By Electric Drive, 2017 - 2027
36.5.1. DC Motors
36.5.2. AC Motors
36.6. South America Fully Automatic Beverage Machines Market Size (US$ Mn and Thousand Units) Forecast, By Price Range, 2017 - 2027
36.6.1. Less than US$ 2,000
36.6.2. US$ 2,000-US$ 4,000
36.6.3. US$ 4,000-US$ 6,000
36.6.4. More than US$ 6,000
36.7. South America Fully Automatic Beverage Machines Market Size (US$ Mn and Thousand Units) Forecast, By HoReCa Technology, 2017 - 2027
36.7.1. Quick-service Restaurant
36.7.1.1. Fast Food Restaurants
36.7.1.2. Cafeterias
36.7.1.3. Carryout Restaurants
36.7.2. Full-service Restaurants
36.7.2.1. Fine Dining Restaurants
36.7.2.2. Casual Dining Restaurants
36.7.2.3. Hotel & Club Foodservice
36.8. South America Fully Automatic Beverage Machines Market Size (US$ Mn and Thousand Units) Forecast, By Country/Sub-region, 2017 - 2027
36.8.1. Brazil
36.8.2. Rest of South America
36.9. South America Incremental Opportunity Analysis
36.9.1. By Product
36.9.2. By Electric Drive
36.9.3. By Price Range
36.9.4. By HoReCa
36.9.5. By Country/Sub-region
37. Brazil Fully Automatic Beverage Machines Market Analysis and Forecast
37.1. Country Snapshot
37.1.1. By Product
37.1.2. By Electric Drive
37.1.3. By Price Range
37.1.4. By HoReCa
37.2. Key Trends Impact Analysis
37.3. Market Share Analysis, by Top Players
37.4. Price Trend Analysis
37.4.1. Weighted Average Price
37.5. Brazil Fully Automatic Beverage Machines Market Size (US$ Mn and Thousand Units) Forecast, By Product, 2017 - 2027
37.5.1. Beverage Machine
37.5.2. Beverage Vending Machine
37.6. Brazil Fully Automatic Beverage Machines Market Size (US$ Mn and Thousand Units) Forecast, By Electric Drive, 2017 - 2027
37.6.1. DC Motors
37.6.2. AC Motors
37.7. Brazil Fully Automatic Beverage Machines Market Size (US$ Mn and Thousand Units) Forecast, By Price Range, 2017 - 2027
37.7.1. Less than US$ 2,000
37.7.2. US$ 2,000-US$ 4,000
37.7.3. US$ 4,000-US$ 6,000
37.7.4. More than US$ 6,000
37.8. Brazil Fully Automatic Beverage Machines Market Size (US$ Mn and Thousand Units) Forecast, By HoReCa, 2017 - 2027
37.8.1. Quick-service Restaurant
37.8.1.1. Fast Food Restaurants
37.8.1.2. Cafeterias
37.8.1.3. Carryout Restaurants
37.8.2. Full-service Restaurants
37.8.2.1. Fine Dining Restaurants
37.8.2.2. Casual Dining Restaurants
37.8.2.3. Hotel & Club Foodservice
37.9. Incremental Opportunity Analysis
37.9.1. By Product
37.9.2. By Electric Drive
37.9.3. By Price Range
37.9.4. By HoReCa
38. Competition Landscape
38.1. Market Player – Competition Matrix
38.1.1. Brand Analysis
38.1.2. Manufacturing Base
38.2. Brand Share Analysis, By Country/Sub-region
38.3. Company Profiles for Fully Automatic Beverage Machine[(
Company Overview, Product Portfolio, Financial Information (Subject to Data Availability), Business Strategies / Recent Developments]
38.3.1. Bravilor Bonamat B.V.
38.3.1.1. Company Overview
38.3.1.2. Product Portfolio
38.3.1.3. Financial Information (Subject to Data Availability)
38.3.1.4. Business Strategies / Recent Developments
38.3.2. BSH Home Appliances Corporation
38.3.2.1. Company Overview
38.3.2.2. Product Portfolio
38.3.2.3. Financial Information (Subject to Data Availability)
38.3.2.4. Business Strategies / Recent Developments
38.3.3. De’Longhi Group
38.3.3.1. Company Overview
38.3.3.2. Product Portfolio
38.3.3.3. Financial Information (Subject to Data Availability)
38.3.3.4. Business Strategies / Recent Developments
38.3.4. Franke Holding AG
38.3.4.1. Company Overview
38.3.4.2. Product Portfolio
38.3.4.3. Financial Information (Subject to Data Availability)
38.3.4.4. Business Strategies / Recent Developments
38.3.5. Groupe SEB
38.3.5.1. Company Overview
38.3.5.2. Product Portfolio
38.3.5.3. Financial Information (Subject to Data Availability)
38.3.5.4. Business Strategies / Recent Developments
38.3.6. Gruppo Cimbali SpA
38.3.6.1. Company Overview
38.3.6.2. Product Portfolio
38.3.6.3. Financial Information (Subject to Data Availability)
38.3.6.4. Business Strategies / Recent Developments
38.3.7. JURA Elektroapparate AG
38.3.7.1. Company Overview
38.3.7.2. Product Portfolio
38.3.7.3. Financial Information (Subject to Data Availability)
38.3.7.4. Business Strategies / Recent Developments
38.3.8. N&W Global Vending S.p.A.
38.3.8.1. Company Overview
38.3.8.2. Product Portfolio
38.3.8.3. Financial Information (Subject to Data Availability)
38.3.8.4. Business Strategies / Recent Developments
38.3.9. Rex-Royal AG
38.3.9.1. Company Overview
38.3.9.2. Product Portfolio
38.3.9.3. Financial Information (Subject to Data Availability)
38.3.9.4. Business Strategies / Recent Developments
38.3.10. Wilbur Curtis Co.
38.3.10.1. Company Overview
38.3.10.2. Product Portfolio
38.3.10.3. Financial Information (Subject to Data Availability)
38.3.10.4. Business Strategies / Recent Developments
39. Company Profiles for Motors
[(Company Overview, Product Portfolio, Financial Information (Subject to Data Availability), Business Strategies / Recent Developments]
39.1.1. Aichi Electric Co., Ltd.
39.1.1.1. Company Overview
39.1.1.2. Product Portfolio
39.1.1.3. Financial Information (Subject to Data Availability)
39.1.1.4. Business Strategies / Recent Developments
39.1.2. AMETEK, Inc.
39.1.2.1. Company Overview
39.1.2.2. Product Portfolio
39.1.2.3. Financial Information (Subject to Data Availability)
39.1.2.4. Business Strategies / Recent Developments
39.1.3. Cummins Generator Technologies Limited
39.1.3.1. Company Overview
39.1.3.2. Product Portfolio
39.1.3.3. Financial Information (Subject to Data Availability)
39.1.3.4. Business Strategies / Recent Developments
39.1.4. Franklin Electric Co., Inc.
39.1.4.1. Company Overview
39.1.4.2. Product Portfolio
39.1.4.3. Financial Information (Subject to Data Availability)
39.1.4.4. Business Strategies / Recent Developments
39.1.5. Generac Holdings, Inc.
39.1.5.1. Company Overview
39.1.5.2. Product Portfolio
39.1.5.3. Financial Information (Subject to Data Availability)
39.1.5.4. Business Strategies / Recent Developments
39.1.6. Hitachi Industrial Equipment Systems Co. Ltd.
39.1.6.1. Company Overview
39.1.6.2. Product Portfolio
39.1.6.3. Financial Information (Subject to Data Availability)
39.1.6.4. Business Strategies / Recent Developments
39.1.7. Johnson Electric
39.1.7.1. Company Overview
39.1.7.2. Product Portfolio
39.1.7.3. Financial Information (Subject to Data Availability)
39.1.7.4. Business Strategies / Recent Developments
39.1.8. Nidec Sankyo Corporation
39.1.8.1. Company Overview
39.1.8.2. Product Portfolio
39.1.8.3. Financial Information (Subject to Data Availability)
39.1.8.4. Business Strategies / Recent Developments
39.1.9. Sanyo Denki Co., Ltd.
39.1.9.1. Company Overview
39.1.9.2. Product Portfolio
39.1.9.3. Financial Information (Subject to Data Availability)
39.1.9.4. Business Strategies / Recent Developments
39.1.10. Senvion GmbH
39.1.10.1. Company Overview
39.1.10.2. Product Portfolio
39.1.10.3. Financial Information (Subject to Data Availability)
39.1.10.4. Business Strategies / Recent Developments
39.1.11. TECO Electric & Machinery Co., Ltd.
39.1.11.1. Company Overview
39.1.11.2. Product Portfolio
39.1.11.3. Financial Information (Subject to Data Availability)
39.1.11.4. Business Strategies / Recent Developments
39.1.12. Toshiba International Corporation
39.1.12.1. Company Overview
39.1.12.2. Product Portfolio
39.1.12.3. Financial Information (Subject to Data Availability)
39.1.12.4. Business Strategies / Recent Developments
39.1.13. Vestas Deutschland GmbH
39.1.13.1. Company Overview
39.1.13.2. Product Portfolio
39.1.13.3. Financial Information (Subject to Data Availability)
39.1.13.4. Business Strategies / Recent Developments
39.1.14. WEG SA
39.1.14.1. Company Overview
39.1.14.2. Product Portfolio
39.1.14.3. Financial Information (Subject to Data Availability)
39.1.14.4. Business Strategies / Recent Developments
39.1.15. Welling Holding Ltd.
39.1.15.1. Company Overview
39.1.15.2. Product Portfolio
39.1.15.3. Financial Information (Subject to Data Availability)
39.1.15.4. Business Strategies / Recent Developments
40. Key Takeaways
List of Tables
Table 1: Global Fully Automatic Beverage Machines Market Volume (Thousand Units) Forecast, by Product Type, 2017-2027
Table 2: Global Fully Automatic Beverage Machines Market Value (US$ Mn) Forecast, by Product Type, 2017-2027
Table 3: Global Fully Automatic Beverage Machines Market Volume Size & Forecast, by Electric Drive, Thousand Units, 2017-2027
Table 4: Global Fully Automatic Beverage Machines Market Value (US$ Mn) Forecast, by Electric Drive, 2017-2027
Table 5: Global Fully Automatic Beverage Machines Market Volume (Thousand Units) Forecast, by Price Range, 2017-2027
Table 6: Global Fully Automatic Beverage Machines Market Value (US$ Mn) Forecast, by Price Range, 2017-2027
Table 7: Global Fully Automatic Beverage Machines Market Volume Size & Forecast, by HoReCa, Thousand Units, 2017-2027
Table 8: Global Fully Automatic Beverage Machines Market Value (US$ Mn) Forecast, by HoReCa, 2017-2027
Table 9: Global Fully Automatic Beverage Machines Market Volume (Thousand Units) Forecast, by Region , 2017-2027
Table 10: Global Fully Automatic Beverage Machines Market Volume Size & Forecast, by Region, US$ Mn, 2017-2027
Table 11: North America Fully Automatic Beverage Machines Market Volume Size & Forecast, By Product Type, Thousand Units, 2017-2027
Table 12: North America Fully Automatic Beverage Machines Market Value (US$ Mn) Forecast, by Product Type, 2017-2027
Table 13: North America Fully Automatic Beverage Machines Market Volume (Thousand Units) Forecast, by Electric Drive, 2017-2027
Table 14: North America Fully Automatic Beverage Machines Market Value (US$ Mn) Forecast, by Electric Drive, 2017-2027
Table 15: North America Fully Automatic Beverage Machines Market Volume (Thousand Units) Forecast, by Price Range, 2017-2027
Table 16: North America Fully Automatic Beverage Machines Market Value (US$ Mn) Forecast, by Price Range, 2017-2027
Table 17: North America Fully Automatic Beverage Machines Market Volume (Thousand Units) Forecast, by HoReCa, 2017-2027
Table 18: North America Fully Automatic Beverage Machines Market Value (US$ Mn) Forecast, by HoReCa, 2017-2027
Table 19: North America Fully Automatic Beverage Machines Market Volume (Thousand Units) Forecast, By Country/Sub-region, 2017-2027
Table 20: North America Fully Automatic Beverage Machines Market Value (US$ Mn) Forecast, By Country/Sub-region, 2017-2027
Table 21: U.S. Fully Automatic Beverage Machines Market Volume (Thousand Units) Forecast, By Product Type, 2017-2027
Table 22: U.S. Fully Automatic Beverage Machines Market Value (US$ Mn) Forecast, by Product Type, 2017-2027
Table 23: U.S. Fully Automatic Beverage Machines Market Volume (Thousand Units) Forecast, by Electric Drive, 2017-2027
Table 24: U.S. Fully Automatic Beverage Machines Market Value (US$ Mn) Forecast, by Electric Drive, 2017-2027
Table 25: U.S. Fully Automatic Beverage Machines Market Volume (Thousand Units) Forecast, by Price Range, 2017-2027
Table 26: U.S. Fully Automatic Beverage Machines Market Value (US$ Mn) Forecast, by Price Range, 2017-2027
Table 27: U.S. Fully Automatic Beverage Machines Market Volume (Thousand Units) Forecast, by HoReCa, 2017-2027
Table 28: U.S. Fully Automatic Beverage Machines Market Value (US$ Mn) Forecast, by HoReCa, 2017-2027
Table 29: Canada Fully Automatic Beverage Machines Market Volume Size & Forecast, By Product Type, Thousand Units, 2017-2027
Table 30: Canada Fully Automatic Beverage Machines Market Value (US$ Mn) Forecast, by Product Type, 2017-2027
Table 31: Canada Fully Automatic Beverage Machines Market Volume (Thousand Units) Forecast, by Electric Drive, 2017-2027
Table 32: Canada Fully Automatic Beverage Machines Market Value (US$ Mn) Forecast, by Electric Drive, 2017-2027
Table 33: Canada Fully Automatic Beverage Machines Market Volume (Thousand Units) Forecast, by Price Range, 2017-2027
Table 34: Canada Fully Automatic Beverage Machines Market Value (US$ Mn) Forecast, by Price Range, 2017-2027
Table 35: Canada Fully Automatic Beverage Machines Market Volume (Thousand Units) Forecast, by HoReCa, 2017-2027
Table 36: Canada Fully Automatic Beverage Machines Market Value (US$ Mn) Forecast, by HoReCa, 2017-2027
Table 37: Mexico Fully Automatic Beverage Machines Market Volume Size & Forecast, By Product Type, Thousand Units, 2017-2027
Table 38: Mexico Fully Automatic Beverage Machines Market Value (US$ Mn) Forecast, by Product Type, 2017-2027
Table 39: Mexico Fully Automatic Beverage Machines Market Volume (Thousand Units) Forecast, by Electric Drive, 2017-2027
Table 40: Mexico Fully Automatic Beverage Machines Market Value (US$ Mn) Forecast, by Electric Drive, 2017-2027
Table 41: Mexico Fully Automatic Beverage Machines Market Volume (Thousand Units) Forecast, by Price Range, 2017-2027
Table 42: Mexico Fully Automatic Beverage Machines Market Value (US$ Mn) Forecast, by Price Range, 2017-2027
Table 43: Mexico Fully Automatic Beverage Machines Market Volume (Thousand Units) Forecast, by HoReCa, 2017-2027
Table 44: Mexico Fully Automatic Beverage Machines Market Volume (Thousand Units) Forecast, by HoReCa, 2017-2027
Table 45: Europe Fully Automatic Beverage Machines Market Volume Size & Forecast, By Product Type, Thousand Units, 2017-2027
Table 46: Europe Fully Automatic Beverage Machines Market Value (US$ Mn) Forecast, by Product Type, 2017-2027
Table 47: Europe Fully Automatic Beverage Machines Market Volume (Thousand Units) Forecast, by Electric Drive, 2017-2027
Table 48: Europe Fully Automatic Beverage Machines Market Value (US$ Mn) Forecast, by Electric Drive, 2017-2027
Table 49: Europe Fully Automatic Beverage Machines Market Volume (Thousand Units) Forecast, by Price Range, 2017-2027
Table 50: Europe Fully Automatic Beverage Machines Market Value (US$ Mn) Forecast, by Price Range, 2017-2027
Table 51: Europe Fully Automatic Beverage Machines Market Volume (Thousand Units) Forecast, by HoReCa, 2017-2027
Table 52: Europe Fully Automatic Beverage Machines Market Value (US$ Mn) Forecast, by HoReCa, 2017-2027
Table 53: Europe Fully Automatic Beverage Machines Market Volume Size & Forecast, By Country/Sub-region, Thousand Units, 2017-2027
Table 54: Europe Fully Automatic Beverage Machines Market Value Size & Forecast, By Country/Sub-region, US$ Mn, 2017-2027
Table 55: U.K. Fully Automatic Beverage Machines Market Volume Size & Forecast, By Product Type, Thousand Units, 2017-2027
Table 56: U.K. Fully Automatic Beverage Machines Market Value (US$ Mn) Forecast, by Product Type, 2017-2027
Table 57: U.K. Fully Automatic Beverage Machines Market Volume (Thousand Units) Forecast, by Electric Drive, 2017-2027
Table 58: U.K. Fully Automatic Beverage Machines Market Value (US$ Mn) Forecast, by Electric Drive, 2017-2027
Table 59: U.K. Fully Automatic Beverage Machines Market Volume (Thousand Units) Forecast, by Price Range, 2017-2027
Table 60: U.K. Fully Automatic Beverage Machines Market Value (US$ Mn) Forecast, by Price Range, 2017-2027
Table 61: U.K. Fully Automatic Beverage Machines Market Volume (Thousand Units) Forecast, by HoReCa, 2017-2027
Table 62: U.K. Fully Automatic Beverage Machines Market Value (US$ Mn) Forecast, by HoReCa, 2017-2027
Table 63: Germany Fully Automatic Beverage Machines Market Volume Size & Forecast, By Product Type, Thousand Units, 2017-2027
Table 64: Germany Fully Automatic Beverage Machines Market Value (US$ Mn) Forecast, by Product Type, 2017-2027
Table 65: Germany Fully Automatic Beverage Machines Market Volume (Thousand Units) Forecast, by Electric Drive, 2017-2027
Table 66: Germany Fully Automatic Beverage Machines Market Value (US$ Mn) Forecast, by Electric Drive, 2017-2027
Table 67: Germany Fully Automatic Beverage Machines Market Volume (Thousand Units) Forecast, by Price Range, 2017-2027
Table 68: Germany Fully Automatic Beverage Machines Market Value (US$ Mn) Forecast, by Price Range, 2017-2027
Table 69: Germany Fully Automatic Beverage Machines Market Volume (Thousand Units) Forecast, by HoReCa, 2017-2027
Table 70: Germany Fully Automatic Beverage Machines Market Value (US$ Mn) Forecast, by HoReCa, 2017-2027
Table 71: France Fully Automatic Beverage Machines Market Volume Size & Forecast, By Product Type, Thousand Units, 2017-2027
Table 72: France Fully Automatic Beverage Machines Market Value (US$ Mn) Forecast, by Product Type, 2017-2027
Table 73: France Fully Automatic Beverage Machines Market Volume (Thousand Units) Forecast, by Electric Drive, 2017-2027
Table 74: France Fully Automatic Beverage Machines Market Value (US$ Mn) Forecast, by Electric Drive, 2017-2027
Table 75: France Fully Automatic Beverage Machines Market Volume (Thousand Units) Forecast, by Price Range, 2017-2027
Table 76: France Fully Automatic Beverage Machines Market Value (US$ Mn) Forecast, by Price Range, 2017-2027
Table 77: France Fully Automatic Beverage Machines Market Volume (Thousand Units) Forecast, by HoReCa, 2017-2027
Table 78: France Fully Automatic Beverage Machines Market Volume (Thousand Units) Forecast, by HoReCa, 2017-2027
Table 79: Italy Fully Automatic Beverage Machines Market Volume Size & Forecast, By Product Type, Thousand Units, 2017-2027
Table 80: Italy Fully Automatic Beverage Machines Market Value (US$ Mn) Forecast, by Product Type, 2017-2027
Table 81: Italy Fully Automatic Beverage Machines Market Volume (Thousand Units) Forecast, by Electric Drive, 2017-2027
Table 82: Italy Fully Automatic Beverage Machines Market Value (US$ Mn) Forecast, by Electric Drive, 2017-2027
Table 83: Italy Fully Automatic Beverage Machines Market Volume (Thousand Units) Forecast, by Price Range, 2017-2027
Table 84: Italy Fully Automatic Beverage Machines Market Value (US$ Mn) Forecast, by Price Range, 2017-2027
Table 85: Italy Fully Automatic Beverage Machines Market Volume (Thousand Units) Forecast, by HoReCa, 2017-2027
Table 86: Italy Fully Automatic Beverage Machines Market Value (US$ Mn) Forecast, by HoReCa, 2017-2027
Table 87: Spain Fully Automatic Beverage Machines Market Volume Size & Forecast, By Product Type, Thousand Units, 2017-2027
Table 88: Spain Fully Automatic Beverage Machines Market Value (US$ Mn) Forecast, by Product Type, 2017-2027
Table 89: Spain Fully Automatic Beverage Machines Market Volume (Thousand Units) Forecast, by Electric Drive, 2017-2027
Table 90: Spain Fully Automatic Beverage Machines Market Value (US$ Mn) Forecast, by Electric Drive, 2017-2027
Table 91: Spain Fully Automatic Beverage Machines Market Volume (Thousand Units) Forecast, by Price Range, 2017-2027
Table 92: Spain Fully Automatic Beverage Machines Market Value (US$ Mn) Forecast, by Price Range, 2017-2027
Table 93: Spain Fully Automatic Beverage Machines Market Volume (Thousand Units) Forecast, by HoReCa, 2017-2027
Table 94: Spain Fully Automatic Beverage Machines Market Volume (Thousand Units) Forecast, by HoReCa, 2017-2027
Table 95: Asia Pacific Fully Automatic Beverage Machines Market Volume Size & Forecast, By Product Type, Thousand Units, 2017-2027
Table 96: Asia Pacific Fully Automatic Beverage Machines Market Value (US$ Mn) Forecast, by Product Type, 2017-2027
Table 97: Asia Pacific Fully Automatic Beverage Machines Market Volume (Thousand Units) Forecast, by Electric Drive, 2017-2027
Table 98: Asia Pacific Fully Automatic Beverage Machines Market Value (US$ Mn) Forecast, by Electric Drive, 2017-2027
Table 99: Asia Pacific Fully Automatic Beverage Machines Market Volume (Thousand Units) Forecast, by Price Range, 2017-2027
Table 100: Asia Pacific Fully Automatic Beverage Machines Market Value (US$ Mn) Forecast, by Price Range, 2017-2027
Table 101: Asia Pacific Fully Automatic Beverage Machines Market Volume (Thousand Units) Forecast, by HoReCa, 2017-2027
Table 102: Asia Pacific Fully Automatic Beverage Machines Market Value (US$ Mn) Forecast, by HoReCa, 2017-2027
Table 103: Asia Pacific Fully Automatic Beverage Machines Market Volume Size & Forecast, By Country/Sub-region, Thousand Units, 2017-2027
Table 104: Asia Pacific Fully Automatic Beverage Machines Market Value Size & Forecast, By Country/Sub-region, US$ Mn, 2017-2027
Table 105: China Fully Automatic Beverage Machines Market Volume Size & Forecast, By Product Type, Thousand Units, 2017-2027
Table 106: China Fully Automatic Beverage Machines Market Value (US$ Mn) Forecast, by Product Type, 2017-2027
Table 107: China Fully Automatic Beverage Machines Market Volume (Thousand Units) Forecast, by Electric Drive, 2017-2027
Table 108: China Fully Automatic Beverage Machines Market Value (US$ Mn) Forecast, by Electric Drive, 2017-2027
Table 109: China Fully Automatic Beverage Machines Market Volume (Thousand Units) Forecast, by Price Range, 2017-2027
Table 110: China Fully Automatic Beverage Machines Market Value (US$ Mn) Forecast, by Price Range, 2017-2027
Table 111: China Fully Automatic Beverage Machines Market Volume (Thousand Units) Forecast, by HoReCa, 2017-2027
Table 112: China Fully Automatic Beverage Machines Market Value (US$ Mn) Forecast, by HoReCa, 2017-2027
Table 113: Japan Fully Automatic Beverage Machines Market Volume Size & Forecast, By Product Type, Thousand Units, 2017-2027
Table 114: Japan Fully Automatic Beverage Machines Market Value (US$ Mn) Forecast, by Product Type, 2017-2027
Table 115: Japan Fully Automatic Beverage Machines Market Volume (Thousand Units) Forecast, by Electric Drive, 2017-2027
Table 116: Japan Fully Automatic Beverage Machines Market Value (US$ Mn) Forecast, by Electric Drive, 2017-2027
Table 117: Japan Fully Automatic Beverage Machines Market Volume (Thousand Units) Forecast, by Price Range, 2017-2027
Table 118: Japan Fully Automatic Beverage Machines Market Value (US$ Mn) Forecast, by Price Range, 2017-2027
Table 119: Japan Fully Automatic Beverage Machines Market Volume (Thousand Units) Forecast, by HoReCa, 2017-2027
Table 120: Japan Fully Automatic Beverage Machines Market Value (US$ Mn) Forecast, by HoReCa, 2017-2027
Table 121: Korea Fully Automatic Beverage Machines Market Volume Size & Forecast, By Product Type, Thousand Units, 2017-2027
Table 122: Korea Fully Automatic Beverage Machines Market Value (US$ Mn) Forecast, by Product Type, 2017-2027
Table 123: Korea Fully Automatic Beverage Machines Market Volume (Thousand Units) Forecast, by Electric Drive, 2017-2027
Table 124: Korea Fully Automatic Beverage Machines Market Value (US$ Mn) Forecast, by Electric Drive, 2017-2027
Table 125: Korea Fully Automatic Beverage Machines Market Volume (Thousand Units) Forecast, by Price Range, 2017-2027
Table 126: Korea Fully Automatic Beverage Machines Market Value (US$ Mn) Forecast, by Price Range, 2017-2027
Table 127: Korea Fully Automatic Beverage Machines Market Volume (Thousand Units) Forecast, by HoReCa, 2017-2027
Table 128: Korea Fully Automatic Beverage Machines Market Volume (Thousand Units) Forecast, by HoReCa, 2017-2027
Table 129: Singapore Fully Automatic Beverage Machines Market Volume Size & Forecast, By Product Type, Thousand Units, 2017-2027
Table 130: Singapore Fully Automatic Beverage Machines Market Value (US$ Mn) Forecast, by Product Type, 2017-2027
Table 131: Singapore Fully Automatic Beverage Machines Market Volume (Thousand Units) Forecast, by Electric Drive, 2017-2027
Table 132: Singapore Fully Automatic Beverage Machines Market Value (US$ Mn) Forecast, by Electric Drive, 2017-2027
Table 133: Singapore Fully Automatic Beverage Machines Market Volume (Thousand Units) Forecast, by Price Range, 2017-2027
Table 134: Singapore Fully Automatic Beverage Machines Market Value (US$ Mn) Forecast, by Price Range, 2017-2027
Table 135: Singapore Fully Automatic Beverage Machines Market Volume (Thousand Units) Forecast, by HoReCa, 2017-2027
Table 136: Singapore Fully Automatic Beverage Machines Market Value (US$ Mn) Forecast, by HoReCa, 2017-2027
Table 137: Australia Fully Automatic Beverage Machines Market Volume Size & Forecast, By Product Type, Thousand Units, 2017-2027
Table 138: Australia Fully Automatic Beverage Machines Market Value (US$ Mn) Forecast, by Product Type, 2017-2027
Table 139: Australia Fully Automatic Beverage Machines Market Volume (Thousand Units) Forecast, by Electric Drive, 2017-2027
Table 140: Australia Fully Automatic Beverage Machines Market Value (US$ Mn) Forecast, by Electric Drive, 2017-2027
Table 141: Australia Fully Automatic Beverage Machines Market Volume (Thousand Units) Forecast, by Price Range, 2017-2027
Table 142: Australia Fully Automatic Beverage Machines Market Value (US$ Mn) Forecast, by Price Range, 2017-2027
Table 143: Australia Fully Automatic Beverage Machines Market Volume (Thousand Units) Forecast, by HoReCa, 2017-2027
Table 144: Australia Fully Automatic Beverage Machines Market Volume (Thousand Units) Forecast, by HoReCa, 2017-2027
Table 145: Malaysia Fully Automatic Beverage Machines Market Volume Size & Forecast, By Product Type, Thousand Units, 2017-2027
Table 146: Malaysia Fully Automatic Beverage Machines Market Value (US$ Mn) Forecast, by Product Type, 2017-2027
Table 147: Malaysia Fully Automatic Beverage Machines Market Volume (Thousand Units) Forecast, by Electric Drive, 2017-2027
Table 148: Malaysia Fully Automatic Beverage Machines Market Value (US$ Mn) Forecast, by Electric Drive, 2017-2027
Table 149: Malaysia Fully Automatic Beverage Machines Market Volume (Thousand Units) Forecast, by Price Range, 2017-2027
Table 150: Malaysia Fully Automatic Beverage Machines Market Value (US$ Mn) Forecast, by Price Range, 2017-2027
Table 151: Malaysia Fully Automatic Beverage Machines Market Volume (Thousand Units) Forecast, by HoReCa, 2017-2027
Table 152: Malaysia Fully Automatic Beverage Machines Market Value (US$ Mn) Forecast, by HoReCa, 2017-2027
Table 153: Indonesia Fully Automatic Beverage Machines Market Volume Size & Forecast, By Product Type, Thousand Units, 2017-2027
Table 154: Indonesia Fully Automatic Beverage Machines Market Value (US$ Mn) Forecast, by Product Type, 2017-2027
Table 155: Indonesia Fully Automatic Beverage Machines Market Volume (Thousand Units) Forecast, by Electric Drive, 2017-2027
Table 156: Indonesia Fully Automatic Beverage Machines Market Value (US$ Mn) Forecast, by Electric Drive, 2017-2027
Table 157: Indonesia Fully Automatic Beverage Machines Market Volume (Thousand Units) Forecast, by Price Range, 2017-2027
Table 158: Indonesia Fully Automatic Beverage Machines Market Value (US$ Mn) Forecast, by Price Range, 2017-2027
Table 159: Indonesia Fully Automatic Beverage Machines Market Volume (Thousand Units) Forecast, by HoReCa, 2017-2027
Table 160: Indonesia Fully Automatic Beverage Machines Market Volume (Thousand Units) Forecast, by HoReCa, 2017-2027
Table 161: Philippines Fully Automatic Beverage Machines Market Volume Size & Forecast, By Product Type, Thousand Units, 2017-2027
Table 162: Philippines Fully Automatic Beverage Machines Market Value (US$ Mn) Forecast, by Product Type, 2017-2027
Table 163: Philippines Fully Automatic Beverage Machines Market Volume (Thousand Units) Forecast, by Electric Drive, 2017-2027
Table 164: Philippines Fully Automatic Beverage Machines Market Value (US$ Mn) Forecast, by Electric Drive, 2017-2027
Table 165: Philippines Fully Automatic Beverage Machines Market Volume (Thousand Units) Forecast, by Price Range, 2017-2027
Table 166: Philippines Fully Automatic Beverage Machines Market Value (US$ Mn) Forecast, by Price Range, 2017-2027
Table 167: Philippines Fully Automatic Beverage Machines Market Volume (Thousand Units) Forecast, by HoReCa, 2017-2027
Table 168: Philippines Fully Automatic Beverage Machines Market Value (US$ Mn) Forecast, by HoReCa, 2017-2027
Table 169: Vietnam Fully Automatic Beverage Machines Market Volume Size & Forecast, By Product Type, Thousand Units, 2017-2027
Table 170: Vietnam Fully Automatic Beverage Machines Market Value (US$ Mn) Forecast, by Product Type, 2017-2027
Table 171: Vietnam Fully Automatic Beverage Machines Market Volume (Thousand Units) Forecast, by Electric Drive, 2017-2027
Table 172: Vietnam Fully Automatic Beverage Machines Market Value (US$ Mn) Forecast, by Electric Drive, 2017-2027
Table 173: Vietnam Fully Automatic Beverage Machines Market Volume (Thousand Units) Forecast, by Price Range, 2017-2027
Table 174: Vietnam Fully Automatic Beverage Machines Market Value (US$ Mn) Forecast, by Price Range, 2017-2027
Table 175: Vietnam Fully Automatic Beverage Machines Market Volume (Thousand Units) Forecast, by HoReCa, 2017-2027
Table 176: Vietnam Fully Automatic Beverage Machines Market Value (US$ Mn) Forecast, by HoReCa, 2017-2027
Table 177: Thailand Fully Automatic Beverage Machines Market Volume Size & Forecast, By Product Type, Thousand Units, 2017-2027
Table 178: Thailand Fully Automatic Beverage Machines Market Value (US$ Mn) Forecast, by Product Type, 2017-2027
Table 179: Thailand Fully Automatic Beverage Machines Market Volume (Thousand Units) Forecast, by Electric Drive, 2017-2027
Table 180: Thailand Fully Automatic Beverage Machines Market Value (US$ Mn) Forecast, by Electric Drive, 2017-2027
Table 181: Thailand Fully Automatic Beverage Machines Market Volume (Thousand Units) Forecast, by Price Range, 2017-2027
Table 182: Thailand Fully Automatic Beverage Machines Market Value (US$ Mn) Forecast, by Price Range, 2017-2027
Table 183: Thailand Fully Automatic Beverage Machines Market Volume (Thousand Units) Forecast, by HoReCa, 2017-2027
Table 184: Thailand Fully Automatic Beverage Machines Market Volume (Thousand Units) Forecast, by HoReCa, 2017-2027
Table 185: Cambodia Fully Automatic Beverage Machines Market Volume Size & Forecast, By Product Type, Thousand Units, 2017-2027
Table 186: Cambodia Fully Automatic Beverage Machines Market Value (US$ Mn) Forecast, by Product Type, 2017-2027
Table 187: Cambodia Fully Automatic Beverage Machines Market Volume (Thousand Units) Forecast, by Electric Drive, 2017-2027
Table 188: Cambodia Fully Automatic Beverage Machines Market Value (US$ Mn) Forecast, by Electric Drive, 2017-2027
Table 189: Cambodia Fully Automatic Beverage Machines Market Volume (Thousand Units) Forecast, by Price Range, 2017-2027
Table 190: Cambodia Fully Automatic Beverage Machines Market Value (US$ Mn) Forecast, by Price Range, 2017-2027
Table 191: Cambodia Fully Automatic Beverage Machines Market Volume (Thousand Units) Forecast, by HoReCa, 2017-2027
Table 192: Cambodia Fully Automatic Beverage Machines Market Value (US$ Mn) Forecast, by HoReCa, 2017-2027
Table 193: Myanmar Fully Automatic Beverage Machines Market Volume Size & Forecast, By Product Type, Thousand Units, 2017-2027
Table 194: Myanmar Fully Automatic Beverage Machines Market Value (US$ Mn) Forecast, by Product Type, 2017-2027
Table 195: Myanmar Fully Automatic Beverage Machines Market Volume (Thousand Units) Forecast, by Electric Drive, 2017-2027
Table 196: Myanmar Fully Automatic Beverage Machines Market Value (US$ Mn) Forecast, by Electric Drive, 2017-2027
Table 197: Myanmar Fully Automatic Beverage Machines Market Volume (Thousand Units) Forecast, by Price Range, 2017-2027
Table 198: Myanmar Fully Automatic Beverage Machines Market Value (US$ Mn) Forecast, by Price Range, 2017-2027
Table 199: Myanmar Fully Automatic Beverage Machines Market Volume (Thousand Units) Forecast, by HoReCa, 2017-2027
Table 200: Myanmar Fully Automatic Beverage Machines Market Value (US$ Mn) Forecast, by HoReCa, 2017-2027
Table 201: Middle East & Africa Fully Automatic Beverage Machines Market Volume Size & Forecast, By Product Type, Thousand Units, 2017-2027
Table 202: Middle East & Africa Fully Automatic Beverage Machines Market Value (US$ Mn) Forecast, by Product Type, 2017-2027
Table 203: Middle East & Africa Fully Automatic Beverage Machines Market Volume (Thousand Units) Forecast, by Electric Drive, 2017-2027
Table 204: Middle East & Africa Fully Automatic Beverage Machines Market Value (US$ Mn) Forecast, by Electric Drive, 2017-2027
Table 205: Middle East & Africa Fully Automatic Beverage Machines Market Volume (Thousand Units) Forecast, by Price Range, 2017-2027
Table 206: Middle East & Africa Fully Automatic Beverage Machines Market Value (US$ Mn) Forecast, by Price Range, 2017-2027
Table 207: Middle East & Africa Fully Automatic Beverage Machines Market Volume (Thousand Units) Forecast, by HoReCa, 2017-2027
Table 208: Middle East & Africa Fully Automatic Beverage Machines Market Value (US$ Mn) Forecast, by HoReCa, 2017-2027
Table 209: Middle East & Africa Fully Automatic Beverage Machines Market Volume Size & Forecast, By Country/Sub-region, Thousand Units, 2017-2027
Table 210: Middle East & Africa Fully Automatic Beverage Machines Market Value Size & Forecast, By Country/Sub-region, US$ Mn, 2017-2027
Table 211: GCC Fully Automatic Beverage Machines Market Volume Size & Forecast, By Product Type, Thousand Units, 2017-2027
Table 212: GCC Fully Automatic Beverage Machines Market Value (US$ Mn) Forecast, by Product Type, 2017-2027
Table 213: GCC Fully Automatic Beverage Machines Market Volume (Thousand Units) Forecast, by Electric Drive, 2017-2027
Table 214: GCC Fully Automatic Beverage Machines Market Value (US$ Mn) Forecast, by Electric Drive, 2017-2027
Table 215: GCC Fully Automatic Beverage Machines Market Volume (Thousand Units) Forecast, by Price Range, 2017-2027
Table 216: GCC Fully Automatic Beverage Machines Market Value (US$ Mn) Forecast, by Price Range, 2017-2027
Table 217: GCC Fully Automatic Beverage Machines Market Volume (Thousand Units) Forecast, by HoReCa, 2017-2027
Table 218: GCC Fully Automatic Beverage Machines Market Value (US$ Mn) Forecast, by HoReCa, 2017-2027
Table 219: South Africa Fully Automatic Beverage Machines Market Volume Size & Forecast, By Product Type, Thousand Units, 2017-2027
Table 220: South Africa Fully Automatic Beverage Machines Market Value (US$ Mn) Forecast, by Product Type, 2017-2027
Table 221: South Africa Fully Automatic Beverage Machines Market Volume (Thousand Units) Forecast, by Electric Drive, 2017-2027
Table 222: South Africa Fully Automatic Beverage Machines Market Value (US$ Mn) Forecast, by Electric Drive, 2017-2027
Table 223: South Africa Fully Automatic Beverage Machines Market Volume (Thousand Units) Forecast, by Price Range, 2017-2027
Table 224: South Africa Fully Automatic Beverage Machines Market Value (US$ Mn) Forecast, by Price Range, 2017-2027
Table 225: South Africa Fully Automatic Beverage Machines Market Volume (Thousand Units) Forecast, by HoReCa, 2017-2027
Table 226: South Africa Fully Automatic Beverage Machines Market Value (US$ Mn) Forecast, by HoReCa, 2017-2027
Table 227: South America Fully Automatic Beverage Machines Market Volume Size & Forecast, By Product Type, Thousand Units, 2017-2027
Table 228: South America Fully Automatic Beverage Machines Market Value (US$ Mn) Forecast, by Product Type, 2017-2027
Table 229: South America Fully Automatic Beverage Machines Market Volume (Thousand Units) Forecast, by Electric Drive, 2017-2027
Table 230: South America Fully Automatic Beverage Machines Market Value (US$ Mn) Forecast, by Electric Drive, 2017-2027
Table 231: South America Fully Automatic Beverage Machines Market Volume (Thousand Units) Forecast, by Price Range, 2017-2027
Table 232: South America Fully Automatic Beverage Machines Market Value (US$ Mn) Forecast, by Price Range, 2017-2027
Table 233: South America Fully Automatic Beverage Machines Market Volume (Thousand Units) Forecast, by HoReCa, 2017-2027
Table 234: South America Fully Automatic Beverage Machines Market Value (US$ Mn) Forecast, by HoReCa, 2017-2027
Table 235: South America Fully Automatic Beverage Machines Market Volume Size & Forecast, By Country/Sub-region, Thousand Units, 2017-2027
Table 236: South America Fully Automatic Beverage Machines Market Value Size & Forecast, By Country/Sub-region, US$ Mn, 2017-2027
Table 237: Brazil Fully Automatic Beverage Machines Market Volume Size & Forecast, By Product Type, Thousand Units, 2017-2027
Table 238: Brazil Fully Automatic Beverage Machines Market Value (US$ Mn) Forecast, by Product Type, 2017-2027
Table 239: Brazil Fully Automatic Beverage Machines Market Volume (Thousand Units) Forecast, by Electric Drive, 2017-2027
Table 240: Brazil Fully Automatic Beverage Machines Market Value (US$ Mn) Forecast, by Electric Drive, 2017-2027
Table 241: Brazil Fully Automatic Beverage Machines Market Volume (Thousand Units) Forecast, by Price Range, 2017-2027
Table 242: Brazil Fully Automatic Beverage Machines Market Value (US$ Mn) Forecast, by Price Range, 2017-2027
Table 243: Brazil Fully Automatic Beverage Machines Market Volume (Thousand Units) Forecast, by HoReCa, 2017-2027
Table 244: Brazil Fully Automatic Beverage Machines Market Value (US$ Mn) Forecast, by HoReCa, 2017-2027
List of Figures
Fig 1: Global Fully Automatic Beverage Machines Market Volume (Thousand Units) Forecast, by Product Type, 2017-2027
Fig 2: Global Fully Automatic Beverage Machines Market Value (US$ Mn) Forecast, by Product Type, 2017-2027
Fig 3: Global Fully Automatic Beverage Machines Market Incremental Opportunity, by Product Type, 2019-2027
Fig 4: Global Fully Automatic Beverage Machines Market Volume (Thousand Units) Forecast, by Electric Drive, 2017-2027
Fig 5: Global Fully Automatic Beverage Machines Market Value (US$ Mn) Forecast, by Electric Drive, 2017-2027
Fig 6: Global Fully Automatic Beverage Machines Market Incremental Opportunity, by Electric Drive, 2019-2027
Fig 7: Global Fully Automatic Beverage Machines Market Volume (Thousand Units) Forecast, by Price Range, 2017-2027
Fig 8: Global Fully Automatic Beverage Machines Market Value (US$ Mn) Forecast, by Price Range, 2017-2027
Fig 9: Global Fully Automatic Beverage Machines Market Incremental Opportunity, by Price Range, 2019-2027
Fig 10: Global Fully Automatic Beverage Machines Market Volume (Thousand Units) Forecast, by HoReCa, 2017-2027
Fig 11: Global Fully Automatic Beverage Machines Market Value (US$ Mn) Forecast, by HoReCa, 2017-2027
Fig 12: Global Fully Automatic Beverage Machines Market Incremental Opportunity, by HoReCa, 2019-2027
Fig 13: Global Fully Automatic Beverage Machines Market Volume (Thousand Units) Forecast, by Region, 2017-2027
Fig 14: Global Fully Automatic Beverage Machines Market Value (US$ Mn) Forecast, by Region, 2017-2027
Fig 15: Global Fully Automatic Beverage Machines Market Incremental Opportunity, by Region, 2019-2027
Fig 16: North America Fully Automatic Beverage Machines Market Volume (Thousand Units) Forecast, by Product Type, 2017-2027
Fig 17: North America Fully Automatic Beverage Machines Market Value (US$ Mn) Forecast, by Product Type, 2017-2027
Fig 18: North America Fully Automatic Beverage Machines Market Incremental Opportunity, by Product Type, 2019-2027
Fig 19: North America Fully Automatic Beverage Machines Market Volume (Thousand Units) Forecast, by Electric Drive, 2017-2027
Fig 20: North America Fully Automatic Beverage Machines Market Value (US$ Mn) Forecast, by Electric Drive, 2017-2027
Fig 21: North America Fully Automatic Beverage Machines Market Incremental Opportunity, by Electric Drive, 2019-2027
Fig 22: North America Fully Automatic Beverage Machines Market Volume (Thousand Units) Forecast, by Price Range, 2017-2027
Fig 23: North America Fully Automatic Beverage Machines Market Value (US$ Mn) Forecast, by Price Range, 2017-2027
Fig 24: North America Fully Automatic Beverage Machines Market Incremental Opportunity, by Price Range, 2019-2027
Fig 25: North America Fully Automatic Beverage Machines Market Volume (Thousand Units) Forecast, by HoReCa, 2017-2027
Fig 26: North America Fully Automatic Beverage Machines Market Value (US$ Mn) Forecast, by HoReCa, 2017-2027
Fig 27: North America Fully Automatic Beverage Machines Market Incremental Opportunity, by HoReCa, 2019-2027
Fig 28: North America Fully Automatic Beverage Machines Market Projections By Country/Sub-region, Thousand Units, 2017-2027
Fig 29: North America Fully Automatic Beverage Machines Market Projections By Country/Sub-region, US$ Mn, 2017-2027
Fig 30: North America Fully Automatic Beverage Machines Market, Incremental Opportunity, By Country/Sub-region, US$ Mn
Fig 31: U.S. Fully Automatic Beverage Machines Market Volume (Thousand Units) Forecast, by Product Type, 2017-2027
Fig 32: U.S. Fully Automatic Beverage Machines Market Value (US$ Mn) Forecast, by Product Type, 2017-2027
Fig 33: U.S. Fully Automatic Beverage Machines Market Incremental Opportunity, by Product Type, 2019-2027
Fig 34: U.S. Fully Automatic Beverage Machines Market Volume (Thousand Units) Forecast, by Electric Drive, 2017-2027
Fig 35: U.S. Fully Automatic Beverage Machines Market Value (US$ Mn) Forecast, by Electric Drive, 2017-2027
Fig 36: U.S. Fully Automatic Beverage Machines Market Incremental Opportunity, by Electric Drive, 2019-2027
Fig 37: U.S. Fully Automatic Beverage Machines Market Volume (Thousand Units) Forecast, by Price Range, 2017-2027
Fig 38: U.S. Fully Automatic Beverage Machines Market Value (US$ Mn) Forecast, by Price Range, 2017-2027
Fig 39: U.S. Fully Automatic Beverage Machines Market Incremental Opportunity, by Price Range, 2019-2027
Fig 40: U.S. Fully Automatic Beverage Machines Market Volume (Thousand Units) Forecast, by HoReCa, 2017-2027
Fig 41: U.S. Fully Automatic Beverage Machines Market Value (US$ Mn) Forecast, by HoReCa, 2017-2027
Fig 42: U.S. Fully Automatic Beverage Machines Market Incremental Opportunity, by HoReCa, 2019-2027
Fig 43: Canada Fully Automatic Beverage Machines Market Volume (Thousand Units) Forecast, by Product Type, 2017-2027
Fig 44: Canada Fully Automatic Beverage Machines Market Value (US$ Mn) Forecast, by Product Type, 2017-2027
Fig 45: Canada Fully Automatic Beverage Machines Market Incremental Opportunity, by Product Type, 2019-2027
Fig 46: Canada Fully Automatic Beverage Machines Market Volume (Thousand Units) Forecast, by Electric Drive, 2017-2027
Fig 47: Canada Fully Automatic Beverage Machines Market Value (US$ Mn) Forecast, by Electric Drive, 2017-2027
Fig 48: Canada Fully Automatic Beverage Machines Market Incremental Opportunity, by Electric Drive, 2019-2027
Fig 49: Canada Fully Automatic Beverage Machines Market Volume (Thousand Units) Forecast, by Price Range, 2017-2027
Fig 50: Canada Fully Automatic Beverage Machines Market Value (US$ Mn) Forecast, by Price Range, 2017-2027
Fig 51: Canada Fully Automatic Beverage Machines Market Incremental Opportunity, by Price Range, 2019-2027
Fig 52: Canada Fully Automatic Beverage Machines Market Volume (Thousand Units) Forecast, by HoReCa, 2017-2027
Fig 53: Canada Fully Automatic Beverage Machines Market Value (US$ Mn) Forecast, by HoReCa, 2017-2027
Fig 54: Canada Fully Automatic Beverage Machines Market Incremental Opportunity, by HoReCa, 2019-2027
Fig 55: Mexico Fully Automatic Beverage Machines Market Volume (Thousand Units) Forecast, by Product Type, 2017-2027
Fig 56: Mexico Fully Automatic Beverage Machines Market Value (US$ Mn) Forecast, by Product Type, 2017-2027
Fig 57: Mexico Fully Automatic Beverage Machines Market Incremental Opportunity, by Product Type, 2019-2027
Fig 58: Mexico Fully Automatic Beverage Machines Market Volume (Thousand Units) Forecast, by Electric Drive, 2017-2027
Fig 59: Mexico Fully Automatic Beverage Machines Market Value (US$ Mn) Forecast, by Electric Drive, 2017-2027
Fig 60: Mexico Fully Automatic Beverage Machines Market Incremental Opportunity, by Electric Drive, 2019-2027
Fig 61: Mexico Fully Automatic Beverage Machines Market Volume (Thousand Units) Forecast, by Price Range, 2017-2027
Fig 62: Mexico Fully Automatic Beverage Machines Market Value (US$ Mn) Forecast, by Price Range, 2017-2027
Fig 63: Mexico Fully Automatic Beverage Machines Market Incremental Opportunity, by Price Range, 2019-2027
Fig 64: Mexico Fully Automatic Beverage Machines Market Volume (Thousand Units) Forecast, by HoReCa, 2017-2027
Fig 65: Mexico Fully Automatic Beverage Machines Market Value (US$ Mn) Forecast, by HoReCa, 2017-2027
Fig 66: Mexico Fully Automatic Beverage Machines Market Incremental Opportunity, by HoReCa, 2019-2027
Fig 67: Europe Fully Automatic Beverage Machines Market Volume (Thousand Units) Forecast, by Product Type, 2017-2027
Fig 68: Europe Fully Automatic Beverage Machines Market Value (US$ Mn) Forecast, by Product Type, 2017-2027
Fig 69: Europe Fully Automatic Beverage Machines Market Incremental Opportunity, by Product Type, 2019-2027
Fig 70: Europe Fully Automatic Beverage Machines Market Volume (Thousand Units) Forecast, by Electric Drive, 2017-2027
Fig 71: Europe Fully Automatic Beverage Machines Market Value (US$ Mn) Forecast, by Electric Drive, 2017-2027
Fig 72: Europe Fully Automatic Beverage Machines Market Incremental Opportunity, by Electric Drive, 2019-2027
Fig 73: Europe Fully Automatic Beverage Machines Market Volume (Thousand Units) Forecast, by Price Range, 2017-2027
Fig 74: Europe Fully Automatic Beverage Machines Market Value (US$ Mn) Forecast, by Price Range, 2017-2027
Fig 75: Europe Fully Automatic Beverage Machines Market Incremental Opportunity, by Price Range, 2019-2027
Fig 76: Europe Fully Automatic Beverage Machines Market Volume (Thousand Units) Forecast, by HoReCa, 2017-2027
Fig 77: Europe Fully Automatic Beverage Machines Market Value (US$ Mn) Forecast, by HoReCa, 2017-2027
Fig 78: Europe Fully Automatic Beverage Machines Market Incremental Opportunity, by HoReCa, 2019-2027
Fig 79: Europe Fully Automatic Beverage Machines Market Projections By Country/Sub-region, Thousand Units, 2017-2027
Fig 80: Europe Fully Automatic Beverage Machines Market Projections By Country/Sub-region, US$ Mn, 2017-2027
Fig 81: Europe Fully Automatic Beverage Machines Market, Incremental Opportunity, By Country/Sub-region, US$ Mn
Fig 82: U.K. Fully Automatic Beverage Machines Market Volume (Thousand Units) Forecast, by Product Type, 2017-2027
Fig 83: U.K. Fully Automatic Beverage Machines Market Value (US$ Mn) Forecast, by Product Type, 2017-2027
Fig 84: U.K. Fully Automatic Beverage Machines Market Incremental Opportunity, by Product Type, 2019-2027
Fig 85: U.K. Fully Automatic Beverage Machines Market Volume (Thousand Units) Forecast, by Electric Drive, 2017-2027
Fig 86: U.K. Fully Automatic Beverage Machines Market Value (US$ Mn) Forecast, by Electric Drive, 2017-2027
Fig 87: U.K. Fully Automatic Beverage Machines Market Incremental Opportunity, by Electric Drive, 2019-2027
Fig 88: U.K. Fully Automatic Beverage Machines Market Volume (Thousand Units) Forecast, by Price Range, 2017-2027
Fig 89: U.K. Fully Automatic Beverage Machines Market Value (US$ Mn) Forecast, by Price Range, 2017-2027
Fig 90: U.K. Fully Automatic Beverage Machines Market Incremental Opportunity, by Price Range, 2019-2027
Fig 91: U.K. Fully Automatic Beverage Machines Market Volume (Thousand Units) Forecast, by HoReCa, 2017-2027
Fig 92: U.K. Fully Automatic Beverage Machines Market Value (US$ Mn) Forecast, by HoReCa, 2017-2027
Fig 93: U.K. Fully Automatic Beverage Machines Market Incremental Opportunity, by HoReCa, 2019-2027
Fig 94: Germany Fully Automatic Beverage Machines Market Volume (Thousand Units) Forecast, by Product Type, 2017-2027
Fig 95: Germany Fully Automatic Beverage Machines Market Value (US$ Mn) Forecast, by Product Type, 2017-2027
Fig 96: Germany Fully Automatic Beverage Machines Market Incremental Opportunity, by Product Type, 2019-2027
Fig 97: Germany Fully Automatic Beverage Machines Market Volume (Thousand Units) Forecast, by Electric Drive, 2017-2027
Fig 98: Germany Fully Automatic Beverage Machines Market Value (US$ Mn) Forecast, by Electric Drive, 2017-2027
Fig 99: Germany Fully Automatic Beverage Machines Market Incremental Opportunity, by Electric Drive, 2019-2027
Fig 100: Germany Fully Automatic Beverage Machines Market Volume (Thousand Units) Forecast, by Price Range, 2017-2027
Fig 101: Germany Fully Automatic Beverage Machines Market Value (US$ Mn) Forecast, by Price Range, 2017-2027
Fig 102: Germany Fully Automatic Beverage Machines Market Incremental Opportunity, by Price Range, 2019-2027
Fig 103: Germany Fully Automatic Beverage Machines Market Volume (Thousand Units) Forecast, by HoReCa, 2017-2027
Fig 104: Germany Fully Automatic Beverage Machines Market Value (US$ Mn) Forecast, by HoReCa, 2017-2027
Fig 105: Germany Fully Automatic Beverage Machines Market Incremental Opportunity, by HoReCa, 2019-2027
Fig 106: France Fully Automatic Beverage Machines Market Volume (Thousand Units) Forecast, by Product Type, 2017-2027
Fig 107: France Fully Automatic Beverage Machines Market Value (US$ Mn) Forecast, by Product Type, 2017-2027
Fig 108: France Fully Automatic Beverage Machines Market Incremental Opportunity, by Product Type, 2019-2027
Fig 109: France Fully Automatic Beverage Machines Market Volume (Thousand Units) Forecast, by Electric Drive, 2017-2027
Fig 110: France Fully Automatic Beverage Machines Market Value (US$ Mn) Forecast, by Electric Drive, 2017-2027
Fig 111: France Fully Automatic Beverage Machines Market Incremental Opportunity, by Electric Drive, 2019-2027
Fig 112: France Fully Automatic Beverage Machines Market Volume (Thousand Units) Forecast, by Price Range, 2017-2027
Fig 113: France Fully Automatic Beverage Machines Market Value (US$ Mn) Forecast, by Price Range, 2017-2027
Fig 114: France Fully Automatic Beverage Machines Market Incremental Opportunity, by Price Range, 2019-2027
Fig 115: France Fully Automatic Beverage Machines Market Volume (Thousand Units) Forecast, by HoReCa, 2017-2027
Fig 116: France Fully Automatic Beverage Machines Market Value (US$ Mn) Forecast, by HoReCa, 2017-2027
Fig 117: France Fully Automatic Beverage Machines Market Incremental Opportunity, by HoReCa, 2019-2027
Fig 118: Italy Fully Automatic Beverage Machines Market Volume (Thousand Units) Forecast, by Product Type, 2017-2027
Fig 119: Italy Fully Automatic Beverage Machines Market Value (US$ Mn) Forecast, by Product Type, 2017-2027
Fig 120: Italy Fully Automatic Beverage Machines Market Incremental Opportunity, by Product Type, 2019-2027
Fig 121: Italy Fully Automatic Beverage Machines Market Volume (Thousand Units) Forecast, by Electric Drive, 2017-2027
Fig 122: Italy Fully Automatic Beverage Machines Market Value (US$ Mn) Forecast, by Electric Drive, 2017-2027
Fig 123: Italy Fully Automatic Beverage Machines Market Incremental Opportunity, by Electric Drive, 2019-2027
Fig 124: Italy Fully Automatic Beverage Machines Market Volume (Thousand Units) Forecast, by Price Range, 2017-2027
Fig 125: Italy Fully Automatic Beverage Machines Market Value (US$ Mn) Forecast, by Price Range, 2017-2027
Fig 126: Italy Fully Automatic Beverage Machines Market Incremental Opportunity, by Price Range, 2019-2027
Fig 127: Italy Fully Automatic Beverage Machines Market Volume (Thousand Units) Forecast, by HoReCa, 2017-2027
Fig 128: Italy Fully Automatic Beverage Machines Market Value (US$ Mn) Forecast, by HoReCa, 2017-2027
Fig 129: Italy Fully Automatic Beverage Machines Market Incremental Opportunity, by HoReCa, 2019-2027
Fig 130: Spain Fully Automatic Beverage Machines Market Volume (Thousand Units) Forecast, by Product Type, 2017-2027
Fig 131: Spain Fully Automatic Beverage Machines Market Value (US$ Mn) Forecast, by Product Type, 2017-2027
Fig 132: Spain Fully Automatic Beverage Machines Market Incremental Opportunity, by Product Type, 2019-2027
Fig 133: Spain Fully Automatic Beverage Machines Market Volume (Thousand Units) Forecast, by Electric Drive, 2017-2027
Fig 134: Spain Fully Automatic Beverage Machines Market Value (US$ Mn) Forecast, by Electric Drive, 2017-2027
Fig 135: Spain Fully Automatic Beverage Machines Market Incremental Opportunity, by Electric Drive, 2019-2027
Fig 136: Spain Fully Automatic Beverage Machines Market Volume (Thousand Units) Forecast, by Price Range, 2017-2027
Fig 137: Spain Fully Automatic Beverage Machines Market Value (US$ Mn) Forecast, by Price Range, 2017-2027
Fig 138: Spain Fully Automatic Beverage Machines Market Incremental Opportunity, by Price Range, 2019-2027
Fig 139: Spain Fully Automatic Beverage Machines Market Volume (Thousand Units) Forecast, by HoReCa, 2017-2027
Fig 140: Spain Fully Automatic Beverage Machines Market Value (US$ Mn) Forecast, by HoReCa, 2017-2027
Fig 141: Spain Fully Automatic Beverage Machines Market Incremental Opportunity, by HoReCa, 2019-2027
Fig 142: Asia Pacific Fully Automatic Beverage Machines Market Volume (Thousand Units) Forecast, by Product Type, 2017-2027
Fig 143: Asia Pacific Fully Automatic Beverage Machines Market Value (US$ Mn) Forecast, by Product Type, 2017-2027
Fig 144: Asia Pacific Fully Automatic Beverage Machines Market Incremental Opportunity, by Product Type, 2019-2027
Fig 145: Asia Pacific Fully Automatic Beverage Machines Market Volume (Thousand Units) Forecast, by Electric Drive, 2017-2027
Fig 146: Asia Pacific Fully Automatic Beverage Machines Market Value (US$ Mn) Forecast, by Electric Drive, 2017-2027
Fig 147: Asia Pacific Fully Automatic Beverage Machines Market Incremental Opportunity, by Electric Drive, 2019-2027
Fig 148: Asia Pacific Fully Automatic Beverage Machines Market Volume (Thousand Units) Forecast, by Price Range, 2017-2027
Fig 149: Asia Pacific Fully Automatic Beverage Machines Market Value (US$ Mn) Forecast, by Price Range, 2017-2027
Fig 150: Asia Pacific Fully Automatic Beverage Machines Market Incremental Opportunity, by Price Range, 2019-2027
Fig 151: Asia Pacific Fully Automatic Beverage Machines Market Volume (Thousand Units) Forecast, by HoReCa, 2017-2027
Fig 152: Asia Pacific Fully Automatic Beverage Machines Market Value (US$ Mn) Forecast, by HoReCa, 2017-2027
Fig 153: Asia Pacific Fully Automatic Beverage Machines Market Incremental Opportunity, by HoReCa, 2019-2027
Fig 154: Asia Pacific Fully Automatic Beverage Machines Market Projections By Country/Sub-region, Thousand Units, 2017-2027
Fig 155: Asia Pacific Fully Automatic Beverage Machines Market Projections By Country/Sub-region, US$ Mn, 2017-2027
Fig 156: Asia Pacific Fully Automatic Beverage Machines Market, Incremental Opportunity, By Country/Sub-region, US$ Mn
Fig 157: China Fully Automatic Beverage Machines Market Volume (Thousand Units) Forecast, by Product Type, 2017-2027
Fig 158: China Fully Automatic Beverage Machines Market Value (US$ Mn) Forecast, by Product Type, 2017-2027
Fig 159: China Fully Automatic Beverage Machines Market Incremental Opportunity, by Product Type, 2019-2027
Fig 160: China Fully Automatic Beverage Machines Market Volume (Thousand Units) Forecast, by Electric Drive, 2017-2027
Fig 161: China Fully Automatic Beverage Machines Market Value (US$ Mn) Forecast, by Electric Drive, 2017-2027
Fig 162: China Fully Automatic Beverage Machines Market Incremental Opportunity, by Electric Drive, 2019-2027
Fig 163: China Fully Automatic Beverage Machines Market Volume (Thousand Units) Forecast, by Price Range, 2017-2027
Fig 164: China Fully Automatic Beverage Machines Market Value (US$ Mn) Forecast, by Price Range, 2017-2027
Fig 165: China Fully Automatic Beverage Machines Market Incremental Opportunity, by Price Range, 2019-2027
Fig 166: China Fully Automatic Beverage Machines Market Volume (Thousand Units) Forecast, by HoReCa, 2017-2027
Fig 167: China Fully Automatic Beverage Machines Market Value (US$ Mn) Forecast, by HoReCa, 2017-2027
Fig 168: China Fully Automatic Beverage Machines Market Incremental Opportunity, by HoReCa, 2019-2027
Fig 169: Japan Fully Automatic Beverage Machines Market Volume (Thousand Units) Forecast, by Product Type, 2017-2027
Fig 170: Japan Fully Automatic Beverage Machines Market Value (US$ Mn) Forecast, by Product Type, 2017-2027
Fig 171: Japan Fully Automatic Beverage Machines Market Incremental Opportunity, by Product Type, 2019-2027
Fig 172: Japan Fully Automatic Beverage Machines Market Volume (Thousand Units) Forecast, by Electric Drive, 2017-2027
Fig 173: Japan Fully Automatic Beverage Machines Market Value (US$ Mn) Forecast, by Electric Drive, 2017-2027
Fig 174: Japan Fully Automatic Beverage Machines Market Incremental Opportunity, by Electric Drive, 2019-2027
Fig 175: Japan Fully Automatic Beverage Machines Market Volume (Thousand Units) Forecast, by Price Range, 2017-2027
Fig 176: Japan Fully Automatic Beverage Machines Market Value (US$ Mn) Forecast, by Price Range, 2017-2027
Fig 177: Japan Fully Automatic Beverage Machines Market Incremental Opportunity, by Price Range, 2019-2027
Fig 178: Japan Fully Automatic Beverage Machines Market Volume (Thousand Units) Forecast, by HoReCa, 2017-2027
Fig 179: Japan Fully Automatic Beverage Machines Market Value (US$ Mn) Forecast, by HoReCa, 2017-2027
Fig 180: Japan Fully Automatic Beverage Machines Market Incremental Opportunity, by HoReCa, 2019-2027
Fig 181: Korea Fully Automatic Beverage Machines Market Volume (Thousand Units) Forecast, by Product Type, 2017-2027
Fig 182: Korea Fully Automatic Beverage Machines Market Value (US$ Mn) Forecast, by Product Type, 2017-2027
Fig 183: Korea Fully Automatic Beverage Machines Market Incremental Opportunity, by Product Type, 2019-2027
Fig 184: Korea Fully Automatic Beverage Machines Market Volume (Thousand Units) Forecast, by Electric Drive, 2017-2027
Fig 185: Korea Fully Automatic Beverage Machines Market Value (US$ Mn) Forecast, by Electric Drive, 2017-2027
Fig 186: Korea Fully Automatic Beverage Machines Market Incremental Opportunity, by Electric Drive, 2019-2027
Fig 187: Korea Fully Automatic Beverage Machines Market Volume (Thousand Units) Forecast, by Price Range, 2017-2027
Fig 188: Korea Fully Automatic Beverage Machines Market Value (US$ Mn) Forecast, by Price Range, 2017-2027
Fig 189: Korea Fully Automatic Beverage Machines Market Incremental Opportunity, by Price Range, 2019-2027
Fig 190: Korea Fully Automatic Beverage Machines Market Volume (Thousand Units) Forecast, by HoReCa, 2017-2027
Fig 191: Korea Fully Automatic Beverage Machines Market Value (US$ Mn) Forecast, by HoReCa, 2017-2027
Fig 192: Korea Fully Automatic Beverage Machines Market Incremental Opportunity, by HoReCa, 2019-2027
Fig 193: Singapore Fully Automatic Beverage Machines Market Volume (Thousand Units) Forecast, by Product Type, 2017-2027
Fig 194: Singapore Fully Automatic Beverage Machines Market Value (US$ Mn) Forecast, by Product Type, 2017-2027
Fig 195: Singapore Fully Automatic Beverage Machines Market Incremental Opportunity, by Product Type, 2019-2027
Fig 196: Singapore Fully Automatic Beverage Machines Market Volume (Thousand Units) Forecast, by Electric Drive, 2017-2027
Fig 197: Singapore Fully Automatic Beverage Machines Market Value (US$ Mn) Forecast, by Electric Drive, 2017-2027
Fig 198: Singapore Fully Automatic Beverage Machines Market Incremental Opportunity, by Electric Drive, 2019-2027
Fig 199: Singapore Fully Automatic Beverage Machines Market Volume (Thousand Units) Forecast, by Price Range, 2017-2027
Fig 200: Singapore Fully Automatic Beverage Machines Market Value (US$ Mn) Forecast, by Price Range, 2017-2027
Fig 201: Singapore Fully Automatic Beverage Machines Market Incremental Opportunity, by Price Range, 2019-2027
Fig 202: Singapore Fully Automatic Beverage Machines Market Volume (Thousand Units) Forecast, by HoReCa, 2017-2027
Fig 203: Singapore Fully Automatic Beverage Machines Market Value (US$ Mn) Forecast, by HoReCa, 2017-2027
Fig 204: Singapore Fully Automatic Beverage Machines Market Incremental Opportunity, by HoReCa, 2019-2027
Fig 205: Australia Fully Automatic Beverage Machines Market Volume (Thousand Units) Forecast, by Product Type, 2017-2027
Fig 206: Australia Fully Automatic Beverage Machines Market Value (US$ Mn) Forecast, by Product Type, 2017-2027
Fig 207: Australia Fully Automatic Beverage Machines Market Incremental Opportunity, by Product Type, 2019-2027
Fig 208: Australia Fully Automatic Beverage Machines Market Volume (Thousand Units) Forecast, by Electric Drive, 2017-2027
Fig 209: Australia Fully Automatic Beverage Machines Market Value (US$ Mn) Forecast, by Electric Drive, 2017-2027
Fig 210: Australia Fully Automatic Beverage Machines Market Incremental Opportunity, by Electric Drive, 2019-2027
Fig 211: Australia Fully Automatic Beverage Machines Market Volume (Thousand Units) Forecast, by Price Range, 2017-2027
Fig 212: Australia Fully Automatic Beverage Machines Market Value (US$ Mn) Forecast, by Price Range, 2017-2027
Fig 213: Australia Fully Automatic Beverage Machines Market Incremental Opportunity, by Price Range, 2019-2027
Fig 214: Australia Fully Automatic Beverage Machines Market Volume (Thousand Units) Forecast, by HoReCa, 2017-2027
Fig 215: Australia Fully Automatic Beverage Machines Market Value (US$ Mn) Forecast, by HoReCa, 2017-2027
Fig 216: Australia Fully Automatic Beverage Machines Market Incremental Opportunity, by HoReCa, 2019-2027
Fig 217: Malaysia Fully Automatic Beverage Machines Market Volume (Thousand Units) Forecast, by Product Type, 2017-2027
Fig 218: Malaysia Fully Automatic Beverage Machines Market Value (US$ Mn) Forecast, by Product Type, 2017-2027
Fig 219: Malaysia Fully Automatic Beverage Machines Market Incremental Opportunity, by Product Type, 2019-2027
Fig 220: Malaysia Fully Automatic Beverage Machines Market Volume (Thousand Units) Forecast, by Electric Drive, 2017-2027
Fig 221: Malaysia Fully Automatic Beverage Machines Market Value (US$ Mn) Forecast, by Electric Drive, 2017-2027
Fig 222: Malaysia Fully Automatic Beverage Machines Market Incremental Opportunity, by Electric Drive, 2019-2027
Fig 223: Malaysia Fully Automatic Beverage Machines Market Volume (Thousand Units) Forecast, by Price Range, 2017-2027
Fig 224: Malaysia Fully Automatic Beverage Machines Market Value (US$ Mn) Forecast, by Price Range, 2017-2027
Fig 225: Malaysia Fully Automatic Beverage Machines Market Incremental Opportunity, by Price Range, 2019-2027
Fig 226: Malaysia Fully Automatic Beverage Machines Market Volume (Thousand Units) Forecast, by HoReCa, 2017-2027
Fig 227: Malaysia Fully Automatic Beverage Machines Market Value (US$ Mn) Forecast, by HoReCa, 2017-2027
Fig 228: Malaysia Fully Automatic Beverage Machines Market Incremental Opportunity, by HoReCa, 2019-2027
Fig 229: Indonesia Fully Automatic Beverage Machines Market Volume (Thousand Units) Forecast, by Product Type, 2017-2027
Fig 230: Indonesia Fully Automatic Beverage Machines Market Value (US$ Mn) Forecast, by Product Type, 2017-2027
Fig 231: Indonesia Fully Automatic Beverage Machines Market Incremental Opportunity, by Product Type, 2019-2027
Fig 232: Indonesia Fully Automatic Beverage Machines Market Volume (Thousand Units) Forecast, by Electric Drive, 2017-2027
Fig 233: Indonesia Fully Automatic Beverage Machines Market Value (US$ Mn) Forecast, by Electric Drive, 2017-2027
Fig 234: Indonesia Fully Automatic Beverage Machines Market Incremental Opportunity, by Electric Drive, 2019-2027
Fig 235: Indonesia Fully Automatic Beverage Machines Market Volume (Thousand Units) Forecast, by Price Range, 2017-2027
Fig 236: Indonesia Fully Automatic Beverage Machines Market Value (US$ Mn) Forecast, by Price Range, 2017-2027
Fig 237: Indonesia Fully Automatic Beverage Machines Market Incremental Opportunity, by Price Range, 2019-2027
Fig 238: Indonesia Fully Automatic Beverage Machines Market Volume (Thousand Units) Forecast, by HoReCa, 2017-2027
Fig 239: Indonesia Fully Automatic Beverage Machines Market Value (US$ Mn) Forecast, by HoReCa, 2017-2027
Fig 240: Indonesia Fully Automatic Beverage Machines Market Incremental Opportunity, by HoReCa, 2019-2027
Fig 241: Philippines Fully Automatic Beverage Machines Market Volume (Thousand Units) Forecast, by Product Type, 2017-2027
Fig 242: Philippines Fully Automatic Beverage Machines Market Value (US$ Mn) Forecast, by Product Type, 2017-2027
Fig 243: Philippines Fully Automatic Beverage Machines Market Incremental Opportunity, by Product Type, 2019-2027
Fig 244: Philippines Fully Automatic Beverage Machines Market Volume (Thousand Units) Forecast, by Electric Drive, 2017-2027
Fig 245: Philippines Fully Automatic Beverage Machines Market Value (US$ Mn) Forecast, by Electric Drive, 2017-2027
Fig 246: Philippines Fully Automatic Beverage Machines Market Incremental Opportunity, by Electric Drive, 2019-2027
Fig 247: Philippines Fully Automatic Beverage Machines Market Volume (Thousand Units) Forecast, by Price Range, 2017-2027
Fig 248: Philippines Fully Automatic Beverage Machines Market Value (US$ Mn) Forecast, by Price Range, 2017-2027
Fig 249: Philippines Fully Automatic Beverage Machines Market Incremental Opportunity, by Price Range, 2019-2027
Fig 250: Philippines Fully Automatic Beverage Machines Market Volume (Thousand Units) Forecast, by HoReCa, 2017-2027
Fig 251: Philippines Fully Automatic Beverage Machines Market Value (US$ Mn) Forecast, by HoReCa, 2017-2027
Fig 252: Philippines Fully Automatic Beverage Machines Market Incremental Opportunity, by HoReCa, 2019-2027
Fig 253: Vietnam Fully Automatic Beverage Machines Market Volume (Thousand Units) Forecast, by Product Type, 2017-2027
Fig 254: Vietnam Fully Automatic Beverage Machines Market Value (US$ Mn) Forecast, by Product Type, 2017-2027
Fig 255: Vietnam Fully Automatic Beverage Machines Market Incremental Opportunity, by Product Type, 2019-2027
Fig 256: Vietnam Fully Automatic Beverage Machines Market Volume (Thousand Units) Forecast, by Electric Drive, 2017-2027
Fig 257: Vietnam Fully Automatic Beverage Machines Market Value (US$ Mn) Forecast, by Electric Drive, 2017-2027
Fig 258: Vietnam Fully Automatic Beverage Machines Market Incremental Opportunity, by Electric Drive, 2019-2027
Fig 259: Vietnam Fully Automatic Beverage Machines Market Volume (Thousand Units) Forecast, by Price Range, 2017-2027
Fig 260: Vietnam Fully Automatic Beverage Machines Market Value (US$ Mn) Forecast, by Price Range, 2017-2027
Fig 261: Vietnam Fully Automatic Beverage Machines Market Incremental Opportunity, by Price Range, 2019-2027
Fig 262: Vietnam Fully Automatic Beverage Machines Market Volume (Thousand Units) Forecast, by HoReCa, 2017-2027
Fig 263: Vietnam Fully Automatic Beverage Machines Market Value (US$ Mn) Forecast, by HoReCa, 2017-2027
Fig 264: Vietnam Fully Automatic Beverage Machines Market Incremental Opportunity, by HoReCa, 2019-2027
Fig 265: Thailand Fully Automatic Beverage Machines Market Volume (Thousand Units) Forecast, by Product Type, 2017-2027
Fig 266: Thailand Fully Automatic Beverage Machines Market Value (US$ Mn) Forecast, by Product Type, 2017-2027
Fig 267: Thailand Fully Automatic Beverage Machines Market Incremental Opportunity, by Product Type, 2019-2027
Fig 268: Thailand Fully Automatic Beverage Machines Market Volume (Thousand Units) Forecast, by Electric Drive, 2017-2027
Fig 269: Thailand Fully Automatic Beverage Machines Market Value (US$ Mn) Forecast, by Electric Drive, 2017-2027
Fig 270: Thailand Fully Automatic Beverage Machines Market Incremental Opportunity, by Electric Drive, 2019-2027
Fig 271: Thailand Fully Automatic Beverage Machines Market Volume (Thousand Units) Forecast, by Price Range, 2017-2027
Fig 272: Thailand Fully Automatic Beverage Machines Market Value (US$ Mn) Forecast, by Price Range, 2017-2027
Fig 273: Thailand Fully Automatic Beverage Machines Market Incremental Opportunity, by Price Range, 2019-2027
Fig 274: Thailand Fully Automatic Beverage Machines Market Volume (Thousand Units) Forecast, by HoReCa, 2017-2027
Fig 275: Thailand Fully Automatic Beverage Machines Market Value (US$ Mn) Forecast, by HoReCa, 2017-2027
Fig 276: Thailand Fully Automatic Beverage Machines Market Incremental Opportunity, by HoReCa, 2019-2027
Fig 277: Cambodia Fully Automatic Beverage Machines Market Volume (Thousand Units) Forecast, by Product Type, 2017-2027
Fig 278: Cambodia Fully Automatic Beverage Machines Market Value (US$ Mn) Forecast, by Product Type, 2017-2027
Fig 279: Cambodia Fully Automatic Beverage Machines Market Incremental Opportunity, by Product Type, 2019-2027
Fig 280: Cambodia Fully Automatic Beverage Machines Market Volume (Thousand Units) Forecast, by Electric Drive, 2017-2027
Fig 281: Cambodia Fully Automatic Beverage Machines Market Value (US$ Mn) Forecast, by Electric Drive, 2017-2027
Fig 282: Cambodia Fully Automatic Beverage Machines Market Incremental Opportunity, by Electric Drive, 2019-2027
Fig 283: Cambodia Fully Automatic Beverage Machines Market Volume (Thousand Units) Forecast, by Price Range, 2017-2027
Fig 284: Cambodia Fully Automatic Beverage Machines Market Value (US$ Mn) Forecast, by Price Range, 2017-2027
Fig 285: Cambodia Fully Automatic Beverage Machines Market Incremental Opportunity, by Price Range, 2019-2027
Fig 286: Cambodia Fully Automatic Beverage Machines Market Volume (Thousand Units) Forecast, by HoReCa, 2017-2027
Fig 287: Cambodia Fully Automatic Beverage Machines Market Value (US$ Mn) Forecast, by HoReCa, 2017-2027
Fig 288: Cambodia Fully Automatic Beverage Machines Market Incremental Opportunity, by HoReCa, 2019-2027
Fig 289: Myanmar Fully Automatic Beverage Machines Market Volume (Thousand Units) Forecast, by Product Type, 2017-2027
Fig 290: Myanmar Fully Automatic Beverage Machines Market Value (US$ Mn) Forecast, by Product Type, 2017-2027
Fig 291: Myanmar Fully Automatic Beverage Machines Market Incremental Opportunity, by Product Type, 2019-2027
Fig 292: Myanmar Fully Automatic Beverage Machines Market Volume (Thousand Units) Forecast, by Electric Drive, 2017-2027
Fig 293: Myanmar Fully Automatic Beverage Machines Market Value (US$ Mn) Forecast, by Electric Drive, 2017-2027
Fig 294: Myanmar Fully Automatic Beverage Machines Market Incremental Opportunity, by Electric Drive, 2019-2027
Fig 295: Myanmar Fully Automatic Beverage Machines Market Volume (Thousand Units) Forecast, by Price Range, 2017-2027
Fig 296: Myanmar Fully Automatic Beverage Machines Market Value (US$ Mn) Forecast, by Price Range, 2017-2027
Fig 297: Myanmar Fully Automatic Beverage Machines Market Incremental Opportunity, by Price Range, 2019-2027
Fig 298: Myanmar Fully Automatic Beverage Machines Market Volume (Thousand Units) Forecast, by HoReCa, 2017-2027
Fig 299: Myanmar Fully Automatic Beverage Machines Market Value (US$ Mn) Forecast, by HoReCa, 2017-2027
Fig 300: Myanmar Fully Automatic Beverage Machines Market Incremental Opportunity, by HoReCa, 2019-2027
Fig 301: Middle East & Africa Fully Automatic Beverage Machines Market Value (US$ Mn) Forecast, by Product Type, 2017-2027
Fig 302: Middle East & Africa Fully Automatic Beverage Machines Market Volume (Thousand Units) Forecast, by Product Type, 2017-2027
Fig 303: Middle East & Africa Fully Automatic Beverage Machines Market Incremental Opportunity, by Product Type, 2019-2027
Fig 304: Middle East & Africa Fully Automatic Beverage Machines Market Volume (Thousand Units) Forecast, by Electric Drive, 2017-2027
Fig 305: Middle East & Africa Fully Automatic Beverage Machines Market Value (US$ Mn) Forecast, by Electric Drive, 2017-2027
Fig 306: Middle East & Africa Fully Automatic Beverage Machines Market Incremental Opportunity, by Electric Drive, 2019-2027
Fig 307: Middle East & Africa Fully Automatic Beverage Machines Market Volume (Thousand Units) Forecast, by Price Range, 2017-2027
Fig 308: Middle East & Africa Fully Automatic Beverage Machines Market Value (US$ Mn) Forecast, by Price Range, 2017-2027
Fig 309: Middle East & Africa Fully Automatic Beverage Machines Market Incremental Opportunity, by Price Range, 2019-2027
Fig 310: Middle East & Africa Fully Automatic Beverage Machines Market Volume (Thousand Units) Forecast, by HoReCa, 2017-2027
Fig 311: Middle East & Africa Fully Automatic Beverage Machines Market Value (US$ Mn) Forecast, by HoReCa, 2017-2027
Fig 312: Middle East & Africa Fully Automatic Beverage Machines Market Incremental Opportunity, by HoReCa, 2019-2027
Fig 313: Middle East & Africa Fully Automatic Beverage Machines Market Projections By Country/Sub-region, Thousand Units, 2017-2027
Fig 314: Middle East & Africa Fully Automatic Beverage Machines Market Projections By Country/Sub-region, US$ Mn, 2017-2027
Fig 315: Middle East & Africa Fully Automatic Beverage Machines Market, Incremental Opportunity, By Country/Sub-region, US$ Mn
Fig 316: GCC Fully Automatic Beverage Machines Market Volume (Thousand Units) Forecast, by Product Type, 2017-2027
Fig 317: GCC Fully Automatic Beverage Machines Market Value (US$ Mn) Forecast, by Product Type, 2017-2027
Fig 318: GCC Fully Automatic Beverage Machines Market Incremental Opportunity, by Product Type, 2019-2027
Fig 319: GCC Fully Automatic Beverage Machines Market Volume (Thousand Units) Forecast, by Electric Drive, 2017-2027
Fig 320: GCC Fully Automatic Beverage Machines Market Value (US$ Mn) Forecast, by Electric Drive, 2017-2027
Fig 321: GCC Fully Automatic Beverage Machines Market Incremental Opportunity, by Electric Drive, 2019-2027
Fig 322: GCC Fully Automatic Beverage Machines Market Volume (Thousand Units) Forecast, by Price Range, 2017-2027
Fig 323: GCC Fully Automatic Beverage Machines Market Value (US$ Mn) Forecast, by Price Range, 2017-2027
Fig 324: GCC Fully Automatic Beverage Machines Market Incremental Opportunity, by Price Range, 2019-2027
Fig 325: GCC Fully Automatic Beverage Machines Market Volume (Thousand Units) Forecast, by HoReCa, 2017-2027
Fig 326: GCC Fully Automatic Beverage Machines Market Value (US$ Mn) Forecast, by HoReCa, 2017-2027
Fig 327: GCC Fully Automatic Beverage Machines Market Incremental Opportunity, by HoReCa, 2019-2027
Fig 328: South Africa Fully Automatic Beverage Machines Market Volume (Thousand Units) Forecast, by Product Type, 2017-2027
Fig 329: South Africa Fully Automatic Beverage Machines Market Value (US$ Mn) Forecast, by Product Type, 2017-2027
Fig 330: South Africa Fully Automatic Beverage Machines Market Incremental Opportunity, by Product Type, 2019-2027
Fig 331: South Africa Fully Automatic Beverage Machines Market Volume (Thousand Units) Forecast, by Electric Drive, 2017-2027
Fig 332: South Africa Fully Automatic Beverage Machines Market Value (US$ Mn) Forecast, by Electric Drive, 2017-2027
Fig 333: South Africa Fully Automatic Beverage Machines Market Incremental Opportunity, by Electric Drive, 2019-2027
Fig 334: South Africa Fully Automatic Beverage Machines Market Volume (Thousand Units) Forecast, by Price Range, 2017-2027
Fig 335: South Africa Fully Automatic Beverage Machines Market Value (US$ Mn) Forecast, by Price Range, 2017-2027
Fig 336: South Africa Fully Automatic Beverage Machines Market Incremental Opportunity, by Price Range, 2019-2027
Fig 337: South Africa Fully Automatic Beverage Machines Market Volume (Thousand Units) Forecast, by HoReCa, 2017-2027
Fig 338: South Africa Fully Automatic Beverage Machines Market Value (US$ Mn) Forecast, by HoReCa, 2017-2027
Fig 339: South Africa Fully Automatic Beverage Machines Market Incremental Opportunity, by HoReCa, 2019-2027
Fig 340: South America Fully Automatic Beverage Machines Market Value (US$ Mn) Forecast, by Product Type, 2017-2027
Fig 341: South America Fully Automatic Beverage Machines Market Volume (Thousand Units) Forecast, by Product Type, 2017-2027
Fig 342: South America Fully Automatic Beverage Machines Market Incremental Opportunity, by Product Type, 2019-2027
Fig 343: South America Fully Automatic Beverage Machines Market Volume (Thousand Units) Forecast, by Electric Drive, 2017-2027
Fig 344: South America Fully Automatic Beverage Machines Market Value (US$ Mn) Forecast, by Electric Drive, 2017-2027
Fig 345: South America Fully Automatic Beverage Machines Market Incremental Opportunity, by Electric Drive, 2019-2027
Fig 346: South America Fully Automatic Beverage Machines Market Volume (Thousand Units) Forecast, by Price Range, 2017-2027
Fig 347: South America Fully Automatic Beverage Machines Market Value (US$ Mn) Forecast, by Price Range, 2017-2027
Fig 348: South America Fully Automatic Beverage Machines Market Incremental Opportunity, by Price Range, 2019-2027
Fig 349: South America Fully Automatic Beverage Machines Market Volume (Thousand Units) Forecast, by HoReCa, 2017-2027
Fig 350: South America Fully Automatic Beverage Machines Market Value (US$ Mn) Forecast, by HoReCa, 2017-2027
Fig 351: South America Fully Automatic Beverage Machines Market Incremental Opportunity, by HoReCa, 2019-2027
Fig 352: South America Fully Automatic Beverage Machines Market Projections By Country/Sub-region, Thousand Units, 2017-2027
Fig 353: South America Fully Automatic Beverage Machines Market Projections By Country/Sub-region, US$ Mn, 2017-2027
Fig 354: South America Fully Automatic Beverage Machines Market, Incremental Opportunity, By Country/Sub-region, US$ Mn
Fig 355: Brazil Fully Automatic Beverage Machines Market Volume (Thousand Units) Forecast, by Product Type, 2017-2027
Fig 356: Brazil Fully Automatic Beverage Machines Market Value (US$ Mn) Forecast, by Product Type, 2017-2027
Fig 357: Brazil Fully Automatic Beverage Machines Market Incremental Opportunity, by Product Type, 2019-2027
Fig 358: Brazil Fully Automatic Beverage Machines Market Volume (Thousand Units) Forecast, by Electric Drive, 2017-2027
Fig 359: Brazil Fully Automatic Beverage Machines Market Value (US$ Mn) Forecast, by Electric Drive, 2017-2027
Fig 360: Brazil Fully Automatic Beverage Machines Market Incremental Opportunity, by Electric Drive, 2019-2027
Fig 361: Brazil Fully Automatic Beverage Machines Market Volume (Thousand Units) Forecast, by Price Range, 2017-2027
Fig 362: Brazil Fully Automatic Beverage Machines Market Value (US$ Mn) Forecast, by Price Range, 2017-2027
Fig 363: Brazil Fully Automatic Beverage Machines Market Incremental Opportunity, by Price Range, 2019-2027
Fig 364: Brazil Fully Automatic Beverage Machines Market Volume (Thousand Units) Forecast, by HoReCa, 2017-2027
Fig 365: Brazil Fully Automatic Beverage Machines Market Value (US$ Mn) Forecast, by HoReCa, 2017-2027
Fig 366: Brazil Fully Automatic Beverage Machines Market Incremental Opportunity, by HoReCa, 2019-2027
Copyright © Transparency Market Research, Inc. All Rights reserved
Trust Online

Fully Automatic Beverage Machines Market