
Reports
Reports
The bike manufacturing industry continues to grow as manufacturers come up with new designs that meet the expectations of modern consumers. In addition, the availability of more sophisticated components is allowing manufacturers to create superior products. Folding bikes are compact and easy to transport. Folding bikes take up less space compared to conventional bikes. They are convenient for long distance travel due to their compactness. A folded bike is easy to transport into buildings or on public transportation, enabling mixed-mode commuting. This form of biking is preferred by people who live in small spaces or have limited space. In addition to being portable, folding bikes can also be transported aboard planes, cars and boats without too much hassle. Various shapes and sizes of folding bikes are available today with the best folding techniques and craftsmanship.
Several factors are driving the growth of the global folding bikes market, including implementation of government regulations to encourage the use of electric bikes, consumer inclination toward using e-bikes as an eco-friendly & efficient commute mode, and increase in fuel prices. Furthermore, the high price of e-bikes is the only factor that is reducing the market's growth. Improvements in bicycling infrastructure & battery technology represent a lucrative opportunity that is supplementing the market's growth.
Various national and international governments are taking drives to decrease the carbon impressions by empowering the utilization of electric bikes, electric vehicles, and bikes, inferable from an increment in consciousness of the unsafe impacts of utilizing vehicles running on petroleum derivatives. Additionally, governments are building bike cordial roads, which are empowering people to pick bikes as a critical method of drive. Electric bikes, bikes, and bikes have acquired huge consideration from different governments, as dependable and proficient sorts of light engine vehicles (LMVs), decreasing the carbon impression. Moreover, to empower the utilization of these climate well-disposed vehicles, certain advantages have been presented by governments of different nations, for example, diminished enlistment tax and different liabilities. Foundation offices, for example, monitored bike stopping offices, development of more bike (express) courses, and foundation of battery charging stations in numerous nations by the governments essentially support the reception of electric bikes by clients; accordingly, impelling the development of the market.
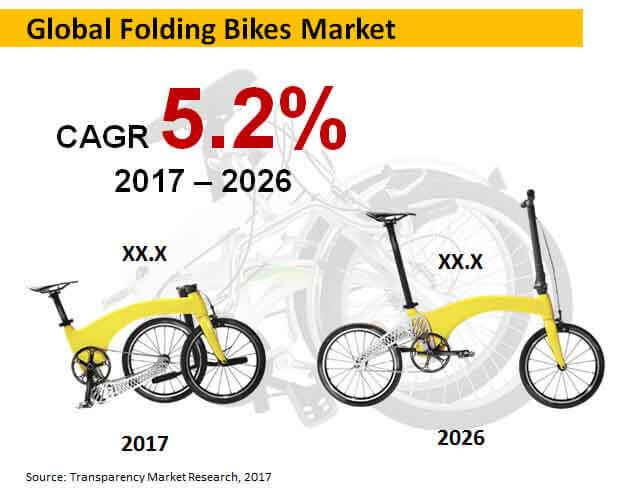
Transparency Market Research (TMR)’s latest report reveals that the global folding bikes market is estimated to surpass a market valuation of US$ 213,200 Mn by 2026, expanding at a CAGR of 5.2% during the forecast period (2017-2026). Increasing focus on innovation continues to create new growth avenues in the bike manufacturing industry. Manufacturers are coming up with new designs that meet the expectation of a modern consumer. Moreover, availability of more sophisticated components is allowing manufacturers to enhance bike capabilities and add new rider-friendly features. One of the greatest advantages of folding bikes is their compactness that allows riders to carry them on long distance travelling. Folding bike can be easily packed and transported. These bikes take up lesser storing space as compared to the conventional bikes. When folded, the bike can be easily carried into buildings or on public transport facilitating mixed-mode commutation. These bikes are preferred by people who live in compact quarters and have limited space. Also folding bikes can be aboard on a plane, car or boat without facing much of a hassle. In recent years, a wide range of folding bikes have emerged with varying shapes and sizes. The standout fold techniques and craftsmanship make these bike attractive and practical.
Among regions, the market in Europe is expected to remain highly lucrative in 2017 and beyond. In terms of revenue, the region currently accounts for the highest share of the global market and the trend is likely to continue throughout the assessment period. Europe’s folding bikes market is projected to exhibit a CAGR of 5.1% between 2017 and 2026. The European Union (EU) is also baking an initiative “BIKE INTERMODAL” focused to stimulate intermodal transportation system that involves use of bikes with other modes of commutation. Favorable policies and high consumer awareness is expected to support the growth of the market in the region over 2026.
Demand for mid-fold folding bikes is expected to remain high over the next couple years. Global sales of mid-fold folding bikes currently commands for close to one-fourth revenue share of the global market. Towards the end of 2026, more than US$ 45,700 Mn worth mid-fold folding bikes are expected to be sold worldwide.
It is observed that most riders opt for folding bikes with 20 inch wheel size. This is primarily attributed to the compactness of these wheels. Owing a smaller diameter, 20 Inch wheels are more adjustable to the folds and carry lesser weight as compared to other large size wheels. By 2017-end, over US$ 39,690 Mn worth folding bikes with 20 inch wheel size is likely to sold globally.
A large number of people buy folding bikes to rides them for maintaining fitness and staying healthy. Bikes are increasingly viewed as an exercise tool all across the global, characterizing its use even by affluent and deep pocketed consumers. Hence, global sales of folding bikes is partly driving by the increasing level of health awareness among people.
Brompton, Bobbin, Montague Crosstown, Raleigh Evo-2, Bickerton Junction 1707 City, Dawes Diamond, Tern Verge X20, Dahon, Pacific Cycles, STRiDA EVO, Tern Link, Vilano, Schwinn, SwissBike, Strida LT, Tern Joe, Independent Fabrication, LightSpeed, Gocycle, and Di Blasi. A majority of these players are actively focusing on development of more efficient bike design and style that offers a unique riding experience with higher level of comfort.
1. Global Economic Outlook
2. Global Folding Bikes Market - Executive Summary
3. Global Folding Bikes Market Overview
3.1. Introduction
3.1.1. Global Folding Bikes Market Taxonomy
3.1.2. Global Folding Bikes Market Definition
3.2. Global Folding Bikes Market Size (US$ Mn) and Forecast, 2012-2026
3.2.1. Global Folding Bikes Market Y-o-Y Growth
3.3. Global Folding Bikes Market Dynamics
3.4. Supply Chain
3.5. Cost Structure
3.6. Pricing Analysis
3.7. Raw Material Sourcing Strategy and Analysis
3.8. Service Provider List
3.9. Key Participants Market Presence (Intensity Map) By Region
4. Global Folding Bikes Market Analysis and Forecast 2012-2026
4.1. Global Folding Bikes Market Size and Forecast By Product Type, 2012-2026
4.1.1. Mid-fold Market Size and Forecast, 2012-2026
4.1.1.1. Revenue (US$ Mn) Comparison, By Region
4.1.1.2. Market Share Comparison, By Region
4.1.1.3. Y-o-Y growth Comparison, By Region
4.1.2. Vertical Fold Market Size and Forecast, 2012-2026
4.1.2.1. Revenue (US$ Mn) Comparison, By Region
4.1.2.2. Market Share Comparison, By Region
4.1.2.3. Y-o-Y growth Comparison, By Region
4.1.3. Triangle Hinge Market Size and Forecast, 2012-2026
4.1.3.1. Revenue (US$ Mn) Comparison, By Region
4.1.3.2. Market Share Comparison, By Region
4.1.3.3. Y-o-Y growth Comparison, By Region
4.1.4. Magnet Folding and suspension system Market Size and Forecast, 2012-2026
4.1.4.1. Revenue (US$ Mn) Comparison, By Region
4.1.4.2. Market Share Comparison, By Region
4.1.4.3. Y-o-Y growth Comparison, By Region
4.1.5. Others Market Size and Forecast, 2012-2026
4.1.5.1. Revenue (US$ Mn) Comparison, By Region
4.1.5.2. Market Share Comparison, By Region
4.1.5.3. Y-o-Y growth Comparison, By Region
4.2. Global Folding Bikes Market Size and Forecast By Wheel Size, 2012-2026
4.2.1. 20 Inch Market Size and Forecast, 2012-2026
4.2.1.1. Revenue (US$ Mn) Comparison, By Region
4.2.1.2. Market Share Comparison, By Region
4.2.1.3. Y-o-Y growth Comparison, By Region
4.2.2. 24 Inch Market Size and Forecast, 2012-2026
4.2.2.1. Revenue (US$ Mn) Comparison, By Region
4.2.2.2. Market Share Comparison, By Region
4.2.2.3. Y-o-Y growth Comparison, By Region
4.2.3. 26 Inch Market Size and Forecast, 2012-2026
4.2.3.1. Revenue (US$ Mn) Comparison, By Region
4.2.3.2. Market Share Comparison, By Region
4.2.3.3. Y-o-Y growth Comparison, By Region
4.2.4. 700c Market Size and Forecast, 2012-2026
4.2.4.1. Revenue (US$ Mn) Comparison, By Region
4.2.4.2. Market Share Comparison, By Region
4.2.4.3. Y-o-Y growth Comparison, By Region
4.2.5. Other Wheel Size Market Size and Forecast, 2012-2026
4.2.5.1. Revenue (US$ Mn) Comparison, By Region
4.2.5.2. Market Share Comparison, By Region
4.2.5.3. Y-o-Y growth Comparison, By Region
4.3. Global Folding Bikes Market Size and Forecast By Application, 2012-2026
4.3.1. Sports Market Size and Forecast, 2012-2026
4.3.1.1. Revenue (US$ Mn) Comparison, By Region
4.3.1.2. Market Share Comparison, By Region
4.3.1.3. Y-o-Y growth Comparison, By Region
4.3.2. Fitness Market Size and Forecast, 2012-2026
4.3.2.1. Revenue (US$ Mn) Comparison, By Region
4.3.2.2. Market Share Comparison, By Region
4.3.2.3. Y-o-Y growth Comparison, By Region
4.3.3. Commercial Market Size and Forecast, 2012-2026
4.3.3.1. Revenue (US$ Mn) Comparison, By Region
4.3.3.2. Market Share Comparison, By Region
4.3.3.3. Y-o-Y growth Comparison, By Region
4.4. Global Folding Bikes Market Size and Forecast By Price Range, 2012-2026
4.4.1. Premium Market Size and Forecast, 2012-2026
4.4.1.1. Revenue (US$ Mn) Comparison, By Region
4.4.1.2. Market Share Comparison, By Region
4.4.1.3. Y-o-Y growth Comparison, By Region
4.4.2. Economy Market Size and Forecast, 2012-2026
4.4.2.1. Revenue (US$ Mn) Comparison, By Region
4.4.2.2. Market Share Comparison, By Region
4.4.2.3. Y-o-Y growth Comparison, By Region
4.4.3. Market Size and Forecast, 2012-2026
4.4.3.1. Revenue (US$ Mn) Comparison, By Region
4.4.3.2. Market Share Comparison, By Region
4.4.3.3. Y-o-Y growth Comparison, By Region
5. North America Folding Bikes Market Size and Forecast, 2012-2026
5.1. North America Outlook
5.2. North America Parent Market Outlook
5.3. North America Target Market Outlook
5.4. Revenue (US$ Mn) Comparison, By Country
5.4.1. US Market Size and Forecast (US$ Mn), 2012-2026
5.4.2. Canada Market Size and Forecast (US$ Mn), 2012-2026
5.5. Revenue (US$ Mn) Comparison, By Product Type
5.6. Revenue (US$ Mn) Comparison, By Wheel Size
5.7. Revenue (US$ Mn) Comparison, By Application
5.8. Revenue (US$ Mn) Comparison, By Price Range
6. Latin America Folding Bikes Market Size and Forecast, 2012-2026
6.1. Latin America Outlook
6.2. Latin America Parent Market Outlook
6.3. Latin America Target Market Outlook
6.4. Revenue (US$ Mn) Comparison, By Country
6.4.1. Brazil Market Size and Forecast (US$ Mn), 2012-2026
6.4.2. Mexico Market Size and Forecast (US$ Mn), 2012-2026
6.4.3. Rest of Latin America Market Size and Forecast (US$ Mn), 2012-2026
6.5. Revenue (US$ Mn) Comparison, By Product Type
6.6. Revenue (US$ Mn) Comparison, By Wheel Size
6.7. Revenue (US$ Mn) Comparison, By Application
6.8. Revenue (US$ Mn) Comparison, By Price Range
7. Europe Folding Bikes Market Size and Forecast, 2012-2026
7.1. Europe Outlook
7.2. Europe Parent Market Outlook
7.3. Europe Target Market Outlook
7.4. Revenue (US$ Mn) Comparison, By Country
7.4.1. BENELUX Market Size and Forecast (US$ Mn), 2012-2026
7.4.2. France Market Size and Forecast (US$ Mn), 2012-2026
7.4.3. Germany Market Size and Forecast (US$ Mn), 2012-2026
7.4.4. Spain Market Size and Forecast (US$ Mn), 2012-2026
7.4.5. U.K Market Size and Forecast (US$ Mn), 2012-2026
7.4.6. Rest of Europe Market Size and Forecast (US$ Mn), 2012-2026
7.5. Revenue (US$ Mn) Comparison, By Product Type
7.6. Revenue (US$ Mn) Comparison, By Wheel Size
7.7. Revenue (US$ Mn) Comparison, By Application
7.8. Revenue (US$ Mn) Comparison, By Price Range
8. Japan Folding Bikes Market Size and Forecast, 2012-2026
8.1. Japan Outlook
8.2. Japan Parent Market Outlook
8.3. Japan Target Market Outlook
8.4. Revenue (US$ Mn) Comparison, By Country
8.4.1. Japan Market Size and Forecast (US$ Mn), 2012-2026
8.5. Revenue (US$ Mn) Comparison, By Product Type
8.6. Revenue (US$ Mn) Comparison, By Wheel Size
8.7. Revenue (US$ Mn) Comparison, By Application
8.8. Revenue (US$ Mn) Comparison, By Price Range
9. APEJ Folding Bikes Market Size and Forecast, 2012-2026
9.1. APEJ Outlook
9.2. APEJ Parent Market Outlook
9.3. APEJ Target Market Outlook
9.4. Revenue (US$ Mn) Comparison, By Country
9.4.1. Australia & New Zealand Market Size and Forecast (US$ Mn), 2012-2026
9.4.2. ASEAN Market Size and Forecast (US$ Mn), 2012-2026
9.4.3. China Market Size and Forecast (US$ Mn), 2012-2026
9.4.4. India Market Size and Forecast (US$ Mn), 2012-2026
9.4.5. Rest of APEJ Market Size and Forecast (US$ Mn), 2012-2026
9.5. Revenue (US$ Mn) Comparison, By Product Type
9.6. Revenue (US$ Mn) Comparison, By Wheel Size
9.7. Revenue (US$ Mn) Comparison, By Application
9.8. Revenue (US$ Mn) Comparison, By Price Range
10. MEA Folding Bikes Market Size and Forecast, 2012-2026
10.1. MEA Outlook
10.2. MEA Parent Market Outlook
10.3. MEA Target Market Outlook
10.4. Revenue (US$ Mn) Comparison, By Country
10.4.1. GCC Market Size and Forecast (US$ Mn), 2012-2026
10.4.2. South Africa Market Size and Forecast (US$ Mn), 2012-2026
10.4.3. Rest of MEA Market Size and Forecast (US$ Mn), 2012-2026
10.5. Revenue (US$ Mn) Comparison, By Product Type
10.6. Revenue (US$ Mn) Comparison, By Wheel Size
10.7. Revenue (US$ Mn) Comparison, By Application
10.8. Revenue (US$ Mn) Comparison, By Price Range
11. Global Folding Bikes Market Company Share, Competition Landscape and Company Profiles
11.1. Company Share Analysis
11.2. Competition Landscape
11.3. Company Profiles
11.3.1. Brompton
11.3.2. Bobbin
11.3.3. Montague Crosstown
11.3.4. Raleigh Evo-2
11.3.5. Bickerton Junction 1707 City
11.3.6. Dawes Diamond
11.3.7. Tern Verge X20
11.3.8. Dahon
11.3.9. Pacific Cycles
11.3.10. STRiDA EVO
11.3.11. Tern Link
11.3.12. Vilano
11.3.13. Schwinn
11.3.14. SwissBike
11.3.15. Strida LT
11.3.16. Tern Joe
11.3.17. Independent Fabrication
11.3.18. LightSpeed
11.3.19. Gocycle
11.3.20.Di Blasi
12. Research Methodology
13. Secondary and Primary Sources
14. Assumptions and Acronyms
15. Disclaimer
List of Tables
TABLE 1 Global Folding Bikes Market Value (US$ Mn), 2012-2017
TABLE 2 Global Folding Bikes Market Value (US$ Mn), 2018-2026
TABLE 3 Global Folding Bikes Market Value (US$ Mn) and Y-o-Y, 2017-2026
TABLE 4 Global Mid-fold Segment Value (US$ Mn), By Region 2012-2017
TABLE 5 Global Mid-fold Segment Value (US$ Mn), By Region 2018-2026
TABLE 6 Global Mid-fold Segment Market Share, By Region 2012-2017
TABLE 7 Global Mid-fold Segment Market Share, By Region 2018-2026
TABLE 8 Global Mid-fold Segment Y-o-Y, By Region 2017-2026
TABLE 9 Global Vertical Fold Segment Value (US$ Mn), By Region 2012-2017
TABLE 10 Global Vertical Fold Segment Value (US$ Mn), By Region 2018-2026
TABLE 11 Global Vertical Fold Segment Market Share, By Region 2012-2017
TABLE 12 Global Vertical Fold Segment Market Share, By Region 2018-2026
TABLE 13 Global Vertical Fold Segment Y-o-Y, By Region 2017-2026
TABLE 14 Global Triangle Hinge Segment Value (US$ Mn), By Region 2012-2017
TABLE 15 Global Triangle Hinge Segment Value (US$ Mn), By Region 2018-2026
TABLE 16 Global Triangle Hinge Segment Market Share, By Region 2012-2017
TABLE 17 Global Triangle Hinge Segment Market Share, By Region 2018-2026
TABLE 18 Global Triangle Hinge Segment Y-o-Y, By Region 2017-2026
TABLE 19 Global Magnet Folding and suspension system Segment Value (US$ Mn), By Region 2012-2017
TABLE 20 Global Magnet Folding and suspension system Segment Value (US$ Mn), By Region 2018-2026
TABLE 21 Global Magnet Folding and suspension system Segment Market Share, By Region 2012-2017
TABLE 22 Global Magnet Folding and suspension system Segment Market Share, By Region 2018-2026
TABLE 23 Global Magnet Folding and suspension system Segment Y-o-Y, By Region 2017-2026
TABLE 24 Global Others Segment Value (US$ Mn), By Region 2012-2017
TABLE 25 Global Others Segment Value (US$ Mn), By Region 2018-2026
TABLE 26 Global Others Segment Market Share, By Region 2012-2017
TABLE 27 Global Others Segment Market Share, By Region 2018-2026
TABLE 28 Global Others Segment Y-o-Y, By Region 2017-2026
TABLE 29 Global 20 Inch Segment Value (US$ Mn), By Region 2012-2017
TABLE 30 Global 20 Inch Segment Value (US$ Mn), By Region 2018-2026
TABLE 31 Global 20 Inch Segment Market Share, By Region 2012-2017
TABLE 32 Global 20 Inch Segment Market Share, By Region 2018-2026
TABLE 33 Global 20 Inch Segment Y-o-Y, By Region 2017-2026
TABLE 34 Global 24 Inch Segment Value (US$ Mn), By Region 2012-2017
TABLE 35 Global 24 Inch Segment Value (US$ Mn), By Region 2018-2026
TABLE 36 Global 24 Inch Segment Market Share, By Region 2012-2017
TABLE 37 Global 24 Inch Segment Market Share, By Region 2018-2026
TABLE 38 Global 24 Inch Segment Y-o-Y, By Region 2017-2026
TABLE 39 Global 26 Inch Segment Value (US$ Mn), By Region 2012-2017
TABLE 40 Global 26 Inch Segment Value (US$ Mn), By Region 2018-2026
TABLE 41 Global 26 Inch Segment Market Share, By Region 2012-2017
TABLE 42 Global 26 Inch Segment Market Share, By Region 2018-2026
TABLE 43 Global 26 Inch Segment Y-o-Y, By Region 2017-2026
TABLE 44 Global 700c Segment Value (US$ Mn), By Region 2012-2017
TABLE 45 Global 700c Segment Value (US$ Mn), By Region 2018-2026
TABLE 46 Global 700c Segment Market Share, By Region 2012-2017
TABLE 47 Global 700c Segment Market Share, By Region 2018-2026
TABLE 48 Global 700c Segment Y-o-Y, By Region 2017-2026
TABLE 49 Global Other Wheel Size Segment Value (US$ Mn), By Region 2012-2017
TABLE 50 Global Other Wheel Size Segment Value (US$ Mn), By Region 2018-2026
TABLE 51 Global Other Wheel Size Segment Market Share, By Region 2012-2017
TABLE 52 Global Other Wheel Size Segment Market Share, By Region 2018-2026
TABLE 53 Global Other Wheel Size Segment Y-o-Y, By Region 2017-2026
TABLE 54 Global Sports Segment Value (US$ Mn), By Region 2012-2017
TABLE 55 Global Sports Segment Value (US$ Mn), By Region 2018-2026
TABLE 56 Global Sports Segment Market Share, By Region 2012-2017
TABLE 57 Global Sports Segment Market Share, By Region 2018-2026
TABLE 58 Global Sports Segment Y-o-Y, By Region 2017-2026
TABLE 59 Global Fitness Segment Value (US$ Mn), By Region 2012-2017
TABLE 60 Global Fitness Segment Value (US$ Mn), By Region 2018-2026
TABLE 61 Global Fitness Segment Market Share, By Region 2012-2017
TABLE 62 Global Fitness Segment Market Share, By Region 2018-2026
TABLE 63 Global Fitness Segment Y-o-Y, By Region 2017-2026
TABLE 64 Global Commercial Segment Value (US$ Mn), By Region 2012-2017
TABLE 65 Global Commercial Segment Value (US$ Mn), By Region 2018-2026
TABLE 66 Global Commercial Segment Market Share, By Region 2012-2017
TABLE 67 Global Commercial Segment Market Share, By Region 2018-2026
TABLE 68 Global Commercial Segment Y-o-Y, By Region 2017-2026
TABLE 69 Global Premium Segment Value (US$ Mn), By Region 2012-2017
TABLE 70 Global Premium Segment Value (US$ Mn), By Region 2018-2026
TABLE 71 Global Premium Segment Market Share, By Region 2012-2017
TABLE 72 Global Premium Segment Market Share, By Region 2018-2026
TABLE 73 Global Premium Segment Y-o-Y, By Region 2017-2026
TABLE 74 Global Economy Segment Value (US$ Mn), By Region 2012-2017
TABLE 75 Global Economy Segment Value (US$ Mn), By Region 2018-2026
TABLE 76 Global Economy Segment Market Share, By Region 2012-2017
TABLE 77 Global Economy Segment Market Share, By Region 2018-2026
TABLE 78 Global Economy Segment Y-o-Y, By Region 2017-2026
TABLE 79 Global Low Segment Value (US$ Mn), By Region 2012-2017
TABLE 80 Global Low Segment Value (US$ Mn), By Region 2018-2026
TABLE 81 Global Low Segment Market Share, By Region 2012-2017
TABLE 82 Global Low Segment Market Share, By Region 2018-2026
TABLE 83 Global Low Segment Y-o-Y, By Region 2017-2026
TABLE 84 North America Folding Bikes Market Value (US$ Mn), By Country 2012-2017
TABLE 85 North America Folding Bikes Market Value (US$ Mn), By Country 2018-2026
TABLE 86 North America Folding Bikes Market Value (US$ Mn), By Product Type 2012-2017
TABLE 87 North America Folding Bikes Market Value (US$ Mn), By Product Type 2018-2026
TABLE 88 North America Folding Bikes Market Value (US$ Mn), By Wheel Size 2012-2017
TABLE 89 North America Folding Bikes Market Value (US$ Mn), By Wheel Size 2018-2026
TABLE 90 North America Folding Bikes Market Value (US$ Mn), By Application 2012-2017
TABLE 91 North America Folding Bikes Market Value (US$ Mn), By Application 2018-2026
TABLE 92 North America Folding Bikes Market Value (US$ Mn), By Price Range 2012-2017
TABLE 93 North America Folding Bikes Market Value (US$ Mn), By Price Range 2018-2026
TABLE 94 Latin America Folding Bikes Market Value (US$ Mn), By Country 2012-2017
TABLE 95 Latin America Folding Bikes Market Value (US$ Mn), By Country 2018-2026
TABLE 96 Latin America Folding Bikes Market Value (US$ Mn), By Product Type 2012-2017
TABLE 97 Latin America Folding Bikes Market Value (US$ Mn), By Product Type 2018-2026
TABLE 98 Latin America Folding Bikes Market Value (US$ Mn), By Wheel Size 2012-2017
TABLE 99 Latin America Folding Bikes Market Value (US$ Mn), By Wheel Size 2018-2026
TABLE 100 Latin America Folding Bikes Market Value (US$ Mn), By Application 2012-2017
TABLE 101 Latin America Folding Bikes Market Value (US$ Mn), By Application 2018-2026
TABLE 102 Latin America Folding Bikes Market Value (US$ Mn), By Price Range 2012-2017
TABLE 103 Latin America Folding Bikes Market Value (US$ Mn), By Price Range 2018-2026
TABLE 104 Europe Folding Bikes Market Value (US$ Mn), By Country 2012-2017
TABLE 105 Europe Folding Bikes Market Value (US$ Mn), By Country 2018-2026
TABLE 106 Europe Folding Bikes Market Value (US$ Mn), By Product Type 2012-2017
TABLE 107 Europe Folding Bikes Market Value (US$ Mn), By Product Type 2018-2026
TABLE 108 Europe Folding Bikes Market Value (US$ Mn), By Wheel Size 2012-2017
TABLE 109 Europe Folding Bikes Market Value (US$ Mn), By Wheel Size 2018-2026
TABLE 110 Europe Folding Bikes Market Value (US$ Mn), By Application 2012-2017
TABLE 111 Europe Folding Bikes Market Value (US$ Mn), By Application 2018-2026
TABLE 112 Europe Folding Bikes Market Value (US$ Mn), By Price Range 2012-2017
TABLE 113 Europe Folding Bikes Market Value (US$ Mn), By Price Range 2018-2026
TABLE 114 Japan Folding Bikes Market Value (US$ Mn), By Country 2012-2017
TABLE 115 Japan Folding Bikes Market Value (US$ Mn), By Country 2018-2026
TABLE 116 Japan Folding Bikes Market Value (US$ Mn), By Product Type 2012-2017
TABLE 117 Japan Folding Bikes Market Value (US$ Mn), By Product Type 2018-2026
TABLE 118 Japan Folding Bikes Market Value (US$ Mn), By Wheel Size 2012-2017
TABLE 119 Japan Folding Bikes Market Value (US$ Mn), By Wheel Size 2018-2026
TABLE 120 Japan Folding Bikes Market Value (US$ Mn), By Application 2012-2017
TABLE 121 Japan Folding Bikes Market Value (US$ Mn), By Application 2018-2026
TABLE 122 Japan Folding Bikes Market Value (US$ Mn), By Price Range 2012-2017
TABLE 123 Japan Folding Bikes Market Value (US$ Mn), By Price Range 2018-2026
TABLE 124 APEJ Folding Bikes Market Value (US$ Mn), By Country 2012-2017
TABLE 125 APEJ Folding Bikes Market Value (US$ Mn), By Country 2018-2026
TABLE 126 APEJ Folding Bikes Market Value (US$ Mn), By Product Type 2012-2017
TABLE 127 APEJ Folding Bikes Market Value (US$ Mn), By Product Type 2018-2026
TABLE 128 APEJ Folding Bikes Market Value (US$ Mn), By Wheel Size 2012-2017
TABLE 129 APEJ Folding Bikes Market Value (US$ Mn), By Wheel Size 2018-2026
TABLE 130 APEJ Folding Bikes Market Value (US$ Mn), By Application 2012-2017
TABLE 131 APEJ Folding Bikes Market Value (US$ Mn), By Application 2018-2026
TABLE 132 APEJ Folding Bikes Market Value (US$ Mn), By Price Range 2012-2017
TABLE 133 APEJ Folding Bikes Market Value (US$ Mn), By Price Range 2018-2026
TABLE 134 MEA Folding Bikes Market Value (US$ Mn), By Country 2012-2017
TABLE 135 MEA Folding Bikes Market Value (US$ Mn), By Country 2018-2026
TABLE 136 MEA Folding Bikes Market Value (US$ Mn), By Product Type 2012-2017
TABLE 137 MEA Folding Bikes Market Value (US$ Mn), By Product Type 2018-2026
TABLE 138 MEA Folding Bikes Market Value (US$ Mn), By Wheel Size 2012-2017
TABLE 139 MEA Folding Bikes Market Value (US$ Mn), By Wheel Size 2018-2026
TABLE 140 MEA Folding Bikes Market Value (US$ Mn), By Application 2012-2017
TABLE 141 MEA Folding Bikes Market Value (US$ Mn), By Application 2018-2026
TABLE 142 MEA Folding Bikes Market Value (US$ Mn), By Price Range 2012-2017
TABLE 143 MEA Folding Bikes Market Value (US$ Mn), By Price Range 2018-2026
List of Figures
FIG. 1 Global Folding Bikes Market Value (US$ Mn), 2012-2017
FIG. 2 Global Folding Bikes Market Value (US$ Mn) Forecast, 2018-2026
FIG. 3 Global Folding Bikes Market Value (US$ Mn) and Y-o-Y, 2017-2026
FIG. 4 Global Mid-fold Segment Market Value (US$ Mn) By Region, 2012-2017
FIG. 5 Global Mid-fold Segment Market Value (US$ Mn) By Region, 2018-2026
FIG. 6 Global Mid-fold Segment Y-o-Y Growth Rate, By Region, 2017-2026
FIG. 7 Global Vertical Fold Segment Market Value (US$ Mn) By Region, 2012-2017
FIG. 8 Global Vertical Fold Segment Market Value (US$ Mn) By Region, 2018-2026
FIG. 9 Global Vertical Fold Segment Y-o-Y Growth Rate, By Region, 2017-2026
FIG. 10 Global Triangle Hinge Segment Market Value (US$ Mn) By Region, 2012-2017
FIG. 11 Global Triangle Hinge Segment Market Value (US$ Mn) By Region, 2018-2026
FIG. 12 Global Triangle Hinge Segment Y-o-Y Growth Rate, By Region, 2017-2026
FIG. 13 Global Magnet Folding and suspension system Segment Market Value (US$ Mn) By Region, 2012-2017
FIG. 14 Global Magnet Folding and suspension system Segment Market Value (US$ Mn) By Region, 2018-2026
FIG. 15 Global Magnet Folding and suspension system Segment Y-o-Y Growth Rate, By Region, 2017-2026
FIG. 16 Global Others Segment Market Value (US$ Mn) By Region, 2012-2017
FIG. 17 Global Others Segment Market Value (US$ Mn) By Region, 2018-2026
FIG. 18 Global Others Segment Y-o-Y Growth Rate, By Region, 2017-2026
FIG. 19 Global 20 Inch Segment Market Value (US$ Mn) By Region, 2012-2017
FIG. 20 Global 20 Inch Segment Market Value (US$ Mn) By Region, 2018-2026
FIG. 21 Global 20 Inch Segment Y-o-Y Growth Rate, By Region, 2017-2026
FIG. 22 Global 24 Inch Segment Market Value (US$ Mn) By Region, 2012-2017
FIG. 23 Global 24 Inch Segment Market Value (US$ Mn) By Region, 2018-2026
FIG. 24 Global 24 Inch Segment Y-o-Y Growth Rate, By Region, 2017-2026
FIG. 25 Global 26 Inch Segment Market Value (US$ Mn) By Region, 2012-2017
FIG. 26 Global 26 Inch Segment Market Value (US$ Mn) By Region, 2018-2026
FIG. 27 Global 26 Inch Segment Y-o-Y Growth Rate, By Region, 2017-2026
FIG. 28 Global 700c Segment Market Value (US$ Mn) By Region, 2012-2017
FIG. 29 Global 700c Segment Market Value (US$ Mn) By Region, 2018-2026
FIG. 30 Global 700c Segment Y-o-Y Growth Rate, By Region, 2017-2026
FIG. 31 Global Other Wheel Size Segment Market Value (US$ Mn) By Region, 2012-2017
FIG. 32 Global Other Wheel Size Segment Market Value (US$ Mn) By Region, 2018-2026
FIG. 33 Global Other Wheel Size Segment Y-o-Y Growth Rate, By Region, 2017-2026
FIG. 34 Global Sports Segment Market Value (US$ Mn) By Region, 2012-2017
FIG. 35 Global Sports Segment Market Value (US$ Mn) By Region, 2018-2026
FIG. 36 Global Sports Segment Y-o-Y Growth Rate, By Region, 2017-2026
FIG. 37 Global Fitness Segment Market Value (US$ Mn) By Region, 2012-2017
FIG. 38 Global Fitness Segment Market Value (US$ Mn) By Region, 2018-2026
FIG. 39 Global Fitness Segment Y-o-Y Growth Rate, By Region, 2017-2026
FIG. 40 Global Commercial Segment Market Value (US$ Mn) By Region, 2012-2017
FIG. 41 Global Commercial Segment Market Value (US$ Mn) By Region, 2018-2026
FIG. 42 Global Commercial Segment Y-o-Y Growth Rate, By Region, 2017-2026
FIG. 43 Global Premium Segment Market Value (US$ Mn) By Region, 2012-2017
FIG. 44 Global Premium Segment Market Value (US$ Mn) By Region, 2018-2026
FIG. 45 Global Premium Segment Y-o-Y Growth Rate, By Region, 2017-2026
FIG. 46 Global Economy Segment Market Value (US$ Mn) By Region, 2012-2017
FIG. 47 Global Economy Segment Market Value (US$ Mn) By Region, 2018-2026
FIG. 48 Global Economy Segment Y-o-Y Growth Rate, By Region, 2017-2026
FIG. 49 Global Low Segment Market Value (US$ Mn) By Region, 2012-2017
FIG. 50 Global Low Segment Market Value (US$ Mn) By Region, 2018-2026
FIG. 51 Global Low Segment Y-o-Y Growth Rate, By Region, 2017-2026
FIG. 52 North America Folding Bikes Market Value (US$ Mn), By Country 2012-2017
FIG. 53 North America Folding Bikes Market Value (US$ Mn), By Country 2018-2026
FIG. 54 North America Folding Bikes Market Value (US$ Mn), By Product Type 2012-2017
FIG. 55 North America Folding Bikes Market Value (US$ Mn), By Product Type 2018-2026
FIG. 56 North America Folding Bikes Market Value (US$ Mn), By Wheel Size 2012-2017
FIG. 57 North America Folding Bikes Market Value (US$ Mn), By Wheel Size 2018-2026
FIG. 58 North America Folding Bikes Market Value (US$ Mn), By Application 2012-2017
FIG. 59 North America Folding Bikes Market Value (US$ Mn), By Application 2018-2026
FIG. 60 North America Folding Bikes Market Value (US$ Mn), By Price Range 2012-2017
FIG. 61 North America Folding Bikes Market Value (US$ Mn), By Price Range 2018-2026
FIG. 62 Latin America Folding Bikes Market Value (US$ Mn), By Country 2012-2017
FIG. 63 Latin America Folding Bikes Market Value (US$ Mn), By Country 2018-2026
FIG. 64 Latin America Folding Bikes Market Value (US$ Mn), By Product Type 2012-2017
FIG. 65 Latin America Folding Bikes Market Value (US$ Mn), By Product Type 2018-2026
FIG. 66 Latin America Folding Bikes Market Value (US$ Mn), By Wheel Size 2012-2017
FIG. 67 Latin America Folding Bikes Market Value (US$ Mn), By Wheel Size 2018-2026
FIG. 68 Latin America Folding Bikes Market Value (US$ Mn), By Application 2012-2017
FIG. 69 Latin America Folding Bikes Market Value (US$ Mn), By Application 2018-2026
FIG. 70 Latin America Folding Bikes Market Value (US$ Mn), By Price Range 2012-2017
FIG. 71 Latin America Folding Bikes Market Value (US$ Mn), By Price Range 2018-2026
FIG. 72 Europe Folding Bikes Market Value (US$ Mn), By Country 2012-2017
FIG. 73 Europe Folding Bikes Market Value (US$ Mn), By Country 2018-2026
FIG. 74 Europe Folding Bikes Market Value (US$ Mn), By Product Type 2012-2017
FIG. 75 Europe Folding Bikes Market Value (US$ Mn), By Product Type 2018-2026
FIG. 76 Europe Folding Bikes Market Value (US$ Mn), By Wheel Size 2012-2017
FIG. 77 Europe Folding Bikes Market Value (US$ Mn), By Wheel Size 2018-2026
FIG. 78 Europe Folding Bikes Market Value (US$ Mn), By Application 2012-2017
FIG. 79 Europe Folding Bikes Market Value (US$ Mn), By Application 2018-2026
FIG. 80 Europe Folding Bikes Market Value (US$ Mn), By Price Range 2012-2017
FIG. 81 Europe Folding Bikes Market Value (US$ Mn), By Price Range 2018-2026
FIG. 82 Japan Folding Bikes Market Value (US$ Mn), By Country 2012-2017
FIG. 83 Japan Folding Bikes Market Value (US$ Mn), By Country 2018-2026
FIG. 84 Japan Folding Bikes Market Value (US$ Mn), By Product Type 2012-2017
FIG. 85 Japan Folding Bikes Market Value (US$ Mn), By Product Type 2018-2026
FIG. 86 Japan Folding Bikes Market Value (US$ Mn), By Application 2012-2017
FIG. 87 Japan Folding Bikes Market Value (US$ Mn), By Wheel Size 2018-2026
FIG. 88 Japan Folding Bikes Market Value (US$ Mn), By Application 2012-2017
FIG. 89 Japan Folding Bikes Market Value (US$ Mn), By Application 2018-2026
FIG. 90 Japan Folding Bikes Market Value (US$ Mn), By Price Range 2012-2017
FIG. 91 Japan Folding Bikes Market Value (US$ Mn), By Price Range 2018-2026
FIG. 92 APEJ Folding Bikes Market Value (US$ Mn), By Country 2012-2017
FIG. 93 APEJ Folding Bikes Market Value (US$ Mn), By Country 2018-2026
FIG. 94 APEJ Folding Bikes Market Value (US$ Mn), By Product Type 2012-2017
FIG. 95 APEJ Folding Bikes Market Value (US$ Mn), By Product Type 2018-2026
FIG. 96 APEJ Folding Bikes Market Value (US$ Mn), By Wheel Size 2012-2017
FIG. 97 APEJ Folding Bikes Market Value (US$ Mn), By Wheel Size 2018-2026
FIG. 98 APEJ Folding Bikes Market Value (US$ Mn), By Application 2012-2017
FIG. 99 APEJ Folding Bikes Market Value (US$ Mn), By Application 2018-2026
FIG. 100 APEJ Folding Bikes Market Value (US$ Mn), By Price Range 2012-2017
FIG. 101 APEJ Folding Bikes Market Value (US$ Mn), By Price Range 2018-2026
FIG. 102 MEA Folding Bikes Market Value (US$ Mn), By Country 2012-2017
FIG. 103 MEA Folding Bikes Market Value (US$ Mn), By Country 2018-2026
FIG. 104 MEA Folding Bikes Market Value (US$ Mn), By Product Type 2012-2017
FIG. 105 MEA Folding Bikes Market Value (US$ Mn), By Product Type 2018-2026
FIG. 106 MEA Folding Bikes Market Value (US$ Mn), By Wheel Size 2012-2017
FIG. 107 MEA Folding Bikes Market Value (US$ Mn), By Wheel Size 2018-2026
FIG. 108 MEA Folding Bikes Market Value (US$ Mn), By Application 2012-2017
FIG. 109 MEA Folding Bikes Market Value (US$ Mn), By Application 2018-2026
FIG. 110 MEA Folding Bikes Market Value (US$ Mn), By Price Range 2012-2017
FIG. 111 MEA Folding Bikes Market Value (US$ Mn), By Price Range 2018-2026
Copyright © Transparency Market Research, Inc. All Rights reserved
Trust Online

Folding Bikes Market