
Reports
Reports
Microalgae products hold promising potentials to combat the morbidity and mortality associated with the novel coronavirus. Antiviral compounds in cyanobacterial lectins, including agglutinin OAA and cyanovirin-N (CV-N) are bring publicized for inhibiting a range of viruses. Such findings have brought companies in the Europe microalgae products market under great scrutiny. Stakeholders are increasing their R&D capabilities in pharmaceutical products that help increase immunity levels of individuals.
During the ongoing COVID-19 pandemic, companies in the Europe microalgae products market are increasing their focus in antiviral compounds such as polysaccharides produced by the well-known Spirulina and Porphyridium microalgae. Other promising sulfate-polysaccharides from spirulina include the calcium-spirulan, which is active against potential viruses, mumps, and influenza.
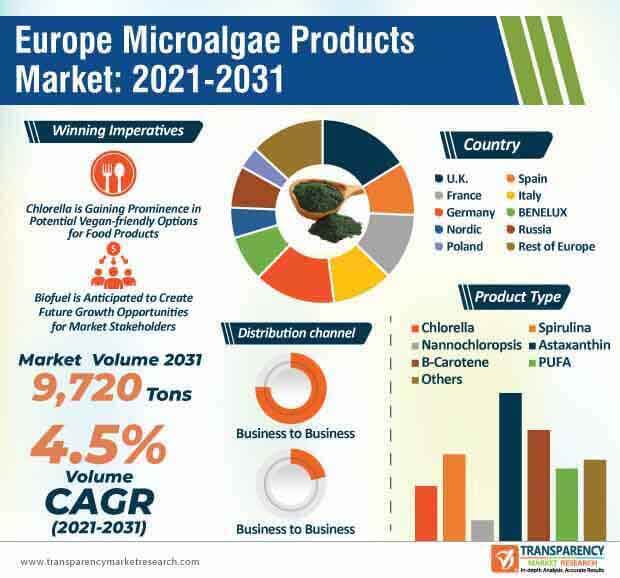
The Europe microalgae products market is estimated to expand from a volume of 6,266 tons in 2021 and reach 9,720 tons by 2031. However, the high cost of operation, infrastructure, and selection of algal strains with high protein contents is inhibiting the growth of the market. Hence, companies are optimizing the manufacturing and commercialization of microalgae ,products since the sale of these products is dependent on market sentiment and financial affairs. This is being achieved by developing innovative and sustainable technologies with minimum energy inputs for large-scale cultivation.
Manufacturers are unlocking revenue opportunities in a wide range of food and high-value products pertaining to cosmetics and medicine. Biofuel is anticipated to create future growth opportunities for market stakeholders.
Microalgae is a nutrient rich source of protein and fiber that has a low environment footprint. Companies in the Europe microalgae products market are expected to enter into partnerships to research the viability of microalgae as an ingredient in food and beverages. This has led to the popularity of Chlorella that has nutritional benefits, antioxidants, and vitamins, among other compounds, which can be used to innovate in novel food products.
Manufacturers in the Europe microalgae products market are increasing R&D in plant-based ingredients that are sustainable, non-GMO (Genetically Modified Organisms), and protein-rich with neutral flavors. Chlorella is gaining prominence in potential vegan-friendly options for food products. As such, plant-based food is becoming a fast growing phenomenon in the nutrition space.
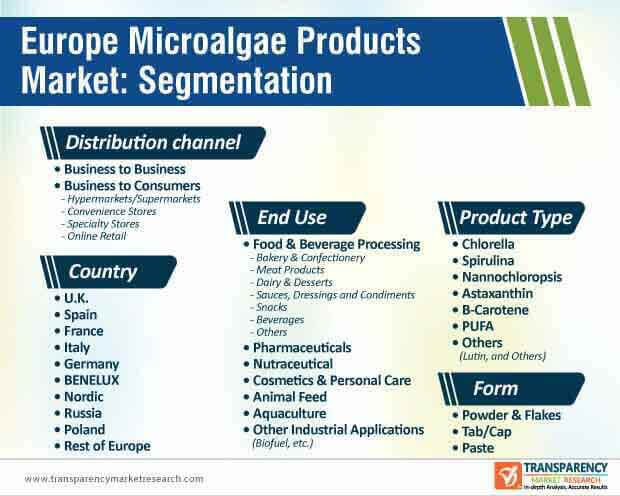
Right from nutraceuticals, the food & beverage processing end use is predicted to dictate the second highest revenue among all other end use types in the Europe microalgae products market. FUL Foods, a Delft start-up, is growing microalgae in photobioreactors, refining it into a superfood to develop a naturally blue tonic. Stakeholders in the market are taking cues from such innovations to refine microalgae into refreshing and fizzy beverages.
The Europe microalgae products market is expected to reach US$ 1.6 Bn by the end of 2031. Manufacturers are anticipated to invest in breweries to produce nutrient dense ingredients for innovating in beverages.
Microalgae is being highly publicized as a super food. On the other hand, algae researchers are investigating its use as a feed for agri- and aquaculture. Manufacturers in the Europe microalgae products market are gaining a strong research base to optimize production of protein and omega-3s for humans with the help of microalgae. Thus, cutting production cost is the key to market success.
The growing popularity of non-animal protein sources is translating into revenue opportunities for companies in the Europe microalgae products market.
Analysts’ Viewpoint
Even as venture capital investments declined due to the COVID-19 outbreak, start-ups have focused on plant-based ingredients to launch new products in order to generate revenue streams. There is a growing demand for microalgae-based proteins in products at grocery stores for budget-conscious consumers and fast food restaurants preferred by high-income groups. However, there is a limitation of authentic and reliable data pertaining to microalgae products market opportunities. Hence, companies should establish long-term research studies to develop systems for the production of sustainable algal-based products. The Europe microalgae products market is slated to clock a CAGR of 5.7% during the forecast period.
Europe Microalgae Products Market: Overview
Europe Microalgae Products: Market Frontrunners
Europe Microalgae Products Market: Trends
Micronutrients play a critical role in the overall nutrition and health of the human body. A plethora of continuous research published in high-profile scientific journals focuses on the benefits of various nutrition ingredients for maintaining the overall health. However, with changes in lifestyles and eating habits, consumers worldwide fail to meet the recommended intake levels of nutrients. The impact of low micronutrient intake is a major public health concern, resulting in vulnerability to infections and diseases. This has resulted in increased consumption of dietary supplements for supporting overall health.
Microalgae products are excellent sources of vitamins such as vitamin A, B1, B2, B6, B12, C and E and minerals such as potassium, iron, magnesium, calcium and iodine. Microalgae products are marketed as healthy foods, and are available as capsules, tablets, powders and liquids due to their high protein content and nutritional value.
Consumers today demand healthy food and are concerned about the environment as well. Manufacturers are constantly innovating ways for sourcing raw materials as well as producing products in the most sustainable ways to attract more customers. Microalgae-based products offer a potential solution for global food security and mitigate environmental issues caused by the expansion of land-based products. The competition with agriculture for food production can be avoided, as microalgae-based products offer great flexibility and adaptability to grow in diverse environments with less use of arable land than terrestrial plants. The growth rate of microalgae is also 5-10 times faster than conventional food crops, making them a sustainable source for different food and feed products.
Fishmeal is the preferred protein ingredient of feed in aquaculture, contributing significantly to the variable production cost. However, decreasing fishmeal supply and increasing costs threaten the sustainability and growth of the aquaculture industry. Therefore, the demand for products that can completely or partially substitute fishmeal with alternative proteins is rising. Microalgae-based products can be used worldwide as an alternate protein source replacing fishmeal successfully. In feeding trials with fish, many types of microalgae have been found to be useful for increasing growth, feed utilization, physiological activity, stress response, starvation tolerance, disease resistance, and carcass quality. Thus, an opportunity exists for manufacturers to increase the penetration of microalgae products in the growing aquaculture industry as cost price reductions of 60-80% can be achieved with state of the art production systems at large production facilities.
Europe Microalgae Products Market: Strategies
Europe Microalgae Products Market: Key Players
1. Executive Summary
1.1. Europe Market Outlook
1.2. Demand Side Trends
1.3. Supply Side Trends
1.4. Analysis and Recommendations
2. Market Overview
2.1. Market Coverage / Taxonomy
2.2. Market Definition / Scope / Limitations
3. Key Market Trends
3.1. Key Trends Impacting the Market
3.2. Product Innovation / Development Trends
4. Key Success Factors
4.1. Product Adoption / Usage Analysis
4.2. Product USPs / Features
4.3. Strategic Promotional Strategies
5. Europe Microalgae Products Market Demand (in Value or Size in US$ Mn) Analysis 2016–2020 and Forecast, 2021–2031
5.1. Historical Market Volume (Tons) & Value (US$ Mn) Analysis, 2016–2020
5.2. Current and Future Market Volume (Tons) & Value (US$ Mn) Projections, 2021–2031
5.2.1. Y-o-Y Growth Trend Analysis
5.2.2. Absolute $ Opportunity Analysis
6. Europe Microalgae Products Market - Pricing Analysis
6.1. Regional Pricing Analysis
6.2. Europe Average Pricing Analysis Benchmark
7. Market Background
7.1. Macro-Economic Factors
7.1.1. Europe GDP Growth Outlook
7.1.2. Europe Industry Value Added
7.1.3. Europe Urbanization Growth Outlook
7.1.4. Europe Food Security Index Outlook
7.1.5. Europe Rank – Ease of Doing Business
7.1.6. Europe Rank – Trading Across Borders
7.2. Impact of COVID-19 on Food & Beverage Industry
7.2.1. Manufacturer/Processors
7.2.2. Supply Chain and Logistics
7.2.3. Wholesalers/Traders
7.2.4. Retailers
7.3. Impact of COVID-19 on Food Processing Industry
7.4. COVID-19 Risk Assessment/Impact
7.5. Europe Food & Beverage Industry Outlook
7.6. Europe Bakery Industry Outlook
7.7. Europe Infant Food Industry Outlook
7.8. Europe Organic Food and Beverage Outlook
7.9. Microalgae Products Business Outlook
7.9.1. Processing Technology Overview
7.9.2. Forms of Microalgae Products offered by Key Players
7.9.3. Overview of Various Marine Products and Their Derivatives
7.9.4. Commercially Important Varieties of Microalgae Naturally Found and Cultivated in the World
7.9.5. Microalgae Production Scenario, by Country/Region
7.9.6. Nutritional Composition of Chlorella
7.9.7. Extraction and Purification Techniques for Chlorella
7.9.8. Policy Developments and Regulatory Scenario
7.10. Value Chain Analysis
7.10.1. Margins Notes on Value Added at Each Node in the Value Chain
7.10.1.1. Microalgae Growers/Cultivators
7.10.1.2. Microalgae Processors
7.10.1.3. Microalgae Extract Producers
7.10.1.4. Wholesalers/Distributors
7.10.1.5. End Use Companies
7.11. Key Regulations
7.12. Key Certifications/Claims
7.13. Market Dynamics
7.13.1. Drivers
7.13.2. Restraints
7.13.3. Opportunity Analysis
7.14. Forecast Factors - Relevance & Impact
8. Europe Microalgae Products Market Analysis 2016-2020 and Forecast 2021-2031, By Product Type
8.1. Introduction / Key Findings
8.2. Historical Market Size (US$ Mn) and Volume Analysis By Product Type, 2016 - 2020
8.3. Current and Future Market Size (US$ Mn) and Volume Analysis and Forecast By Product Type, 2021 - 2031
8.3.1. Chlorella
8.3.2. Spirulina
8.3.3. Nannochloropsis
8.3.4. Astaxanthin
8.3.5. B-Carotene
8.3.6. PUFA
8.3.7. Others
8.4. Market Attractiveness Analysis By Product Type
9. Europe Microalgae Products Market Analysis 2016-2020 and Forecast 2021-2031, By Form
9.1. Introduction / Key Findings
9.2. Historical Market Size (US$ Mn) and Volume Analysis By Form, 2016 - 2020
9.3. Current and Future Market Size (US$ Mn) and Volume Analysis and Forecast By Form, 2021 - 2031
9.3.1. Powder & Flakes
9.3.2. Tab/Cap
9.3.3. Paste
9.4. Market Attractiveness Analysis By Form
10. Europe Microalgae Products Market Analysis 2016-2020 and Forecast 2021-2031, By End-use
10.1. Introduction / Key Findings
10.2. Historical Market Size (US$ Mn) and Volume Analysis By End-use, 2016 - 2020
10.3. Current and Future Market Size (US$ Mn) and Volume Analysis and Forecast By End-use, 2021 - 2031
10.3.1. Food & Beverage Processing
10.3.1.1. Bakery & Confectionery
10.3.1.2. Meat Products
10.3.1.3. Dairy & Desserts
10.3.1.4. Sauces, Dressings and Condiments
10.3.1.5. Snacks
10.3.1.6. Beverages
10.3.1.7. Others
10.3.2. Pharmaceuticals
10.3.3. Nutraceutical
10.3.4. Cosmetics & Personal Care
10.3.5. Animal Feed
10.3.6. Aquaculture
10.3.7. Other Industrial Applications (Biofuel, etc.)
10.4. Market Attractiveness Analysis By End-use
11. Europe Microalgae Products Market Analysis 2016-2020 and Forecast 2021-2031, By Distribution Channel
11.1. Introduction / Key Findings
11.2. Historical Market Size (US$ Mn) and Volume Analysis By Distribution Channel, 2016 - 2020
11.3. Current and Future Market Size (US$ Mn) and Volume Analysis and Forecast By Distribution Channel, 2021 - 2031
11.3.1. Business to Business
11.3.2. Business to Consumers
11.3.2.1. Hypermarkets/Supermarket
11.3.2.2. Convenience Stores
11.3.2.3. Specialty Stores
11.3.2.4. Online Retails
11.4. Market Attractiveness Analysis By Distribution Channel
12. Europe Microalgae Products Market Analysis 2016-2020 and Forecast 2021-2031, By Country
12.1. Introduction
12.2. Historical Market Size (US$ Mn) and Volume Analysis By Country, 2016 - 2020
12.3. Current Market Size (US$ Mn) and Volume Analysis and Forecast By Country, 2021 - 2031
12.3.1. U.K.
12.3.2. Spain
12.3.3. France
12.3.4. Italy
12.3.5. Germany
12.3.6. BENELUX
12.3.7. Nordic
12.3.8. Russia
12.3.9. Poland
12.3.10. Rest of EU
12.4. Market Attractiveness Analysis By Country
13. U.K. Microalgae Products Market Analysis 2016-2020 and Forecast 2021-2031
13.1. Introduction
13.2. Historical Market Size (US$ Mn) and Volume Trend Analysis By Market Taxonomy, 2016 - 2020
13.3. Market Size (US$ Mn) and Volume Forecast By Market Taxonomy, 2021 – 2031
13.3.1. By Product Type
13.3.2. By Form
13.3.3. By End-use
13.3.4. By Distribution Channel
13.4. Market Attractiveness Analysis
13.4.1. By Product Type
13.4.2. By Form
13.4.3. By End-use
13.4.4. By Distribution Channel
13.5. Drivers and Restraints - Impact Analysis
14. Spain Microalgae Products Market Analysis 2016-2020 and Forecast 2021-2031
14.1. Introduction
14.2. Historical Market Size (US$ Mn) and Volume Trend Analysis By Market Taxonomy, 2016 - 2020
14.3. Market Size (US$ Mn) and Volume Forecast By Market Taxonomy, 2021 - 2031
14.3.1. By Product Type
14.3.2. By Form
14.3.3. By End-use
14.3.4. By Distribution Channel
14.4. Market Attractiveness Analysis
14.4.1. By Product Type
14.4.2. By Form
14.4.3. By End-use
14.4.4. By Distribution Channel
14.5. Drivers and Restraints - Impact Analysis
15. France Microalgae Products Market Analysis 2016-2020 and Forecast 2021-2031
15.1. Introduction
15.2. Historical Market Size (US$ Mn) and Volume Trend Analysis By Market Taxonomy, 2016 - 2020
15.3. Market Size (US$ Mn) and Volume Forecast By Market Taxonomy, 2021 - 2031
15.3.1. By Product Type
15.3.2. By Form
15.3.3. By End-use
15.3.4. By Distribution Channel
15.4. Market Attractiveness Analysis
15.4.1. By Product Type
15.4.2. By Form
15.4.3. By End-use
15.4.4. By Distribution Channel
15.5. Drivers and Restraints - Impact Analysis
16. Italy Microalgae Products Market Analysis 2016-2020 and Forecast 2021-2031
16.1. Introduction
16.2. Historical Market Size (US$ Mn) and Volume Trend Analysis By Market Taxonomy, 2016 - 2020
16.3. Market Size (US$ Mn) and Volume Forecast By Market Taxonomy, 2021 - 2031
16.3.1. By Product Type
16.3.2. By Form
16.3.3. By End-use
16.3.4. By Distribution Channel
16.4. Market Attractiveness Analysis
16.4.1. By Product Type
16.4.2. By Form
16.4.3. By End-use
16.4.4. By Distribution Channel
16.5. Drivers and Restraints - Impact Analysis
17. Germany Microalgae Products Market Analysis 2016-2020 and Forecast 2021-2031
17.1. Introduction
17.2. Historical Market Size (US$ Mn) and Volume Trend Analysis By Market Taxonomy, 2016 - 2020
17.3. Market Size (US$ Mn) and Volume Forecast By Market Taxonomy, 2021 - 2031
17.3.1. By Product Type
17.3.2. By Form
17.3.3. By End-use
17.3.4. By Distribution Channel
17.4. Market Attractiveness Analysis
17.4.1. By Product Type
17.4.2. By Form
17.4.3. By End-use
17.4.4. By Distribution Channel
17.5. Drivers and Restraints - Impact Analysis
18. BENELUX Microalgae Products Market Analysis 2016-2020 and Forecast 2021-2031
18.1. Introduction
18.2. Historical Market Size (US$ Mn) and Volume Trend Analysis By Market Taxonomy, 2016 - 2020
18.3. Market Size (US$ Mn) and Volume Forecast By Market Taxonomy, 2021 - 2031
18.3.1. By Product Type
18.3.2. By Form
18.3.3. By End-use
18.3.4. By Distribution Channel
18.4. Market Attractiveness Analysis
18.4.1. By Product Type
18.4.2. By Form
18.4.3. By End-use
18.4.4. By Distribution Channel
18.5. Drivers and Restraints - Impact Analysis
19. Nordic Microalgae Products Market Analysis 2016-2020 and Forecast 2021-2031
19.1. Introduction
19.2. Historical Market Size (US$ Mn) and Volume Trend Analysis By Market Taxonomy, 2016 - 2020
19.3. Market Size (US$ Mn) and Volume Forecast By Market Taxonomy, 2021 - 2031
19.3.1. By Product Type
19.3.2. By Form
19.3.3. By End-use
19.3.4. By Distribution Channel
19.4. Market Attractiveness Analysis
19.4.1. By Product Type
19.4.2. By Form
19.4.3. By End-use
19.4.4. By Distribution Channel
19.5. Drivers and Restraints - Impact Analysis
20. Russia Microalgae Products Market Analysis 2016-2020 and Forecast 2021-2031
20.1. Introduction
20.2. Historical Market Size (US$ Mn) and Volume Trend Analysis By Market Taxonomy, 2016 - 2020
20.3. Market Size (US$ Mn) and Volume Forecast By Market Taxonomy, 2021 - 2031
20.3.1. By Product Type
20.3.2. By Form
20.3.3. By End-use
20.3.4. By Distribution Channel
20.4. Market Attractiveness Analysis
20.4.1. By Product Type
20.4.2. By Form
20.4.3. By End-use
20.4.4. By Distribution Channel
20.5. Drivers and Restraints - Impact Analysis
21. Poland Microalgae Products Market Analysis 2016-2020 and Forecast 2021-2031
21.1. Introduction
21.2. Historical Market Size (US$ Mn) and Volume Trend Analysis By Market Taxonomy, 2016 - 2020
21.3. Market Size (US$ Mn) and Volume Forecast By Market Taxonomy, 2021 - 2031
21.3.1. By Product Type
21.3.2. By Form
21.3.3. By End-use
21.3.4. By Distribution Channel
21.4. Market Attractiveness Analysis
21.4.1. By Product Type
21.4.2. By Form
21.4.3. By End-use
21.4.4. By Distribution Channel
21.5. Drivers and Restraints - Impact Analysis
22. Rest of Europe Microalgae Products Market Analysis 2016-2020 and Forecast 2021-2031
22.1. Introduction
22.2. Historical Market Size (US$ Mn) and Volume Trend Analysis By Market Taxonomy, 2016 - 2020
22.3. Market Size (US$ Mn) and Volume Forecast By Market Taxonomy, 2021 - 2031
22.3.1. By Product Type
22.3.2. By Form
22.3.3. By End-use
22.3.4. By Distribution Channel
22.4. Market Attractiveness Analysis
22.4.1. By Product Type
22.4.2. By Form
22.4.3. By End-use
22.4.4. By Distribution Channel
22.5. Drivers and Restraints - Impact Analysis
23. Market Structure Analysis
23.1. Market Analysis By Tier of Companies
23.2. Market Concentration
23.3. Market Presence Analysis
24. Competition Analysis
24.1. Competition Dashboard
24.2. Competition Deep Dive
24.2.1. DSM N.V.
24.2.1.1. Overview
24.2.1.2. Product Portfolio
24.2.1.3. Sales Footprint
24.2.1.4. Key Developments
24.2.1.5. Strategy Overview
24.2.2. DIC Corporation
24.2.2.1. Overview
24.2.2.2. Product Portfolio
24.2.2.3. Sales Footprint
24.2.2.4. Key Developments
24.2.2.5. Strategy Overview
24.2.3. Phycom
24.2.3.1. Overview
24.2.3.2. Product Portfolio
24.2.3.3. Sales Footprint
24.2.3.4. Key Developments
24.2.3.5. Strategy Overview
24.2.4. Chr. Hansen Holding A/S
24.2.4.1. Overview
24.2.4.2. Product Portfolio
24.2.4.3. Sales Footprint
24.2.4.4. Key Developments
24.2.4.5. Strategy Overview
24.2.5. Naturex S.A
24.2.5.1. Overview
24.2.5.2. Product Portfolio
24.2.5.3. Sales Footprint
24.2.5.4. Key Developments
24.2.5.5. Strategy Overview
24.2.6. Allmicroalgae Natural Products S.A
24.2.6.1. Overview
24.2.6.2. Product Portfolio
24.2.6.3. Sales Footprint
24.2.6.4. Key Developments
24.2.6.5. Strategy Overview
24.2.7. Fuqing King Dnarmsa Spirulina Co. Ltd.
24.2.7.1. Overview
24.2.7.2. Product Portfolio
24.2.7.3. Sales Footprint
24.2.7.4. Key Developments
24.2.7.5. Strategy Overview
24.2.8. Beijing Gingko Group
24.2.8.1. Overview
24.2.8.2. Product Portfolio
24.2.8.3. Sales Footprint
24.2.8.4. Key Developments
24.2.8.5. Strategy Overview
24.2.9. Divi’s laboratories Ltd.
24.2.9.1. Overview
24.2.9.2. Product Portfolio
24.2.9.3. Sales Footprint
24.2.9.4. Key Developments
24.2.9.5. Strategy Overview
24.2.10. NOW Health Group, Inc.
24.2.10.1. Overview
24.2.10.2. Product Portfolio
24.2.10.3. Sales Footprint
24.2.10.4. Key Developments
24.2.10.5. Strategy Overview
24.2.11. Monzón Biotech
24.2.11.1. Overview
24.2.11.2. Product Portfolio
24.2.11.3. Sales Footprint
24.2.11.4. Key Developments
24.2.11.5. Strategy Overview
24.2.12. Cyanotech Corporation
24.2.12.1. Overview
24.2.12.2. Product Portfolio
24.2.12.3. Sales Footprint
24.2.12.4. Key Developments
24.2.12.5. Strategy Overview
24.2.13. Algatechnologies Ltd.
24.2.13.1. Overview
24.2.13.2. Product Portfolio
24.2.13.3. Sales Footprint
24.2.13.4. Key Developments
24.2.13.5. Strategy Overview
24.2.14. Reed Mariculture
24.2.14.1. Overview
24.2.14.2. Product Portfolio
24.2.14.3. Sales Footprint
24.2.14.4. Key Developments
24.2.14.5. Strategy Overview
24.2.15. Arizona Algae Products LLC
24.2.15.1. Overview
24.2.15.2. Product Portfolio
24.2.15.3. Sales Footprint
24.2.15.4. Key Developments
24.2.15.5. Strategy Overview
24.2.16. Sun Chlorella Corporation
24.2.16.1. Overview
24.2.16.2. Product Portfolio
24.2.16.3. Sales Footprint
24.2.16.4. Key Developments
24.2.16.5. Strategy Overview
24.2.17. Yaeyama Shokusan Co Ltd.
24.2.17.1. Overview
24.2.17.2. Product Portfolio
24.2.17.3. Sales Footprint
24.2.17.4. Key Developments
24.2.17.5. Strategy Overview
24.2.18. Taiwan Chlorella Manufacturing Co. Ltd.
24.2.18.1. Overview
24.2.18.2. Product Portfolio
24.2.18.3. Sales Footprint
24.2.18.4. Key Developments
24.2.18.5. Strategy Overview
24.2.19. Far East Microalgae Ind Co. Ltd.
24.2.19.1. Overview
24.2.19.2. Product Portfolio
24.2.19.3. Sales Footprint
24.2.19.4. Key Developments
24.2.19.5. Strategy Overview
24.2.20. Vedan Biotechnology Corp.
24.2.20.1. Overview
24.2.20.2. Product Portfolio
24.2.20.3. Sales Footprint
24.2.20.4. Key Developments
24.2.20.5. Strategy Overview
25. Assumptions and Acronyms Used
26. Research Methodology
List of Tables
Table 01: Europe Microalgae Products Market Value (US$ Mn) Analysis and Forecast By Product Type, 2016-2031
Table 02: Europe Microalgae Products Market Volume (Tons) Analysis and Forecast By Product Type, 2016-2031
Table 03: Europe Microalgae Products Market Value (US$ Mn) Analysis and Forecast By Form, 2016-2031
Table 04: Europe Microalgae Products Market Volume (Tons) Analysis and Forecast By Form, 2016-2031
Table 05: Europe Microalgae Products Market Value (US$ Mn) Analysis and Forecast by End-use, 2016-2031
Table 06: Europe Microalgae Products Market Volume (Tons) Analysis and Forecast by End-use, 2016-2031
Table 07: Europe Microalgae Products Market Value (US$ Mn) Analysis and Forecast by Food & Beverages Processing, 2016-2031
Table 08: Europe Microalgae Products Market Volume (Tons) Analysis and Forecast by Food & Beverages Processing, 2016-2031
Table 09: Europe Microalgae Products Market Value (US$ Mn) Analysis and Forecast by Distribution Channel, 2016-2031
Table 10: Europe Microalgae Products Market Volume (Tons) Analysis and Forecast Distribution Channel, 2016-2031
Table 11: Europe Microalgae Products Market Value (US$ Mn) Analysis and Forecast by Business to Consumer, 2016-2031
Table 12: Europe Microalgae Products Market Volume (Tons) Analysis and Forecast by Business to Consumer, 2016-2031
Table 13: Europe Microalgae Products Market Value (US$ Mn) Analysis and Forecast by Country, 2016-2031
Table 14: Europe Microalgae Products Market Volume (Tons) Analysis and Forecast by Country, 2016-2031
Table 15: U.K. Microalgae Products Market Value (US$ Mn) Analysis and Forecast By Product Type, 2016-2031
Table 16: U.K. Microalgae Products Market Volume (Tons) Analysis and Forecast By Product Type, 2016-2031
Table 17: U.K. Microalgae Products Market Value (US$ Mn) Analysis and Forecast By Form, 2016-2031
Table 18: U.K. Microalgae Products Market Volume (Tons) Analysis and Forecast By Form, 2016-2031
Table 19: U.K. Microalgae Products Market Value (US$ Mn) Analysis and Forecast by End-use, 2016-2031
Table 20: U.K. Microalgae Products Market Volume (Tons) Analysis and Forecast by End-use, 2016-2031
Table 21: U.K. Microalgae Products Market Value (US$ Mn) Analysis and Forecast by Food & Beverages Processing, 2016-2031
Table 22: U.K. Microalgae Products Market Volume (Tons) Analysis and Forecast by Food & Beverages Processing, 2016-2031
Table 23: U.K. Microalgae Products Market Value (US$ Mn) Analysis and Forecast by Distribution Channel, 2016-2031
Table 24: U.K. Microalgae Products Market Volume (Tons) Analysis and Forecast Distribution Channel, 2016-2031
Table 25: U.K. Microalgae Products Market Value (US$ Mn) Analysis and Forecast by Business to Consumer, 2016-2031
Table 26: U.K. Microalgae Products Market Volume (Tons) Analysis and Forecast by Business to Consumer, 2016-2031
Table 27: Spain Microalgae Products Market Value (US$ Mn) Analysis and Forecast By Product Type, 2016-2031
Table 28: Spain Microalgae Products Market Volume (Tons) Analysis and Forecast By Product Type, 2016-2031
Table 29: Spain Microalgae Products Market Value (US$ Mn) Analysis and Forecast By Form, 2016-2031
Table 30: Spain Microalgae Products Market Volume (Tons) Analysis and Forecast By Form, 2016-2031
Table 31: Spain Microalgae Products Market Value (US$ Mn) Analysis and Forecast by End-use, 2016-2031
Table 32: Spain Microalgae Products Market Volume (Tons) Analysis and Forecast by End-use, 2016-2031
Table 33: Spain Microalgae Products Market Value (US$ Mn) Analysis and Forecast by Food & Beverages Processing, 2016-2031
Table 34: Spain Microalgae Products Market Volume (Tons) Analysis and Forecast by Food & Beverages Processing, 2016-2031
Table 35: Spain Microalgae Products Market Value (US$ Mn) Analysis and Forecast by Distribution Channel, 2016-2031
Table 36: Spain Microalgae Products Market Volume (Tons) Analysis and Forecast Distribution Channel, 2016-2031
Table 37: Spain Microalgae Products Market Value (US$ Mn) Analysis and Forecast by Business to Consumer, 2016-2031
Table 38: Spain Microalgae Products Market Volume (Tons) Analysis and Forecast by Business to Consumer, 2016-2031
Table 39: France Microalgae Products Market Value (US$ Mn) Analysis and Forecast By Product Type, 2016-2031
Table 40: France Microalgae Products Market Volume (Tons) Analysis and Forecast By Product Type, 2016-2031
Table 41: France Microalgae Products Market Value (US$ Mn) Analysis and Forecast By Form, 2016-2031
Table 42: France Microalgae Products Market Volume (Tons) Analysis and Forecast By Form, 2016-2031
Table 43: France Microalgae Products Market Value (US$ Mn) Analysis and Forecast by End-use, 2016-2031
Table 44: France Microalgae Products Market Volume (Tons) Analysis and Forecast by End-use, 2016-2031
Table 45: France Microalgae Products Market Value (US$ Mn) Analysis and Forecast by Food & Beverages Processing, 2016-2031
Table 46: France Microalgae Products Market Volume (Tons) Analysis and Forecast by Food & Beverages Processing, 2016-2031
Table 47: France Microalgae Products Market Value (US$ Mn) Analysis and Forecast by Distribution Channel, 2016-2031
Table 48: France Microalgae Products Market Volume (Tons) Analysis and Forecast Distribution Channel, 2016-2031
Table 49: France Microalgae Products Market Value (US$ Mn) Analysis and Forecast by Business to Consumer, 2016-2031
Table 50: France Microalgae Products Market Volume (Tons) Analysis and Forecast by Business to Consumer, 2016-2031
Table 51: Italy Microalgae Products Market Value (US$ Mn) Analysis and Forecast By Product Type, 2016-2031
Table 52: Italy Microalgae Products Market Volume (Tons) Analysis and Forecast By Product Type, 2016-2031
Table 53: Italy Microalgae Products Market Value (US$ Mn) Analysis and Forecast By Form, 2016-2031
Table 54: Italy Microalgae Products Market Volume (Tons) Analysis and Forecast By Form, 2016-2031
Table 55: Italy Microalgae Products Market Value (US$ Mn) Analysis and Forecast by End-use, 2016-2031
Table 56: Italy Microalgae Products Market Volume (Tons) Analysis and Forecast by End-use, 2016-2031
Table 57: Italy Microalgae Products Market Value (US$ Mn) Analysis and Forecast by Food & Beverages Processing, 2016-2031
Table 58: Italy Microalgae Products Market Volume (Tons) Analysis and Forecast by Food & Beverages Processing, 2016-2031
Table 59: Italy Microalgae Products Market Value (US$ Mn) Analysis and Forecast by Distribution Channel, 2016-2031
Table 60: Italy Microalgae Products Market Volume (Tons) Analysis and Forecast Distribution Channel, 2016-2031
Table 61: Italy Microalgae Products Market Value (US$ Mn) Analysis and Forecast by Business to Consumer, 2016-2031
Table 62: Italy Microalgae Products Market Volume (Tons) Analysis and Forecast by Business to Consumer, 2016-2031
Table 63: Germany Microalgae Products Market Value (US$ Mn) Analysis and Forecast By Product Type, 2016-2031
Table 64: Germany Microalgae Products Market Volume (Tons) Analysis and Forecast By Product Type, 2016-2031
Table 65: Germany Microalgae Products Market Value (US$ Mn) Analysis and Forecast By Form, 2016-2031
Table 66: Germany Microalgae Products Market Volume (Tons) Analysis and Forecast By Form, 2016-2031
Table 67: Germany Microalgae Products Market Value (US$ Mn) Analysis and Forecast by End-use, 2016-2031
Table 68: Germany Microalgae Products Market Volume (Tons) Analysis and Forecast by End-use, 2016-2031
Table 69: Germany Microalgae Products Market Value (US$ Mn) Analysis and Forecast by Food & Beverages Processing, 2016-2031
Table 70: Germany Microalgae Products Market Volume (Tons) Analysis and Forecast by Food & Beverages Processing, 2016-2031
Table 71: Germany Microalgae Products Market Value (US$ Mn) Analysis and Forecast by Distribution Channel, 2016-2031
Table 72: Germany Microalgae Products Market Volume (Tons) Analysis and Forecast Distribution Channel, 2016-2031
Table 73: Germany Microalgae Products Market Value (US$ Mn) Analysis and Forecast by Business to Consumer, 2016-2031
Table 74: Germany Microalgae Products Market Volume (Tons) Analysis and Forecast by Business to Consumer, 2016-2031
Table 75: BENELUX Microalgae Products Market Value (US$ Mn) Analysis and Forecast By Product Type, 2016-2031
Table 76: BENELUX Microalgae Products Market Volume (Tons) Analysis and Forecast By Product Type, 2016-2031
Table 77: BENELUX Microalgae Products Market Value (US$ Mn) Analysis and Forecast By Form, 2016-2031
Table 78: BENELUX Microalgae Products Market Volume (Tons) Analysis and Forecast By Form, 2016-2031
Table 79: BENELUX Microalgae Products Market Value (US$ Mn) Analysis and Forecast by End-use, 2016-2031
Table 80: BENELUX Microalgae Products Market Volume (Tons) Analysis and Forecast by End-use, 2016-2031
Table 81: BENELUX Microalgae Products Market Value (US$ Mn) Analysis and Forecast by Food & Beverages Processing, 2016-2031
Table 82: BENELUX Microalgae Products Market Volume (Tons) Analysis and Forecast by Food & Beverages Processing, 2016-2031
Table 83: BENELUX Microalgae Products Market Value (US$ Mn) Analysis and Forecast by Distribution Channel, 2016-2031
Table 84: BENELUX Microalgae Products Market Volume (Tons) Analysis and Forecast Distribution Channel, 2016-2031
Table 85: BENELUX Microalgae Products Market Value (US$ Mn) Analysis and Forecast by Business to Consumer, 2016-2031
Table 86: BENELUX Microalgae Products Market Volume (Tons) Analysis and Forecast by Business to Consumer, 2016-2031
Table 87: Nordic Microalgae Products Market Value (US$ Mn) Analysis and Forecast By Product Type, 2016-2031
Table 88: Nordic Microalgae Products Market Volume (Tons) Analysis and Forecast By Product Type, 2016-2031
Table 89: Nordic Microalgae Products Market Value (US$ Mn) Analysis and Forecast By Form, 2016-2031
Table 90: Nordic Microalgae Products Market Volume (Tons) Analysis and Forecast By Form, 2016-2031
Table 91: Nordic Microalgae Products Market Value (US$ Mn) Analysis and Forecast by End-use, 2016-2031
Table 92: Nordic Microalgae Products Market Volume (Tons) Analysis and Forecast by End-use, 2016-2031
Table 93: Nordic Microalgae Products Market Value (US$ Mn) Analysis and Forecast by Food & Beverages Processing, 2016-2031
Table 94: Nordic Microalgae Products Market Volume (Tons) Analysis and Forecast by Food & Beverages Processing, 2016-2031
Table 95: Nordic Microalgae Products Market Value (US$ Mn) Analysis and Forecast by Distribution Channel, 2016-2031
Table 96: Nordic Microalgae Products Market Volume (Tons) Analysis and Forecast Distribution Channel, 2016-2031
Table 97: Nordic Microalgae Products Market Value (US$ Mn) Analysis and Forecast by Business to Consumer, 2016-2031
Table 98: Nordic Microalgae Products Market Volume (Tons) Analysis and Forecast by Business to Consumer, 2016-2031
Table 99: Russia Microalgae Products Market Value (US$ Mn) Analysis and Forecast By Product Type, 2016-2031
Table 100: Russia Microalgae Products Market Volume (Tons) Analysis and Forecast By Product Type, 2016-2031
Table 101: Russia Microalgae Products Market Value (US$ Mn) Analysis and Forecast By Form, 2016-2031
Table 102: Russia Microalgae Products Market Volume (Tons) Analysis and Forecast By Form, 2016-2031
Table 103: Russia Microalgae Products Market Value (US$ Mn) Analysis and Forecast by End-use, 2016-2031
Table 104: Russia Microalgae Products Market Volume (Tons) Analysis and Forecast by End-use, 2016-2031
Table 105: Russia Microalgae Products Market Value (US$ Mn) Analysis and Forecast by Food & Beverages Processing, 2016-2031
Table 106: Russia Microalgae Products Market Volume (Tons) Analysis and Forecast by Food & Beverages Processing, 2016-2031
Table 107: Russia Microalgae Products Market Value (US$ Mn) Analysis and Forecast by Distribution Channel, 2016-2031
Table 108: Russia Microalgae Products Market Volume (Tons) Analysis and Forecast Distribution Channel, 2016-2031
Table 109: Russia Microalgae Products Market Value (US$ Mn) Analysis and Forecast by Business to Consumer, 2016-2031
Table 110: Russia Microalgae Products Market Volume (Tons) Analysis and Forecast by Business to Consumer, 2016-2031
Table 111: Poland Microalgae Products Market Value (US$ Mn) Analysis and Forecast By Product Type, 2016-2031
Table 112: Poland Microalgae Products Market Volume (Tons) Analysis and Forecast By Product Type, 2016-2031
Table 113: Poland Microalgae Products Market Value (US$ Mn) Analysis and Forecast By Form, 2016-2031
Table 114: Poland Microalgae Products Market Volume (Tons) Analysis and Forecast By Form, 2016-2031
Table 115: Poland Microalgae Products Market Value (US$ Mn) Analysis and Forecast by End-use, 2016-2031
Table 116: Poland Microalgae Products Market Volume (Tons) Analysis and Forecast by End-use, 2016-2031
Table 117: Poland Microalgae Products Market Value (US$ Mn) Analysis and Forecast by Food & Beverages Processing, 2016-2031
Table 118: Poland Microalgae Products Market Volume (Tons) Analysis and Forecast by Food & Beverages Processing, 2016-2031
Table 119: Poland Microalgae Products Market Value (US$ Mn) Analysis and Forecast by Distribution Channel, 2016-2031
Table 120: Poland Microalgae Products Market Volume (Tons) Analysis and Forecast Distribution Channel, 2016-2031
Table 121: Poland Microalgae Products Market Value (US$ Mn) Analysis and Forecast by Business to Consumer, 2016-2031
Table 122: Poland Microalgae Products Market Volume (Tons) Analysis and Forecast by Business to Consumer, 2016-2031
Table 123: Rest of Europe Microalgae Products Market Value (US$ Mn) Analysis and Forecast By Product Type, 2016-2031
Table 124: Rest of Europe Microalgae Products Market Volume (Tons) Analysis and Forecast By Product Type, 2016-2031
Table 125: Rest of Europe Microalgae Products Market Value (US$ Mn) Analysis and Forecast By Form, 2016-2031
Table 126: Rest of Europe Microalgae Products Market Volume (Tons) Analysis and Forecast By Form, 2016-2031
Table 127: Rest of Europe Microalgae Products Market Value (US$ Mn) Analysis and Forecast by End-use, 2016-2031
Table 128: Rest of Europe Microalgae Products Market Volume (Tons) Analysis and Forecast by End-use, 2016-2031
Table 129: Rest of Europe Microalgae Products Market Value (US$ Mn) Analysis and Forecast by Food & Beverages Processing, 2016-2031
Table 130: Rest of Europe Microalgae Products Market Volume (Tons) Analysis and Forecast by Food & Beverages Processing, 2016-2031
Table 131: Rest of Europe Microalgae Products Market Value (US$ Mn) Analysis and Forecast by Distribution Channel, 2016-2031
Table 132: Rest of Europe Microalgae Products Market Volume (Tons) Analysis and Forecast Distribution Channel, 2016-2031
Table 133: Rest of Europe Microalgae Products Market Value (US$ Mn) Analysis and Forecast by Business to Consumer, 2016-2031
Table 134: Rest of Europe Microalgae Products Market Volume (Tons) Analysis and Forecast by Business to Consumer, 2016-2031
List of Figures
Figure 01: Europe Microalgae Products Market Value (US$ Mn) Forecast, 2021–2031
Figure 02: Europe Microalgae Products Market Volume (Tons) Forecast, 2021–2031
Figure 03: Europe Microalgae Products Market Value Share Analysis By Product Type, 2021 E
Figure 04: Europe Microalgae Products Market Y-o-Y Growth Rate By Product Type, 2021-2031
Figure 05: Europe Microalgae Products Market Value (US$ Mn) Analysis & Forecast By Product Type, 2021–2031
Figure 06: Europe Microalgae Products Market Volume (Tons) Analysis & Forecast By Product Type, 2021–2031
Figure 07: Europe Microalgae Products Market Value Share Analysis By Form, 2021 E
Figure 08: Europe Microalgae Products Market Y-o-Y Growth Rate By Form, 2021-2031
Figure 09: Europe Microalgae Products Market Value (US$ Mn) Analysis & Forecast By Form, 2021–2031
Figure 10: Europe Microalgae Products Market Volume (Tons) Analysis & Forecast By Form, 2021–2031
Figure 11: Europe Microalgae Products Market Value Share Analysis by End-use, 2021 E
Figure 12: Europe Microalgae Products Market Y-o-Y Growth Rate by End-use, 2021-2031
Figure 13: Europe Microalgae Products Market Value (US$ Mn) Analysis & Forecast by End-use, 2021–2031
Figure 14: Europe Microalgae Products Market Volume (Tons) Analysis & Forecast by End-use, 2021–2031
Figure 15: Europe Microalgae Products Market Value Share Analysis By Distribution Channel, 2021 E
Figure 16: Europe Microalgae Products Market Y-o-Y Growth Rate By Distribution Channel, 2021-2031
Figure 17: Europe Microalgae Products Market Value (US$ Mn) Analysis & Forecast By Distribution Channel, 2021–2031
Figure 18: Europe Microalgae Products Market Volume (Tons) Analysis & Forecast By Distribution Channel, 2021–2031
Figure 19: Europe Microalgae Products Market Value Share Analysis by Country, 2021 E
Figure 20: Europe Microalgae Products Market Y-o-Y Growth Rate by Country, 2021-2031
Figure 21: Europe Microalgae Products Market Value (US$ Mn) Analysis & Forecast by Country, 2021–2031
Figure 22: Europe Microalgae Products Market Volume (Tons) Analysis & Forecast by Country, 2021–2031
Figure 23: Europe Microalgae Products Market Attractiveness Analysis by Country, 2021-2031
Figure 24: Europe Microalgae Products Market Attractiveness Analysis By Product Type, 2021-2031
Figure 25: Europe Microalgae Products Market Attractiveness Analysis By Form, 2021-2031
Figure 26: Europe Microalgae Products Market Attractiveness Analysis By End-use, 2021-2031
Figure 27: Europe Microalgae Products Market Attractiveness Analysis By Distribution Channel, 2021-2031
Figure 28: U.K. Microalgae Products Market Value (US$ Mn) Analysis & Forecast By Product Type, 2021-2031
Figure 29: U.K. Microalgae Products Market Volume (Tons) Analysis & Forecast By Product Type, 2021-2031
Figure 30: U.K. Microalgae Products Market Value (US$ Mn) Analysis & Forecast By Form, 2021-2031
Figure 31: U.K. Microalgae Products Market Volume (Tons) Analysis & Forecast By Form, 2021-2031
Figure 32: U.K. Microalgae Products Market Value (US$ Mn) Analysis & Forecast by End-use, 2021-2031
Figure 33: U.K. Microalgae Products Market Volume (Tons) Analysis & Forecast by End-use, 2021-2031
Figure 34: U.K. Microalgae Products Market Value (US$ Mn) Analysis & Forecast by Distribution Channel, 2021-2031
Figure 35: U.K. Microalgae Products Market Volume (Tons) Analysis & Forecast by Distribution Channel, 2021-2031
Figure 36: U.K. Microalgae Products Market Attractiveness Analysis by Product Type, 2021-2031
Figure 37: U.K. Microalgae Products Market Attractiveness Analysis By Form, 2021-2031
Figure 38: U.K. Microalgae Products Market Attractiveness Analysis By End-use, 2021-2031
Figure 39: U.K. Microalgae Products Market Attractiveness Analysis by Distribution Channel, 2021-2031
Figure 40: Spain Microalgae Products Market Value (US$ Mn) Analysis & Forecast By Product Type, 2021-2031
Figure 41: Spain Microalgae Products Market Volume (Tons) Analysis & Forecast By Product Type, 2021-2031
Figure 42: Spain Microalgae Products Market Value (US$ Mn) Analysis & Forecast By Form, 2021-2031
Figure 43: Spain Microalgae Products Market Volume (Tons) Analysis & Forecast By Form, 2021-2031
Figure 44: Spain Microalgae Products Market Value (US$ Mn) Analysis & Forecast by End-use, 2021-2031
Figure 45: Spain Microalgae Products Market Volume (Tons) Analysis & Forecast by End-use, 2021-2031
Figure 46: Spain Microalgae Products Market Value (US$ Mn) Analysis & Forecast by Distribution Channel, 2021-2031
Figure 47: Spain Microalgae Products Market Volume (Tons) Analysis & Forecast by Distribution Channel, 2021-2031
Figure 48: Spain Microalgae Products Market Attractiveness Analysis by Product Type, 2021-2031
Figure 49: Spain Microalgae Products Market Attractiveness Analysis By Form, 2021-2031
Figure 50: Spain Microalgae Products Market Attractiveness Analysis By End-use, 2021-2031
Figure 51: Spain Microalgae Products Market Attractiveness Analysis by Distribution Channel, 2021-2031
Figure 52: France Microalgae Products Market Value (US$ Mn) Analysis & Forecast By Product Type, 2021-2031
Figure 53: France Microalgae Products Market Volume (Tons) Analysis & Forecast By Product Type, 2021-2031
Figure 54: France Microalgae Products Market Value (US$ Mn) Analysis & Forecast By Form, 2021-2031
Figure 55: France Microalgae Products Market Volume (Tons) Analysis & Forecast By Form, 2021-2031
Figure 56: France Microalgae Products Market Value (US$ Mn) Analysis & Forecast by End-use, 2021-2031
Figure 57: France Microalgae Products Market Volume (Tons) Analysis & Forecast by End-use, 2021-2031
Figure 58: France Microalgae Products Market Value (US$ Mn) Analysis & Forecast by Distribution Channel, 2021-2031
Figure 59: France Microalgae Products Market Volume (Tons) Analysis & Forecast by Distribution Channel, 2021-2031
Figure 60: France Microalgae Products Market Attractiveness Analysis by Product Type, 2021-2031
Figure 61: France Microalgae Products Market Attractiveness Analysis By Form, 2021-2031
Figure 62: France Microalgae Products Market Attractiveness Analysis By End-use, 2021-2031
Figure 63: France Microalgae Products Market Attractiveness Analysis by Distribution Channel, 2021-2031
Figure 64: Italy Microalgae Products Market Value (US$ Mn) Analysis & Forecast By Product Type, 2021-2031
Figure 65: Italy Microalgae Products Market Volume (Tons) Analysis & Forecast By Product Type, 2021-2031
Figure 66: Italy Microalgae Products Market Value (US$ Mn) Analysis & Forecast By Form, 2021-2031
Figure 67: Italy Microalgae Products Market Volume (Tons) Analysis & Forecast By Form, 2021-2031
Figure 68: Italy Microalgae Products Market Value (US$ Mn) Analysis & Forecast by End-use, 2021-2031
Figure 69: Italy Microalgae Products Market Volume (Tons) Analysis & Forecast by End-use, 2021-2031
Figure 70: Italy Microalgae Products Market Value (US$ Mn) Analysis & Forecast by Distribution Channel, 2021-2031
Figure 71: Italy Microalgae Products Market Volume (Tons) Analysis & Forecast by Distribution Channel, 2021-2031
Figure 72: Italy Microalgae Products Market Attractiveness Analysis by Product Type, 2021-2031
Figure 73: Italy Microalgae Products Market Attractiveness Analysis By Form, 2021-2031
Figure 74: Italy Microalgae Products Market Attractiveness Analysis By End-use, 2021-2031
Figure 75: Italy Microalgae Products Market Attractiveness Analysis by Distribution Channel, 2021-2031
Figure 76: Germany Microalgae Products Market Value (US$ Mn) Analysis & Forecast By Product Type, 2021-2031
Figure 77: Germany Microalgae Products Market Volume (Tons) Analysis & Forecast By Product Type, 2021-2031
Figure 78: Germany Microalgae Products Market Value (US$ Mn) Analysis & Forecast By Form, 2021-2031
Figure 79: Germany Microalgae Products Market Volume (Tons) Analysis & Forecast By Form, 2021-2031
Figure 80: Germany Microalgae Products Market Value (US$ Mn) Analysis & Forecast by End-use, 2021-2031
Figure 81: Germany Microalgae Products Market Volume (Tons) Analysis & Forecast by End-use, 2021-2031
Figure 82: Germany Microalgae Products Market Value (US$ Mn) Analysis & Forecast by Distribution Channel, 2021-2031
Figure 83: Germany Microalgae Products Market Volume (Tons) Analysis & Forecast by Distribution Channel, 2021-2031
Figure 84: Germany Microalgae Products Market Attractiveness Analysis by Product Type, 2021-2031
Figure 85: Germany Microalgae Products Market Attractiveness Analysis By Form, 2021-2031
Figure 86: Germany Microalgae Products Market Attractiveness Analysis By End-use, 2021-2031
Figure 87: Germany Microalgae Products Market Attractiveness Analysis by Distribution Channel, 2021-2031
Figure 88: BENELUX Microalgae Products Market Value (US$ Mn) Analysis & Forecast By Product Type, 2021-2031
Figure 89: BENELUX Microalgae Products Market Volume (Tons) Analysis & Forecast By Product Type, 2021-2031
Figure 90: BENELUX Microalgae Products Market Value (US$ Mn) Analysis & Forecast By Form, 2021-2031
Figure 91: BENELUX Microalgae Products Market Volume (Tons) Analysis & Forecast By Form, 2021-2031
Figure 92: BENELUX Microalgae Products Market Value (US$ Mn) Analysis & Forecast by End-use, 2021-2031
Figure 93: BENELUX Microalgae Products Market Volume (Tons) Analysis & Forecast by End-use, 2021-2031
Figure 94: BENELUX Microalgae Products Market Value (US$ Mn) Analysis & Forecast by Distribution Channel, 2021-2031
Figure 95: BENELUX Microalgae Products Market Volume (Tons) Analysis & Forecast by Distribution Channel, 2021-2031
Figure 96: BENELUX Microalgae Products Market Attractiveness Analysis by Product Type, 2021-2031
Figure 97: BENELUX Microalgae Products Market Attractiveness Analysis By Form, 2021-2031
Figure 98: BENELUX Microalgae Products Market Attractiveness Analysis By End-use, 2021-2031
Figure 99: BENELUX Microalgae Products Market Attractiveness Analysis by Distribution Channel, 2021-2031
Figure 100: Nordic Microalgae Products Market Value (US$ Mn) Analysis & Forecast By Product Type, 2021-2031
Figure 101: Nordic Microalgae Products Market Volume (Tons) Analysis & Forecast By Product Type, 2021-2031
Figure 102: Nordic Microalgae Products Market Value (US$ Mn) Analysis & Forecast By Form, 2021-2031
Figure 103: Nordic Microalgae Products Market Volume (Tons) Analysis & Forecast By Form, 2021-2031
Figure 104: Nordic Microalgae Products Market Value (US$ Mn) Analysis & Forecast by End-use, 2021-2031
Figure 105: Nordic Microalgae Products Market Volume (Tons) Analysis & Forecast by End-use, 2021-2031
Figure 106: Nordic Microalgae Products Market Value (US$ Mn) Analysis & Forecast by Distribution Channel, 2021-2031
Figure 107: Nordic Microalgae Products Market Volume (Tons) Analysis & Forecast by Distribution Channel, 2021-2031
Figure 108: Nordic Microalgae Products Market Attractiveness Analysis by Product Type, 2021-2031
Figure 109: Nordic Microalgae Products Market Attractiveness Analysis By Form, 2021-2031
Figure 110: Nordic Microalgae Products Market Attractiveness Analysis By End-use, 2021-2031
Figure 111: Nordic Microalgae Products Market Attractiveness Analysis by Distribution Channel, 2021-2031
Figure 112: Russia Microalgae Products Market Value (US$ Mn) Analysis & Forecast By Product Type, 2021-2031
Figure 113: Russia Microalgae Products Market Volume (Tons) Analysis & Forecast By Product Type, 2021-2031
Figure 114: Russia Microalgae Products Market Value (US$ Mn) Analysis & Forecast By Form, 2021-2031
Figure 115: Russia Microalgae Products Market Volume (Tons) Analysis & Forecast By Form, 2021-2031
Figure 116: Russia Microalgae Products Market Value (US$ Mn) Analysis & Forecast by End-use, 2021-2031
Figure 117: Russia Microalgae Products Market Volume (Tons) Analysis & Forecast by End-use, 2021-2031
Figure 118: Russia Microalgae Products Market Value (US$ Mn) Analysis & Forecast by Distribution Channel, 2021-2031
Figure 119: Russia Microalgae Products Market Volume (Tons) Analysis & Forecast by Distribution Channel, 2021-2031
Figure 120: Russia Microalgae Products Market Attractiveness Analysis by Product Type, 2021-2031
Figure 121: Russia Microalgae Products Market Attractiveness Analysis By Form, 2021-2031
Figure 122: Russia Microalgae Products Market Attractiveness Analysis By End-use, 2021-2031
Figure 123: Russia Microalgae Products Market Attractiveness Analysis by Distribution Channel, 2021-2031
Figure 124: Poland Microalgae Products Market Value (US$ Mn) Analysis & Forecast By Product Type, 2021-2031
Figure 125: Poland Microalgae Products Market Volume (Tons) Analysis & Forecast By Product Type, 2021-2031
Figure 126: Poland Microalgae Products Market Value (US$ Mn) Analysis & Forecast By Form, 2021-2031
Figure 127: Poland Microalgae Products Market Volume (Tons) Analysis & Forecast By Form, 2021-2031
Figure 128: Poland Microalgae Products Market Value (US$ Mn) Analysis & Forecast by End-use, 2021-2031
Figure 129: Poland Microalgae Products Market Volume (Tons) Analysis & Forecast by End-use, 2021-2031
Figure 130: Poland Microalgae Products Market Value (US$ Mn) Analysis & Forecast by Distribution Channel, 2021-2031
Figure 131: Poland Microalgae Products Market Volume (Tons) Analysis & Forecast by Distribution Channel, 2021-2031
Figure 132: Poland Microalgae Products Market Attractiveness Analysis by Product Type, 2021-2031
Figure 133: Poland Microalgae Products Market Attractiveness Analysis By Form, 2021-2031
Figure 134: Poland Microalgae Products Market Attractiveness Analysis By End-use, 2021-2031
Figure 135: Poland Microalgae Products Market Attractiveness Analysis by Distribution Channel, 2021-2031
Figure 136: Rest of Europe Microalgae Products Market Value (US$ Mn) Analysis & Forecast By Product Type, 2021-2031
Figure 137: Rest of Europe Microalgae Products Market Volume (Tons) Analysis & Forecast By Product Type, 2021-2031
Figure 138: Rest of Europe Microalgae Products Market Value (US$ Mn) Analysis & Forecast By Form, 2021-2031
Figure 139: Rest of Europe Microalgae Products Market Volume (Tons) Analysis & Forecast By Form, 2021-2031
Figure 140: Rest of Europe Microalgae Products Market Value (US$ Mn) Analysis & Forecast by End-use, 2021-2031
Figure 141: Rest of Europe Microalgae Products Market Volume (Tons) Analysis & Forecast by End-use, 2021-2031
Figure 142: Rest of Europe Microalgae Products Market Value (US$ Mn) Analysis & Forecast by Distribution Channel, 2021-2031
Figure 143: Rest of Europe Microalgae Products Market Volume (Tons) Analysis & Forecast by Distribution Channel, 2021-2031
Figure 144: Rest of EU Microalgae Products Market Attractiveness Analysis by Product Type, 2021-2031
Figure 145: Rest of EU Microalgae Products Market Attractiveness Analysis By Form, 2021-2031
Figure 146: Rest of EU Microalgae Products Market Attractiveness Analysis By End-use, 2021-2031
Figure 147: Rest of EU Microalgae Products Market Attractiveness Analysis by Distribution Channel, 2021-2031
Copyright © Transparency Market Research, Inc. All Rights reserved
Trust Online

Europe Microalgae Products Market