
Reports
Reports
Analysts’ Viewpoint on ESD Protection Devices Market Scenario
ESD protection devices offer flexibility, reliability, outstanding low capacitance, better signal integrity, and antenna compatibility. Therefore, ESD protection devices are used in various end-use industries such as consumer electronics, automotive & transportation, IT & telecommunication, aerospace & defense, and healthcare. Rise in penetration of technologies such as industry 4.0, artificial intelligence, cloud computing, big data analytics, IoT, 5G, and cyber security is contributing to the growth of the global ESD protection devices market. Applications of ESD protection devices in communication equipment such as base stations, routers, switches, and g-pon (gigabit passive optical network) are expanding at a considerable pace. This is expected to propel the demand for ESD protection devices in the near future. Rise in demand for BMS (battery management system) and ADAS (advanced driver assistance system) is also likely to fuel the global market during the forecast period.
Usage of silicon-based transient voltage suppressor diodes has been increasing in several applications, ranging from USB 2.0, super-speed USB at 10 Gbps, HDMI 2.0, and BaseT, for the last five years. Silicon-based transient voltage suppressor diodes are also utilized in automotive A/V monitors displays and cameras owing to signal integrity and system protection. Moreover, extensive use of in-vehicle networks (IVN) associated with infotainment and vehicle communications is expected to create lucrative opportunities for silicon-based transient voltage suppressor diodes (TVS) as an ESD protection device.
Rise in penetration of ESD devices in consumer electronics such as laptops tablets, and computers is a key factor that is projected to boost the electrostatic discharge (ESD) protection devices market share during the forecast period. Increase in applications of ESD protection devices in LCD displays, audio lines, keypads, touchpads, tablets, and smartphones is also contributing to the market growth.
According to the Semiconductor Industry Association (SIA), in 2021, annual growth for computer devices was 21.2% with a total value of US$ 142.2 Billion. Furthermore, ESD tools, polymeric ESD suppressors, ESD bags & pouch packaging, and ESD cardboard are being adopted in the industrial sector to protect against ESD surges while walking on the floor. The global ESD protection devices market size is expected to increase during the forecast period, owing to the rise in applications of ceramic ESD protection devices and silicon ESD protection devices in various end-use industries.
ESD protection devices are widely used in consumer electronic products such as smartphones, laptops & notebooks, household appliances, digital cameras, communication equipment, electronic instruments, etc. ESD protection devices are used to clamp over voltages and dissipate high transient power surges. ESD protection diode and ESD Suppressor break down and create a low impedance path that limits the peak voltage and current by diverting the current flow to the ground, thereby protecting the IC.
The antenna of several electronic devices can act as a low-impedance path for ESD strikes to enter the system and damage downstream circuitry such as the filtering network, amplifier, or transceiver in wireless applications such as Global Positioning Systems (GPS), Wireless Local Area Network (WLAN), and Wireless-Fidelity (Wi-Fi). As higher-frequency communication devices such as smartphones, and laptops, are developed to transmit more information in less time, it becomes increasingly challenging to identify solutions that would not compromise stringent signal integrity requirements at higher data rates. ESD suppressors are used with low internal capacitance to avoid such instances, and curtail the distortion in the data communication signals.
In terms of directionality, the global ESD protection devices market has been bifurcated into uni-directional and bi-directional. Unidirectional ESD protection devices are best-suited for the protection of circuit nodes with unidirectional signals, which are always above or below the reference voltage. A large number of IC manufacturers are using innovative and highly advanced CMOS technologies to enhance performance of their systems. The uni-directional segment of the global ESD protection devices market is expected to hold major market share during the forecast period, as a majority of circuit designs are based on CMOS technology. Furthermore, chip designers are using unidirectional ESD protection devices, as the use of bi-directional devices may result in overload. For instance, In December 2021, Taiwan Semiconductor introduced an ultra-low capacitance ESD protection diode that includes two unidirectional ESD-rated clamping devices to protect high-speed data interfaces. This device would protect sensitive electronic components connected to data and -or transmission lines from over-stress caused by ESD (Electrostatic Discharge).
Silicon ESD protection devices with low capacitance are extensively used in various end-use industries such as consumer electronics, automotive & transportation, aerospace & defense, healthcare to protect electrical or electronic parts, assemblies, and equipment against ESD damage. These devices offer numerous features such as bi-directional and symmetric I/V characteristics for optimized design & assembly, very low reverse current, and small form factor.
These devices offer ESD protection to super high speed I/O - USB 3.0/3.1, firewire, DVI, HDMI, SATA (Serial Advanced Technology Attachment), DisplayPort, and Thunderbolt. Manufacturers of silicon-based ESD protection devices are focusing on the development of cost-effective products with a wide range of features. For instance, in February 2020, Nexperia launched silicon-based, OPEN Alliance-compliant ESD protection for 100BASE-T1 and 1000BASE-T1 automotive Ethernet systems. Increase in demand for silicon-based ESD protection for consumer electronic devices across the globe is anticipated to offer significant opportunities for ESD protection devices market players during the forecast period.
Asia Pacific is expected to hold major share of the global ESD protection devices market during the forecast period. This can be ascribed to the increased demand for ESD protection devices from tablets, desktop computers and their peripherals, test & measurement equipment, microphone, headset, automotive systems such as battery management systems, ADAS, telematics control unit, and among the others. For instance, in September 2021, the Government of India issued a notification regarding a PLI scheme for automobile and auto components worth Rs. 25,938 crores (US$ 3.49 billion). Rapid urbanization, digitization, increase in penetration of internet of things (IoT), rise in investment in 4G & 5G communication are some of the factors boosting the ESD protection devices market growth in Asia Pacific.
The ESD protection devices market in North America and Europe is expected to grow at a significant pace during the forecast period due to rise in adoption of online education, remote working, and e-commerce platforms. Demand for consumer electronics such as smartphones, laptops, notebooks, and smart wearables, etc., is high in these regions. This is augmenting the sale of ESD protection devices in North America and Europe. Moreover, growth of the market is anticipated to be driven by leading countries such as the Germany, Spain, Italy, France, Hungary, U.K., Russia, U.S, and Canada during the forecast period. The ESD protection devices market in Middle East & Africa and South America is projected to grow at a steady pace during the forecast period.
The global ESD protection devices market is fragmented, with a small number of large-scale vendors that control majority of the share. Expansion of product portfolios and mergers and acquisitions are major strategies adopted by leading manufacturers operating in the global market.
Key players operating in the global ESD protection devices market are Bourns, Inc. Diodes Incorporated, Infineon Technologies AG, Kyocera AVX, Littelfuse, Inc., Analog Devices (Maxim Integrated), Microchip Technology Inc., Murata Manufacturing Co., Ltd., Nexperia, Omron Corporation, Onesemi, ROHM SEMICONDUCTOR, Semtech Corporation, STMicroelectronics N.V., TDK Corporation, Texas Instruments Incorporated, and TOSHIBA ELECTRONIC DEVICES & STORAGE CORPORATION.
Key players have been profiled in the ESD protection devices market report based on parameters such as company overview, business strategies, product portfolio, business segments, and recent developments.
|
Attribute |
Detail |
|
Market Size Value in 2021 |
US$ 2.8 Bn |
|
Market Forecast Value in 2031 |
US$ 4.4 Bn |
|
Growth Rate (CAGR) |
4.7% |
|
Forecast Period |
2022–2031 |
|
Historical Data Available for |
2017–2020 |
|
Quantitative Units |
US$ Bn for Value & Million Units for Volume |
|
Market Analysis |
It includes cross segment analysis at global as well as regional level. Furthermore, qualitative analysis includes drivers, restraints, opportunities, key trends, Porter’s Five Forces analysis, value chain analysis, and key trend analysis. |
|
Competition Landscape |
|
|
Format |
Electronic (PDF) + Excel |
|
Market Segmentation |
|
|
Regions Covered |
|
|
Countries Covered |
|
|
Companies Profiled |
|
|
Customization Scope |
Available upon request |
|
Pricing |
Available upon request |
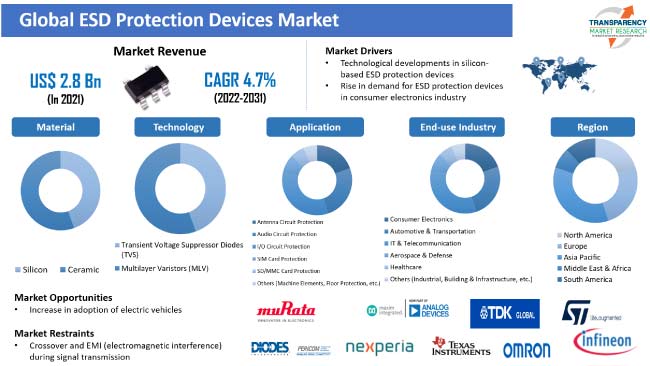
The global ESD protection devices market stood at US$ 2.8 Bn in 2021
The global ESD protection devices market is expected to grow at a CAGR of 4.7% from 2022 to 2031
The global ESD protection devices market is likely to reach US$ 4.4 Bn in 2031
Technological developments in silicon-based ESD protection devices and rise in demand from consumer electronics industry
Asia Pacific is more lucrative region of the global ESD protection devices market
Analog Devices (Maxim Integrated), Microchip Technology Inc., Murata Manufacturing Co., Ltd., Nexperia, Omron Corporation, Onsemi, Infineon Technologies AG, STMicroelectronics N.V., TDK Corporation, Texas Instruments Incorporated, and TOSHIBA ELECTRONIC DEVICES & STORAGE CORPORATION.
1. Preface
1.1. Market Introduction
1.2. Market and Segments Definition
1.3. Market Taxonomy
1.4. Research Methodology
1.5. Assumption and Acronyms
2. Executive Summary
2.1. Global ESD Protection Devices Market Overview
2.2. Regional Outline
2.3. Industry Outline
2.4. Market Dynamics Snapshot
2.5. Competition Blueprint
3. Market Dynamics
3.1. Macro-economic Factors
3.2. Drivers
3.3. Restraints
3.4. Opportunities
3.5. Key Trends
3.6. Regulatory Framework
4. Associated Industry and Key Indicator Assessment
4.1. Parent Industry Overview – Global Voltage Protection Devices Overview
4.2. Supply Chain Analysis
4.3. Pricing Analysis
4.4. Technology Roadmap Analysis
4.5. Industry SWOT Analysis
4.6. Porter’s Five Forces Analysis
4.7. COVID-19 Impact and Recovery Analysis
5. Global ESD Protection Devices Market Analysis, by Material
5.1. ESD Protection Devices Market Size (US$ Mn) and Volume (Million Units) Analysis & Forecast, by Material, 2017–2031
5.1.1. Silicon
5.1.2. Ceramic
5.2. Market Attractiveness Analysis, by Material
6. Global ESD Protection Devices Market Analysis, by Technology
6.1. ESD Protection Devices Market Size (US$ Mn) and Volume (Million Units) Analysis & Forecast, by Technology, 2017–2031
6.1.1. Transient Voltage Suppressor Diodes (TVS)
6.1.2. Multilayer Varistors (MLV)
6.2. Market Attractiveness Analysis, by Technology
7. Global ESD Protection Devices Market Analysis, by Directionality
7.1. ESD Protection Devices Market Size (US$ Mn Analysis & Forecast, by Directionality, 2017–2031
7.1.1. Uni-directional
7.1.2. Bi-directional
7.2. Market Attractiveness Analysis, by Directionality
8. Global ESD Protection Devices Market Analysis, by Protection
8.1. ESD Protection Devices Market Size (US$ Mn Analysis & Forecast, by Protection, 2017–2031
8.1.1. Data-line
8.1.2. Power-line
8.2. Market Attractiveness Analysis, by Protection
9. Global ESD Protection Devices Market Analysis, by Application
9.1. ESD Protection Devices Market Size (US$ Mn) Analysis & Forecast, by Application, 2017–2031
9.1.1. Antenna Circuit Protection
9.1.2. Audio Circuit Protection
9.1.3. I/O Circuit Protection
9.1.4. SIM Card Protection
9.1.5. SD/MMC Card Protection
9.1.6. Others
9.2. Market Attractiveness Analysis, by Application
10. Global ESD Protection Devices Market Analysis, by End-use
10.1. ESD Protection Devices Market Size (US$ Mn) Analysis & Forecast, by End-use, 2017–2031
10.1.1. Electronic Devices
10.1.1.1. Smartphones & Tablets
10.1.1.2. Laptops & Notebooks
10.1.1.3. Smart Wearables
10.1.1.4. Digital Cameras
10.1.2. Medical Devices
10.1.3. Communications Equipment
10.1.4. Data Centers & High-performance Computing Devices
10.1.5. Electric Vehicles
10.1.6. Others
10.2. Market Attractiveness Analysis, by End-use
11. Global ESD Protection Devices Market Analysis, by End-use Industry
11.1. ESD Protection Devices Market Size (US$ Mn) Analysis & Forecast, by End-use Industry, 2017–2031
11.1.1. Consumer Electronics
11.1.2. Automotive & Transportation
11.1.3. IT & Telecommunication
11.1.4. Aerospace & Defense
11.1.5. Healthcare
11.1.6. Others
11.2. Market Attractiveness Analysis, by End-use Industry
12. Global ESD Protection Devices Market Analysis and Forecast, by Region
12.1. ESD Protection Devices Market Size (US$ Mn) and Volume (Million Units) Analysis & Forecast, by Region, 2017–2031
12.1.1. North America
12.1.2. Europe
12.1.3. Asia Pacific
12.1.4. Middle East & Africa
12.1.5. South America
12.2. Market Attractiveness Analysis, by Region
13. North America ESD Protection Devices Market Analysis and Forecast
13.1. Market Snapshot
13.2. Drivers and Restraints: Impact Analysis
13.3. ESD Protection Devices Market Size (US$ Mn) and Volume (Million Units) Analysis & Forecast, by Material, 2017–2031
13.3.1. Silicon
13.3.2. Ceramic
13.4. ESD Protection Devices Market Size (US$ Mn) and Volume (Million Units) Analysis & Forecast, by Technology, 2017–2031
13.4.1. Transient Voltage Suppressor Diodes (TVS)
13.4.2. Multilayer Varistors (MLV)
13.5. ESD Protection Devices Market Size (US$ Mn) Analysis & Forecast, by Directionality, 2017–2031
13.5.1. Uni-directional
13.5.2. Bi-directional
13.6. ESD Protection Devices Market Size (US$ Mn) Analysis & Forecast, by Protection, 2017–2031
13.6.1. Data-line
13.6.2. Power-line
13.7. ESD Protection Devices Market Size (US$ Mn) Analysis & Forecast, by Application, 2017–2031
13.7.1. Antenna Circuit Protection
13.7.2. Audio Circuit Protection
13.7.3. I/O Circuit Protection
13.7.4. SIM Card Protection
13.7.5. SD/MMC Card Protection
13.7.6. Others
13.8. ESD Protection Devices Market Size (US$ Mn) Analysis & Forecast, by End-use, 2017–2031
13.8.1. Electronic Devices
13.8.1.1. Smartphones & Tablets
13.8.1.2. Laptops & Notebooks
13.8.1.3. Smart Wearables
13.8.1.4. Digital Cameras
13.8.2. Medical Devices
13.8.3. Communications Equipment
13.8.4. Data Centers & High-performance Computing Devices
13.8.5. Electric Vehicles
13.8.6. Others
13.9. ESD Protection Devices Market Size (US$ Mn) Analysis & Forecast, by End-use Industry, 2017–2031
13.9.1. Consumer Electronics
13.9.2. Automotive & Transportation
13.9.3. IT & Telecommunication
13.9.4. Aerospace & Defense
13.9.5. Healthcare
13.9.6. Others
13.10. ESD Protection Devices Market Size (US$ Mn) and Volume (Million Units) Analysis & Forecast, by Country and Sub-region, 2017–2031
13.10.1. The U.S.
13.10.2. Canada
13.10.3. Rest of North America
13.11. Market Attractiveness Analysis
13.11.1. By Material
13.11.2. By Technology
13.11.3. By Directionality
13.11.4. By Protection
13.11.5. By Application
13.11.6. By End-use
13.11.7. By End-use Industry
13.11.8. By Country/Sub-region
14. Europe ESD Protection Devices Market Analysis and Forecast
14.1. Market Snapshot
14.2. Drivers and Restraints: Impact Analysis
14.3. ESD Protection Devices Market Size (US$ Mn) and Volume (Million Units) Analysis & Forecast, by Material, 2017–2031
14.3.1. Silicon
14.3.2. Ceramic
14.4. ESD Protection Devices Market Size (US$ Mn) and Volume (Million Units) Analysis & Forecast, by Technology, 2017–2031
14.4.1. Transient Voltage Suppressor Diodes (TVS)
14.4.2. Multilayer Varistors (MLV)
14.5. ESD Protection Devices Market Size (US$ Mn) Analysis & Forecast, by Directionality, 2017–2031
14.5.1. Uni-directional
14.5.2. Bi-directional
14.6. ESD Protection Devices Market Size (US$ Mn) Analysis & Forecast, by Protection, 2017–2031
14.6.1. Data-line
14.6.2. Power-line
14.7. ESD Protection Devices Market Size (US$ Mn) Analysis & Forecast, by Application, 2017–2031
14.7.1. Antenna Circuit Protection
14.7.2. Audio Circuit Protection
14.7.3. I/O Circuit Protection
14.7.4. SIM Card Protection
14.7.5. SD/MMC Card Protection
14.7.6. Others
14.8. ESD Protection Devices Market Size (US$ Mn) Analysis & Forecast, by End-use, 2017–2031
14.8.1. Electronic Devices
14.8.1.1. Smartphones & Tablets
14.8.1.2. Laptops & Notebooks
14.8.1.3. Smart Wearables
14.8.1.4. Digital Cameras
14.8.2. Medical Devices
14.8.3. Communications Equipment
14.8.4. Data Centers & High-performance Computing Devices
14.8.5. Electric Vehicles
14.8.6. Others
14.9. ESD Protection Devices Market Size (US$ Mn) Analysis & Forecast, by End-use Industry, 2017–2031
14.9.1. Consumer Electronics
14.9.2. Automotive & Transportation
14.9.3. IT & Telecommunication
14.9.4. Aerospace & Defense
14.9.5. Healthcare
14.9.6. Others
14.10. ESD Protection Devices Market Size (US$ Mn) and Volume (Million Units) Analysis & Forecast, by Country and Sub-region, 2017–2031
14.10.1. The U.K.
14.10.2. Germany
14.10.3. France
14.10.4. Rest of Europe
14.11. Market Attractiveness Analysis
14.11.1. By Material
14.11.2. By Technology
14.11.3. By Directionality
14.11.4. By Protection
14.11.5. By Application
14.11.6. By End-use
14.11.7. By End-use Industry
14.11.8. By Country/Sub-region
15. Asia Pacific ESD Protection Devices Market Analysis and Forecast
15.1. Market Snapshot
15.2. Drivers and Restraints: Impact Analysis
15.3. ESD Protection Devices Market Size (US$ Mn) and Volume (Million Units) Analysis & Forecast, by Material, 2017–2031
15.3.1. Silicon
15.3.2. Ceramic
15.4. ESD Protection Devices Market Size (US$ Mn) and Volume (Million Units) Analysis & Forecast, by Technology, 2017–2031
15.4.1. Transient Voltage Suppressor Diodes (TVS)
15.4.2. Multilayer Varistors (MLV)
15.5. ESD Protection Devices Market Size (US$ Mn) Analysis & Forecast, by Directionality, 2017–2031
15.5.1. Uni-directional
15.5.2. Bi-directional
15.6. ESD Protection Devices Market Size (US$ Mn) Analysis & Forecast, by Protection, 2017–2031
15.6.1. Data-line
15.6.2. Power-line
15.7. ESD Protection Devices Market Size (US$ Mn) Analysis & Forecast, by Application, 2017–2031
15.7.1. Antenna Circuit Protection
15.7.2. Audio Circuit Protection
15.7.3. I/O Circuit Protection
15.7.4. SIM Card Protection
15.7.5. SD/MMC Card Protection
15.7.6. Others
15.8. ESD Protection Devices Market Size (US$ Mn) Analysis & Forecast, by End-use, 2017–2031
15.8.1. Electronic Devices
15.8.1.1. Smartphones & Tablets
15.8.1.2. Laptops & Notebooks
15.8.1.3. Smart Wearables
15.8.1.4. Digital Cameras
15.8.2. Medical Devices
15.8.3. Communications Equipment
15.8.4. Data Centers & High-performance Computing Devices
15.8.5. Electric Vehicles
15.8.6. Others
15.9. ESD Protection Devices Market Size (US$ Mn) Analysis & Forecast, by End-use Industry, 2017–2031
15.9.1. Consumer Electronics
15.9.2. Automotive & Transportation
15.9.3. IT & Telecommunication
15.9.4. Aerospace & Defense
15.9.5. Healthcare
15.9.6. Others
15.10. ESD Protection Devices Market Size (US$ Mn) and Volume (Million Units) Analysis & Forecast, by Country and Sub-region, 2017–2031
15.10.1. China
15.10.2. Japan
15.10.3. India
15.10.4. South Korea
15.10.5. ASEAN
15.10.6. Rest of Asia Pacific
15.11. Market Attractiveness Analysis
15.11.1. By Material
15.11.2. By Technology
15.11.3. By Directionality
15.11.4. By Protection
15.11.5. By Application
15.11.6. By End-use
15.11.7. By End-use Industry
15.11.8. By Country/Sub-region
16. Middle East & Africa ESD Protection Devices Market Analysis and Forecast
16.1. Market Snapshot
16.2. Drivers and Restraints: Impact Analysis
16.3. ESD Protection Devices Market Size (US$ Mn) and Volume (Million Units) Analysis & Forecast, by Material, 2017–2031
16.3.1. Silicon
16.3.2. Ceramic
16.4. ESD Protection Devices Market Size (US$ Mn) and Volume (Million Units) Analysis & Forecast, by Technology, 2017–2031
16.4.1. Transient Voltage Suppressor Diodes (TVS)
16.4.2. Multilayer Varistors (MLV)
16.5. ESD Protection Devices Market Size (US$ Mn) Analysis & Forecast, by Directionality, 2017–2031
16.5.1. Uni-directional
16.5.2. Bi-directional
16.6. ESD Protection Devices Market Size (US$ Mn) Analysis & Forecast, by Protection, 2017–2031
16.6.1. Data-line
16.6.2. Power-line
16.7. ESD Protection Devices Market Size (US$ Mn) Analysis & Forecast, by Application, 2017–2031
16.7.1. Antenna Circuit Protection
16.7.2. Audio Circuit Protection
16.7.3. I/O Circuit Protection
16.7.4. SIM Card Protection
16.7.5. SD/MMC Card Protection
16.7.6. Others
16.8. ESD Protection Devices Market Size (US$ Mn) Analysis & Forecast, by End-use, 2017–2031
16.8.1. Electronic Devices
16.8.1.1. Smartphones & Tablets
16.8.1.2. Laptops & Notebooks
16.8.1.3. Smart Wearables
16.8.1.4. Digital Cameras
16.8.2. Medical Devices
16.8.3. Communications Equipment
16.8.4. Data Centers & High-performance Computing Devices
16.8.5. Electric Vehicles
16.8.6. Others
16.9. ESD Protection Devices Market Size (US$ Mn) Analysis & Forecast, by End-use Industry, 2017–2031
16.9.1. Consumer Electronics
16.9.2. Automotive & Transportation
16.9.3. IT & Telecommunication
16.9.4. Aerospace & Defense
16.9.5. Healthcare
16.9.6. Others
16.10. ESD Protection Devices Market Size (US$ Mn) and Volume (Million Units) Analysis & Forecast, by Country and Sub-region, 2017–2031
16.10.1. GCC
16.10.2. South Africa
16.10.3. Rest of Middle East & Africa
16.11. Market Attractiveness Analysis
16.11.1. By Material
16.11.2. By Technology
16.11.3. By Directionality
16.11.4. By Protection
16.11.5. By Application
16.11.6. By End-use
16.11.7. By End-use Industry
16.11.8. By Country/Sub-region
17. South America ESD Protection Devices Market Analysis and Forecast
17.1. Market Snapshot
17.2. Drivers and Restraints: Impact Analysis
17.3. ESD Protection Devices Market Size (US$ Mn) and Volume (Million Units) Analysis & Forecast, by Material, 2017–2031
17.3.1. Silicon
17.3.2. Ceramic
17.4. ESD Protection Devices Market Size (US$ Mn) and Volume (Million Units) Analysis & Forecast, by Technology, 2017–2031
17.4.1. Transient Voltage Suppressor Diodes (TVS)
17.4.2. Multilayer Varistors (MLV)
17.5. ESD Protection Devices Market Size (US$ Mn) Analysis & Forecast, by Directionality, 2017–2031
17.5.1. Uni-directional
17.5.2. Bi-directional
17.6. ESD Protection Devices Market Size (US$ Mn) Analysis & Forecast, by Protection, 2017–2031
17.6.1. Data-line
17.6.2. Power-line
17.7. ESD Protection Devices Market Size (US$ Mn) Analysis & Forecast, by Application, 2017–2031
17.7.1. Antenna Circuit Protection
17.7.2. Audio Circuit Protection
17.7.3. I/O Circuit Protection
17.7.4. SIM Card Protection
17.7.5. SD/MMC Card Protection
17.7.6. Others
17.8. ESD Protection Devices Market Size (US$ Mn) Analysis & Forecast, by End-use, 2017–2031
17.8.1. Electronic Devices
17.8.1.1. Smartphones & Tablets
17.8.1.2. Laptops & Notebooks
17.8.1.3. Smart Wearables
17.8.1.4. Digital Cameras
17.8.2. Medical Devices
17.8.3. Communications Equipment
17.8.4. Data Centers & High-performance Computing Devices
17.8.5. Electric Vehicles
17.8.6. Others
17.9. ESD Protection Devices Market Size (US$ Mn) Analysis & Forecast, by End-use Industry, 2017–2031
17.9.1. Consumer Electronics
17.9.2. Automotive & Transportation
17.9.3. IT & Telecommunication
17.9.4. Aerospace & Defense
17.9.5. Healthcare
17.9.6. Others
17.10. ESD Protection Devices Market Size (US$ Mn) and Volume (Million Units) Analysis & Forecast, by Country and Sub-region, 2017–2031
17.10.1. Brazil
17.10.2. Rest of South America
17.11. Market Attractiveness Analysis
17.11.1. By Material
17.11.2. By Technology
17.11.3. By Directionality
17.11.4. By Protection
17.11.5. By Application
17.11.6. By End-use
17.11.7. By End-use Industry
17.11.8. By Country/Sub-region
18. Competition Assessment
18.1. Global ESD Protection Devices Market Competition Matrix - a Dashboard View
18.1.1. Global ESD Protection Devices Market Company Share Analysis, by Value (2021)
18.1.2. Technological Differentiator
19. Company Profiles (Global Manufacturers/Suppliers)
19.1. Bourns, Inc.
19.1.1. Overview
19.1.2. Product Portfolio
19.1.3. Sales Footprint
19.1.4. Key Subsidiaries or Distributors
19.1.5. Strategy and Recent Developments
19.1.6. Key Financials
19.2. Diodes Incorporated
19.2.1. Overview
19.2.2. Product Portfolio
19.2.3. Sales Footprint
19.2.4. Key Subsidiaries or Distributors
19.2.5. Strategy and Recent Developments
19.2.6. Key Financials
19.3. Infineon Technologies AG
19.3.1. Overview
19.3.2. Product Portfolio
19.3.3. Sales Footprint
19.3.4. Key Subsidiaries or Distributors
19.3.5. Strategy and Recent Developments
19.3.6. Key Financials
19.4. Kyocera AVX
19.4.1. Overview
19.4.2. Product Portfolio
19.4.3. Sales Footprint
19.4.4. Key Subsidiaries or Distributors
19.4.5. Strategy and Recent Developments
19.4.6. Key Financials
19.5. Littelfuse, Inc.
19.5.1. Overview
19.5.2. Product Portfolio
19.5.3. Sales Footprint
19.5.4. Key Subsidiaries or Distributors
19.5.5. Strategy and Recent Developments
19.5.6. Key Financials
19.6. Analog Devices (Maxim Integrated)
19.6.1. Overview
19.6.2. Product Portfolio
19.6.3. Sales Footprint
19.6.4. Key Subsidiaries or Distributors
19.6.5. Strategy and Recent Developments
19.6.6. Key Financials
19.7. Microchip Technology Inc.
19.7.1. Overview
19.7.2. Product Portfolio
19.7.3. Sales Footprint
19.7.4. Key Subsidiaries or Distributors
19.7.5. Strategy and Recent Developments
19.7.6. Key Financials
19.8. Murata Manufacturing Co., Ltd.
19.8.1. Overview
19.8.2. Product Portfolio
19.8.3. Sales Footprint
19.8.4. Key Subsidiaries or Distributors
19.8.5. Strategy and Recent Developments
19.8.6. Key Financials
19.9. Nexperia
19.9.1. Overview
19.9.2. Product Portfolio
19.9.3. Sales Footprint
19.9.4. Key Subsidiaries or Distributors
19.9.5. Strategy and Recent Developments
19.9.6. Key Financials
19.10. Omron Corporation
19.10.1. Overview
19.10.2. Product Portfolio
19.10.3. Sales Footprint
19.10.4. Key Subsidiaries or Distributors
19.10.5. Strategy and Recent Developments
19.10.6. Key Financials
19.11. Onsemi
19.11.1. Overview
19.11.2. Product Portfolio
19.11.3. Sales Footprint
19.11.4. Key Subsidiaries or Distributors
19.11.5. Strategy and Recent Developments
19.11.6. Key Financials
19.12. ROHM SEMICONDUCTOR
19.12.1. Overview
19.12.2. Product Portfolio
19.12.3. Sales Footprint
19.12.4. Key Subsidiaries or Distributors
19.12.5. Strategy and Recent Developments
19.12.6. Key Financials
19.13. Semtech Corporation
19.13.1. Overview
19.13.2. Product Portfolio
19.13.3. Sales Footprint
19.13.4. Key Subsidiaries or Distributors
19.13.5. Strategy and Recent Developments
19.13.6. Key Financials
19.14. STMicroelectronics N.V.
19.14.1. Overview
19.14.2. Product Portfolio
19.14.3. Sales Footprint
19.14.4. Key Subsidiaries or Distributors
19.14.5. Strategy and Recent Developments
19.14.6. Key Financials
19.15. TDK Corporation
19.15.1. Overview
19.15.2. Product Portfolio
19.15.3. Sales Footprint
19.15.4. Key Subsidiaries or Distributors
19.15.5. Strategy and Recent Developments
19.15.6. Key Financials
19.16. Texas Instruments Incorporated
19.16.1. Overview
19.16.2. Product Portfolio
19.16.3. Sales Footprint
19.16.4. Key Subsidiaries or Distributors
19.16.5. Strategy and Recent Developments
19.16.6. Key Financials
19.17. TOSHIBA ELECTRONIC DEVICES & STORAGE CORPORATION
19.17.1. Overview
19.17.2. Product Portfolio
19.17.3. Sales Footprint
19.17.4. Key Subsidiaries or Distributors
19.17.5. Strategy and Recent Developments
19.17.6. Key Financials
20. Recommendation
20.1. Opportunity Assessment
20.1.1. By Material
20.1.2. By Technology
20.1.3. By Directionality
20.1.4. By Protection
20.1.5. By Application
20.1.6. By End-use
20.1.7. By End-use Industry
20.1.8. By Country/Sub-region
List of Tables
Table 01: Global ESD Protection Devices Market Size & Forecast, by Material, Value (US$ Mn), 2017–2031
Table 02: Global ESD Protection Devices Market Size & Forecast, by Material, Volume (Million Units), 2017–2031
Table 03: Global ESD Protection Devices Market Size & Forecast, by Technology (US$ Mn), 2017–2031
Table 04: Global ESD Protection Devices Market Size & Forecast, by Technology, Volume (Million Units), 2017–2031
Table 05: Global ESD Protection Devices Market Size & Forecast, by Directionality (US$ Mn), 2017–2031
Table 06: Global ESD Protection Devices Market Size & Forecast, by Protection (US$ Mn), 2017–2031
Table 07: Global ESD Protection Devices Market Size & Forecast, by Application, Value (US$ Mn), 2017–2031
Table 08: Global ESD Protection Devices Market Size & Forecast, by End-use (US$ Mn), 2017–2031
Table 09: Global ESD Protection Devices Market Size & Forecast, by End-use Industry, Value (US$ Mn), 2017–2031
Table 10: Global ESD Protection Devices Market Size & Forecast, by Region, Value (US$ Mn), 2017–2031
Table 11: North America ESD Protection Devices Market Size & Forecast, by Material, Value (US$ Mn), 2017–2031
Table 12: North America ESD Protection Devices Market Size & Forecast, by Material, Volume (Million Units), 2017–2031
Table 13: North America ESD Protection Devices Market Size & Forecast, by Technology (US$ Mn), 2017–2031
Table 14: North America ESD Protection Devices Market Size & Forecast, by Technology, Volume (Million Units), 2017–2031
Table 15: North America ESD Protection Devices Market Size & Forecast, by Directionality (US$ Mn), 2017–2031
Table 16: North America ESD Protection Devices Market Size & Forecast, by Protection (US$ Mn), 2017–2031
Table 17: North America ESD Protection Devices Market Size & Forecast, by Application, Value (US$ Mn), 2017–2031
Table 18: North America ESD Protection Devices Market Size & Forecast, by End-use (US$ Mn), 2017–2031
Table 19: North America ESD Protection Devices Market Size & Forecast, by End-use Industry, Value (US$ Mn), 2017–2031
Table 20: North America ESD Protection Devices Market Size & Forecast, by Region, Value (US$ Mn), 2017–2031
Table 21: Europe ESD Protection Devices Market Size & Forecast, by Material, Value (US$ Mn), 2017–2031
Table 22: Europe ESD Protection Devices Market Size & Forecast, by Material, Volume (Million Units), 2017–2031
Table 23: Europe ESD Protection Devices Market Size & Forecast, by Technology (US$ Mn), 2017–2031
Table 24: Europe ESD Protection Devices Market Size & Forecast, by Technology, Volume (Million Units), 2017–2031
Table 25: Europe ESD Protection Devices Market Size & Forecast, by Directionality (US$ Mn), 2017–2031
Table 26: Europe ESD Protection Devices Market Size & Forecast, by Protection (US$ Mn), 2017–2031
Table 27: Europe ESD Protection Devices Market Size & Forecast, by Application, Value (US$ Mn), 2017–2031
Table 28: Europe ESD Protection Devices Market Size & Forecast, by End-use (US$ Mn), 2017–2031
Table 29: Europe ESD Protection Devices Market Size & Forecast, by End-use Industry, Value (US$ Mn), 2017–2031
Table 30: Europe ESD Protection Devices Market Size & Forecast, by Region, Value (US$ Mn), 2017–2031
Table 31: Asia Pacific ESD Protection Devices Market Size & Forecast, by Material, Value (US$ Mn), 2017–2031
Table 32: Asia Pacific ESD Protection Devices Market Size & Forecast, by Material, Volume (Million Units), 2017–2031
Table 33: Asia Pacific ESD Protection Devices Market Size & Forecast, by Technology (US$ Mn), 2017–2031
Table 34: Asia Pacific ESD Protection Devices Market Size & Forecast, by Technology, Volume (Million Units), 2017–2031
Table 35: Asia Pacific ESD Protection Devices Market Size & Forecast, by Directionality (US$ Mn), 2017–2031
Table 36: Asia Pacific ESD Protection Devices Market Size & Forecast, by Protection (US$ Mn), 2017–2031
Table 37: Asia Pacific ESD Protection Devices Market Size & Forecast, by Application, Value (US$ Mn), 2017–2031
Table 38: Asia Pacific ESD Protection Devices Market Size & Forecast, by End-use (US$ Mn), 2017–2031
Table 39: Asia Pacific ESD Protection Devices Market Size & Forecast, by End-use Industry, Value (US$ Mn), 2017–2031
Table 40: Asia Pacific ESD Protection Devices Market Size & Forecast, by Region, Value (US$ Mn), 2017–2031
Table 41: Middle East & Africa ESD Protection Devices Market Size & Forecast, by Material, Value (US$ Mn), 2017–2031
Table 42: Middle East & Africa ESD Protection Devices Market Size & Forecast, by Material, Volume (Million Units), 2017–2031
Table 43: Middle East & Africa ESD Protection Devices Market Size & Forecast, by Technology (US$ Mn), 2017–2031
Table 44: Middle East & Africa ESD Protection Devices Market Size & Forecast, by Technology, Volume (Million Units), 2017–2031
Table 45: Middle East & Africa ESD Protection Devices Market Size & Forecast, by Directionality (US$ Mn), 2017–2031
Table 46: Middle East & Africa ESD Protection Devices Market Size & Forecast, by Protection (US$ Mn), 2017–2031
Table 47: Middle East & Africa ESD Protection Devices Market Size & Forecast, by Application, Value (US$ Mn), 2017–2031
Table 48: Middle East & Africa ESD Protection Devices Market Size & Forecast, by End-use (US$ Mn), 2017–2031
Table 49: Middle East & Africa ESD Protection Devices Market Size & Forecast, by End-use Industry, Value (US$ Mn), 2017–2031
Table 50: Middle East & Africa ESD Protection Devices Market Size & Forecast, by Region, Value (US$ Mn), 2017–2031
Table 51: South America ESD Protection Devices Market Size & Forecast, by Material, Value (US$ Mn), 2017–2031
Table 52: South America ESD Protection Devices Market Size & Forecast, by Material, Volume (Million Units), 2017–2031
Table 53: South America ESD Protection Devices Market Size & Forecast, by Technology (US$ Mn), 2017–2031
Table 54: South America ESD Protection Devices Market Size & Forecast, by Technology, Volume (Million Units), 2017–2031
Table 55: South America ESD Protection Devices Market Size & Forecast, by Directionality (US$ Mn), 2017–2031
Table 56: South America ESD Protection Devices Market Size & Forecast, by Protection (US$ Mn), 2017–2031
Table 57: South America ESD Protection Devices Market Size & Forecast, by Application, Value (US$ Mn), 2017–2031
Table 58: South America ESD Protection Devices Market Size & Forecast, by End-use (US$ Mn), 2017–2031
Table 59: South America ESD Protection Devices Market Size & Forecast, by End-use Industry, Value (US$ Mn), 2017–2031
Table 60: South America ESD Protection Devices Market Size & Forecast, by Region, Value (US$ Mn), 2017–2031
List of Figures
Figure 01: Global ESD Protection Devices Price Trend Analysis (Average Price, US$) (Million Units)
Figure 02: Global ESD Protection Devices Market, Y-O-Y Growth 2017–2031
Figure 03: Global ESD Protection Devices Market, Value (US$ Mn), 2017–2031
Figure 04: Global ESD Protection Devices Market, Volume (Million Units), 2017–2031
Figure 05: Global ESD Protection Devices Market Projections, by Material, Value (US$ Mn), 2017–2031
Figure 06: Global ESD Protection Devices Market, Incremental Opportunity, by Material, Value (US$ Mn), 2022 – 2031
Figure 07: Global ESD Protection Devices Market Share, by Material, Value (US$ Mn), 2022 – 2031
Figure 08: Global ESD Protection Devices Market Projections, by Technology, Value (US$ Mn), 2017–2031
Figure 09: Global ESD Protection Devices Market, Incremental Opportunity, by Technology, Value (US$ Mn), 2022 – 2031
Figure 10: Global ESD Protection Devices Market Share, by Technology, Value (US$ Mn), 2022 – 2031
Figure 11: Global ESD Protection Devices Market Projections, by Directionality, Value (US$ Mn), 2017–2031
Figure 12: Global ESD Protection Devices Market, Incremental Opportunity, by Directionality, Value (US$ Mn), 2022 – 2031
Figure 13: Global ESD Protection Devices Market Share, by Directionality, Value (US$ Mn), 2022 – 2031
Figure 14: Global ESD Protection Devices Market Projections, by Protection, Value (US$ Mn), 2017–2031
Figure 15: Global ESD Protection Devices Market, Incremental Opportunity, by Protection, Value (US$ Mn), 2022 – 2031
Figure 16: Global ESD Protection Devices Market Share, by Protection, Value (US$ Mn), 2022 – 2031
Figure 17: Global ESD Protection Devices Market Size & Forecast, by Application, Revenue (US$ Mn), 2017–2031
Figure 18: Global ESD Protection Devices Market Attractiveness, by Application, Value (US$ Mn), 2022 – 2031
Figure 19: Global ESD Protection Devices Market Size & Forecast, by Application, Value (US$ Mn), 2022 – 2031
Figure 20: Global ESD Protection Devices Market Size & Forecast, by End-use, Revenue (US$ Mn), 2017–2031
Figure 21: Global ESD Protection Devices Market Attractiveness, by End-use, Value (US$ Mn), 2022 – 2031
Figure 22: Global ESD Protection Devices Market Share Analysis, by End-use, 2021 and 2031
Figure 23: Global ESD Protection Devices Market Size & Forecast, by End-use Industry, Revenue (US$ Mn), 2017–2031
Figure 24: Global ESD Protection Devices Market Attractiveness, by End-use Industry, Value (US$ Mn), 2022 – 2031
Figure 25: Global ESD Protection Devices Market Share Analysis, by End-use Industry, 2021 and 2031
Figure 26: Global ESD Protection Devices Market Size & Forecast, by Region, Revenue (US$ Mn), 2017–2031
Figure 27: Global ESD Protection Devices Market Attractiveness, by Region, Value (US$ Mn), 2022 – 2031
Figure 28: Global ESD Protection Devices Market Size & Forecast, by Region, Value (US$ Mn), 2022 – 2031
Figure 29: North America ESD Protection Devices Market, Y-O-Y Growth 2017–2031
Figure 30: North America ESD Protection Devices Market, Value (US$ Mn), 2017–2031
Figure 31: North America ESD Protection Devices Market, Volume (Million Units), 2017–2031
Figure 32: North America ESD Protection Devices Market Projections, by Material, Value (US$ Mn), 2017–2031
Figure 33: North America ESD Protection Devices Market, Incremental Opportunity, by Material, Value (US$ Mn), 2022 – 2031
Figure 34: North America ESD Protection Devices Market Share, by Material, Value (US$ Mn), 2022 – 2031
Figure 35: North America ESD Protection Devices Market Projections, by Technology, Value (US$ Mn), 2017–2031
Figure 36: North America ESD Protection Devices Market, Incremental Opportunity, by Technology, Value (US$ Mn), 2022 – 2031
Figure 37: North America ESD Protection Devices Market Share, by Technology, Value (US$ Mn), 2022 – 2031
Figure 38: North America ESD Protection Devices Market Projections, by Directionality, Value (US$ Mn), 2017–2031
Figure 39: North America ESD Protection Devices Market, Incremental Opportunity, by Directionality, Value (US$ Mn), 2022 – 2031
Figure 40: North America ESD Protection Devices Market Share, by Directionality, Value (US$ Mn), 2022 – 2031
Figure 41: North America ESD Protection Devices Market Projections, by Protection, Value (US$ Mn), 2017–2031
Figure 42: North America ESD Protection Devices Market, Incremental Opportunity, by Protection, Value (US$ Mn), 2022 – 2031
Figure 43: North America ESD Protection Devices Market Share, by Protection, Value (US$ Mn), 2022 – 2031
Figure 44: North America ESD Protection Devices Market Size & Forecast, by Application, Revenue (US$ Mn), 2017–2031
Figure 45: North America ESD Protection Devices Market Attractiveness, by Application, Value (US$ Mn), 2022 – 2031
Figure 46: North America ESD Protection Devices Market Size & Forecast, by Application, Value (US$ Mn), 2022 – 2031
Figure 47: North America ESD Protection Devices Market Size & Forecast, by End-use, Revenue (US$ Mn), 2017–2031
Figure 48: North America ESD Protection Devices Market Attractiveness, by End-use, Value (US$ Mn), 2022 – 2031
Figure 49: North America ESD Protection Devices Market Share Analysis, by End-use, 2021 and 2031
Figure 50: North America ESD Protection Devices Market Size & Forecast, by End-use Industry, Revenue (US$ Mn), 2017–2031
Figure 51: North America ESD Protection Devices Market Attractiveness, by End-use Industry, Value (US$ Mn), 2022 – 2031
Figure 52: North America ESD Protection Devices Market Share Analysis, by End-use Industry, 2021 and 2031
Figure 53: North America ESD Protection Devices Market Size & Forecast, by Region, Revenue (US$ Mn), 2017–2031
Figure 54: North America ESD Protection Devices Market Attractiveness, by Region, Value (US$ Mn), 2022 – 2031
Figure 55: Europe ESD Protection Devices Market, Y-O-Y Growth 2017–2031
Figure 56: Europe ESD Protection Devices Market, Value (US$ Mn), 2017–2031
Figure 57: Europe ESD Protection Devices Market, Volume (Million Units), 2017–2031
Figure 58: Europe ESD Protection Devices Market Projections, by Material, Value (US$ Mn), 2017–2031
Figure 59: Europe ESD Protection Devices Market, Incremental Opportunity, by Material, Value (US$ Mn), 2022 – 2031
Figure 60: Europe ESD Protection Devices Market Share, by Material, Value (US$ Mn), 2022 – 2031
Figure 61: Europe ESD Protection Devices Market Projections, by Technology, Value (US$ Mn), 2017–2031
Figure 62: Europe ESD Protection Devices Market, Incremental Opportunity, by Technology, Value (US$ Mn), 2022 – 2031
Figure 63: Europe ESD Protection Devices Market Share, by Technology, Value (US$ Mn), 2022 – 2031
Figure 64: Europe ESD Protection Devices Market Projections, by Directionality, Value (US$ Mn), 2017–2031
Figure 65: Europe ESD Protection Devices Market, Incremental Opportunity, by Directionality, Value (US$ Mn), 2022 – 2031
Figure 66: Europe ESD Protection Devices Market Share, by Directionality, Value (US$ Mn), 2022 – 2031
Figure 67: Europe ESD Protection Devices Market Projections, by Protection, Value (US$ Mn), 2017–2031
Figure 68: Europe ESD Protection Devices Market, Incremental Opportunity, by Protection, Value (US$ Mn), 2022 – 2031
Figure 69: Europe ESD Protection Devices Market Share, by Protection, Value (US$ Mn), 2022 – 2031
Figure 70: Europe ESD Protection Devices Market Size & Forecast, by Application, Revenue (US$ Mn), 2017–2031
Figure 71: Europe ESD Protection Devices Market Attractiveness, by Application, Value (US$ Mn), 2022 – 2031
Figure 72: Europe ESD Protection Devices Market Size & Forecast, by Application, Value (US$ Mn), 2022 – 2031
Figure 73: Europe ESD Protection Devices Market Size & Forecast, by End-use, Revenue (US$ Mn), 2017–2031
Figure 74: Europe ESD Protection Devices Market Attractiveness, by End-use, Value (US$ Mn), 2022 – 2031
Figure 75: Europe ESD Protection Devices Market Share Analysis, by End-use, 2021 and 2031
Figure 76: Europe ESD Protection Devices Market Size & Forecast, by End-use Industry, Revenue (US$ Mn), 2017–2031
Figure 77: Europe ESD Protection Devices Market Attractiveness, by End-use Industry, Value (US$ Mn), 2022 – 2031
Figure 78: Europe ESD Protection Devices Market Share Analysis, by End-use Industry, 2021 and 2031
Figure 79: Europe ESD Protection Devices Market Size & Forecast, by Region, Revenue (US$ Mn), 2017–2031
Figure 80: Europe ESD Protection Devices Market Attractiveness, by Region, Value (US$ Mn), 2022 – 2031
Figure 81: Asia Pacific ESD Protection Devices Market, Y-O-Y Growth 2017–2031
Figure 82: Asia Pacific ESD Protection Devices Market, Value (US$ Mn), 2017–2031
Figure 83: Asia Pacific ESD Protection Devices Market, Volume (Million Units), 2017–2031
Figure 84: Asia Pacific ESD Protection Devices Market Projections, by Material, Value (US$ Mn), 2017–2031
Figure 85: Asia Pacific ESD Protection Devices Market, Incremental Opportunity, by Material, Value (US$ Mn), 2022 – 2031
Figure 86: Asia Pacific ESD Protection Devices Market Share, by Material, Value (US$ Mn), 2022 – 2031
Figure 87: Asia Pacific ESD Protection Devices Market Projections, by Technology, Value (US$ Mn), 2017–2031
Figure 88: Asia Pacific ESD Protection Devices Market, Incremental Opportunity, by Technology, Value (US$ Mn), 2022 – 2031
Figure 89: Asia Pacific ESD Protection Devices Market Share, by Technology, Value (US$ Mn), 2022 – 2031
Figure 90: Asia Pacific ESD Protection Devices Market Projections, by Directionality, Value (US$ Mn), 2017–2031
Figure 91: Asia Pacific ESD Protection Devices Market, Incremental Opportunity, by Directionality, Value (US$ Mn), 2022 – 2031
Figure 92: Asia Pacific ESD Protection Devices Market Share, by Directionality, Value (US$ Mn), 2022 – 2031
Figure 93: Asia Pacific ESD Protection Devices Market Projections, by Protection, Value (US$ Mn), 2017–2031
Figure 94: Asia Pacific ESD Protection Devices Market, Incremental Opportunity, by Protection, Value (US$ Mn), 2022 – 2031
Figure 95: Asia Pacific ESD Protection Devices Market Share, by Protection, Value (US$ Mn), 2022 – 2031
Figure 96: Asia Pacific ESD Protection Devices Market Size & Forecast, by Application, Revenue (US$ Mn), 2017–2031
Figure 97: Asia Pacific ESD Protection Devices Market Attractiveness, by Application, Value (US$ Mn), 2022 – 2031
Figure 98: Asia Pacific ESD Protection Devices Market Size & Forecast, by Application, Value (US$ Mn), 2022 – 2031
Figure 99: Asia Pacific ESD Protection Devices Market Size & Forecast, by End-use, Revenue (US$ Mn), 2017–2031
Figure 100: Asia Pacific ESD Protection Devices Market Attractiveness, by End-use, Value (US$ Mn), 2022 – 2031
Figure 101: Asia Pacific ESD Protection Devices Market Share Analysis, by End-use, 2021 and 2031
Figure 102: Asia Pacific ESD Protection Devices Market Size & Forecast, by End-use Industry, Revenue (US$ Mn), 2017–2031
Figure 103: Asia Pacific ESD Protection Devices Market Attractiveness, by End-use Industry, Value (US$ Mn), 2022 – 2031
Figure 104: Asia Pacific ESD Protection Devices Market Share Analysis, by End-use Industry, 2021 and 2031
Figure 105: Asia Pacific ESD Protection Devices Market Size & Forecast, by Region, Revenue (US$ Mn), 2017–2031
Figure 106: Asia Pacific ESD Protection Devices Market Attractiveness, by Region, Value (US$ Mn), 2022 – 2031
Figure 107: Middle East & Africa ESD Protection Devices Market, Y-O-Y Growth 2017–2031
Figure 108: Middle East & Africa ESD Protection Devices Market, Value (US$ Mn), 2017–2031
Figure 109: Middle East & Africa ESD Protection Devices Market, Volume (Million Units), 2017–2031
Figure 110: Middle East & Africa ESD Protection Devices Market Projections, by Material, Value (US$ Mn), 2017–2031
Figure 111: Middle East & Africa ESD Protection Devices Market, Incremental Opportunity, by Material, Value (US$ Mn), 2022 – 2031
Figure 112: Middle East & Africa ESD Protection Devices Market Share, by Material, Value (US$ Mn), 2022 – 2031
Figure 113: Middle East & Africa ESD Protection Devices Market Projections, by Technology, Value (US$ Mn), 2017–2031
Figure 114: Middle East & Africa ESD Protection Devices Market, Incremental Opportunity, by Technology, Value (US$ Mn), 2022 – 2031
Figure 115: Middle East & Africa ESD Protection Devices Market Share, by Technology, Value (US$ Mn), 2022 – 2031
Figure 116: Middle East & Africa ESD Protection Devices Market Projections, by Directionality, Value (US$ Mn), 2017–2031
Figure 117: Middle East & Africa ESD Protection Devices Market, Incremental Opportunity, by Directionality, Value (US$ Mn), 2022 – 2031
Figure 118: Middle East & Africa ESD Protection Devices Market Share, by Directionality, Value (US$ Mn), 2022 – 2031
Figure 119: Middle East & Africa ESD Protection Devices Market Projections, by Protection, Value (US$ Mn), 2017–2031
Figure 120: Middle East & Africa ESD Protection Devices Market, Incremental Opportunity, by Protection, Value (US$ Mn), 2022 – 2031
Figure 121: Middle East & Africa ESD Protection Devices Market Share, by Protection, Value (US$ Mn), 2022 – 2031
Figure 122: Middle East & Africa ESD Protection Devices Market Size & Forecast, by Application, Revenue (US$ Mn), 2017–2031
Figure 123: Middle East & Africa ESD Protection Devices Market Attractiveness, by Application, Value (US$ Mn), 2022 – 2031
Figure 124: Middle East & Africa ESD Protection Devices Market Size & Forecast, by Application, Value (US$ Mn), 2022 – 2031
Figure 125: Middle East & Africa ESD Protection Devices Market Size & Forecast, by End-use, Revenue (US$ Mn), 2017–2031
Figure 126: Middle East & Africa ESD Protection Devices Market Attractiveness, by End-use, Value (US$ Mn), 2022 – 2031
Figure 127: Middle East & Africa ESD Protection Devices Market Share Analysis, by End-use, 2021 and 2031
Figure 128: Middle East & Africa ESD Protection Devices Market Size & Forecast, by End-use Industry, Revenue (US$ Mn), 2017–2031
Figure 129: Middle East & Africa ESD Protection Devices Market Attractiveness, by End-use Industry, Value (US$ Mn), 2022 – 2031
Figure 130: Middle East & Africa ESD Protection Devices Market Share Analysis, by End-use Industry, 2021 and 2031
Figure 131: Middle East & Africa ESD Protection Devices Market Size & Forecast, by Region, Revenue (US$ Mn), 2017–2031
Figure 132: Middle East & Africa ESD Protection Devices Market Attractiveness, by Region, Value (US$ Mn), 2022 – 2031
Figure 133: South America ESD Protection Devices Market, Y-O-Y Growth 2017–2031
Figure 134: South America ESD Protection Devices Market, Value (US$ Mn), 2017–2031
Figure 135: South America ESD Protection Devices Market, Volume (Million Units), 2017–2031
Figure 136: South America ESD Protection Devices Market Projections, by Material, Value (US$ Mn), 2017–2031
Figure 137: South America ESD Protection Devices Market, Incremental Opportunity, by Material, Value (US$ Mn), 2022 – 2031
Figure 138: South America ESD Protection Devices Market Share, by Material, Value (US$ Mn), 2022 – 2031
Figure 139: South America ESD Protection Devices Market Projections, by Technology, Value (US$ Mn), 2017–2031
Figure 140: South America ESD Protection Devices Market, Incremental Opportunity, by Technology, Value (US$ Mn), 2022 – 2031
Figure 141: South America ESD Protection Devices Market Share, by Technology, Value (US$ Mn), 2022 – 2031
Figure 142: South America ESD Protection Devices Market Projections, by Directionality, Value (US$ Mn), 2017–2031
Figure 143: South America ESD Protection Devices Market, Incremental Opportunity, by Directionality, Value (US$ Mn), 2022 – 2031
Figure 144: South America ESD Protection Devices Market Share, by Directionality, Value (US$ Mn), 2022 – 2031
Figure 145: South America ESD Protection Devices Market Projections, by Protection, Value (US$ Mn), 2017–2031
Figure 146: South America ESD Protection Devices Market, Incremental Opportunity, by Protection, Value (US$ Mn), 2022 – 2031
Figure 147: South America ESD Protection Devices Market Share, by Protection, Value (US$ Mn), 2022 – 2031
Figure 148: South America ESD Protection Devices Market Size & Forecast, by Application, Revenue (US$ Mn), 2017–2031
Figure 149: South America ESD Protection Devices Market Attractiveness, by Application, Value (US$ Mn), 2022 – 2031
Figure 150: South America ESD Protection Devices Market Size & Forecast, by Application, Value (US$ Mn), 2022 – 2031
Figure 151: South America ESD Protection Devices Market Size & Forecast, by End-use, Revenue (US$ Mn), 2017–2031
Figure 152: South America ESD Protection Devices Market Attractiveness, by End-use, Value (US$ Mn), 2022 – 2031
Figure 153: South America ESD Protection Devices Market Share Analysis, by End-use, 2021 and 2031
Figure 154: South America ESD Protection Devices Market Size & Forecast, by End-use Industry, Revenue (US$ Mn), 2017–2031
Figure 155: South America ESD Protection Devices Market Attractiveness, by End-use Industry, Value (US$ Mn), 2022 – 2031
Figure 156: South America ESD Protection Devices Market Share Analysis, by End-use Industry, 2021 and 2031
Figure 157: South America ESD Protection Devices Market Size & Forecast, by Region, Revenue (US$ Mn), 2017–2031
Figure 158: South America ESD Protection Devices Market Attractiveness, by Region, Value (US$ Mn), 2022 – 2031
Copyright © Transparency Market Research, Inc. All Rights reserved
Trust Online

ESD Protection Devices Market