
Reports
Reports
ESD (electrostatic discharge) bags and pouch packaging is characterized of providing a partial or complete protective shield from static charges for various ESD-sensitive items, notably electronics and electrical devices and equipment. Commonly made of polymers or metals, the packaging is often resistant to electrostatic discharge and shields the content of the packaging from static charges in different external environments. ESD bags and pouch find substantial demand for storing and in shipping of electronics and they provide the required visibility to identify such sensitive items. ESD packaging has been found to be useful in providing a static safe environment required in a number of end-use industries including electrical and electronics, automobile, manufacturing, aerospace, and healthcare. The use of numerous military equipment world over, such as fire control and navigation systems that are highly sensitive to ESD has intensified the need for such bags and pouches.
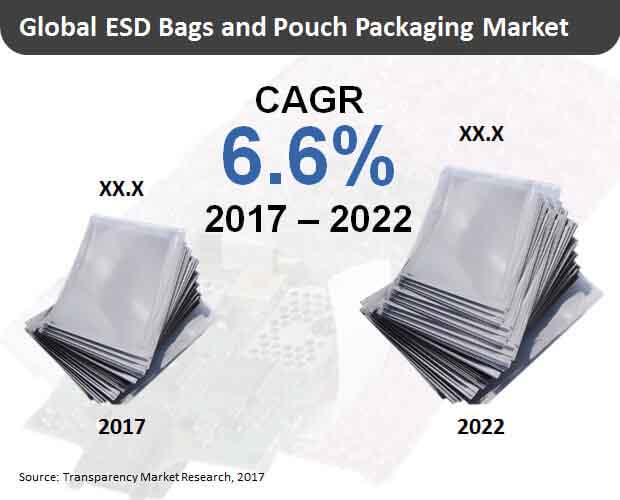
The ESD bags and pouch packaging market is estimated to be valued at US$358.9 Mn in 2017 and is projected to reach US$495.0 by the end of 2022. The market is projected to register a CAGR of 6.6% from 2017 to 2022.
Based on material and additive type, the various segments are conductive and dissipative polymers, metal, and additive. Of these, the largest is ESD bags and pouch made of conductive and dissipative polymers. The substantial demand for these materials types is attributed to their versatility of applications in the comprehensive protection of ESD-sensitive components. The segment is worth US$311.2 Mn in 2017, representing a whopping share of 86.7% and is estimated to reach a worth of US$ 433.9 Mn by 2022 end. The annual growth of the segment is pegged at US$ 24.5 Mn from 2017 to 2022, rising at a CAGR of 6.9% during the same forecast timeline. Among all material and additive types, this segment is projected to hold 87.6% share of the market by the end of 2022.
The various regional markets for ESD bags and pouch packaging are Latin America, North America, the Middle East and Africa, Europe, Asia Pacific excluding Japan (APEJ), and Japan. Among these, the APEJ ESD bags & pouch packaging market is predicted to be the most attractive regional market and is anticipated to hold the dominant share throughout the forecast timeline. The regional market is projected to expand at a CAGR of 7.0% during 2017–2022 and is anticipated to create an opportunity of US$68.3 Mn over this period. The substantial demand for ESD bags and pouch is fueled by a burgeoning electronics and semiconductor sector in the region, thereby propelling the demand for packaging to protect the buildup or rejection of static charges in devices and components.
The absolute opportunity contributed by the APEJ market is estimated at US$ 68.3 Mn from 2017 to 2022.
Europe and Japan are prominent regional markets for ESD bags and pouch packaging with the demand driven by the need for ESD shielding for a number of sensitive devices, equipment, and component. Europe ESD bags & pouch packaging market hold a share of 17.2% of the global ESD bags & pouch packaging market vis-à-vis revenue by the end of 2017 end.
Meanwhile, the Japan ESD bags & pouch packaging market is estimated at 6.7% share of revenue in the global market by 2017. The regional market is projected to gain a share estimated at 8 basis points (BPS) between 2017 and 2022.
Key players profiled in this report are Desco Industries, Inc., Tekins Limited, Elcom (U.K.) Ltd., GWP Group Limited, Botron Company Inc., Conductive Containers, Inc., Conductive Containers, Inc., Electrotek Static Controls Pvt Ltd, and Statclean Technology (S) Pte Ltd. A number of players are focused on launching ESD bags and pouch made of advanced materials with excellent barrier properties, in order to stay ahead of the pack.
Demand in Packaging of Advanced Electronics to Boost Valuation of ESD Bags & Pouch Packaging Market
Antistatic packaging materials are widely used in ESD bags and pouches for packaging stuff that are sensitive to electrostatic charges. Thus, ESD bags and pouches materials are popularly used in packaging wide range of sensitive electronic circuitries, military-grade electronic components, and such items whose functionality may be impaired by ESD. Growing shipping of printed circuit boards and network cards in such pouches has bolstered the uptake in the ESD bags and pouch packaging market. Advances in PET processing have allowed packaging manufacturers to meet a variety of functional and aesthetic characteristics of the packaging in end-use applications. Products with different multilayer design parameters are gathering traction in the ESD bags and pouch packaging market. High-end electronics that can be damaged by sparks are also packaged using ESD bags and pouch packaging. Electronics manufacturers are keen on adopting economically priced products. Hence, packaging companies catering to the demand are keen on using cost-effective materials and manufacturing technologies. The growing use of multilayer barrier packaging for various types of electronics and semiconductor components has boosted the sales of packaging companies in the ESD bags and pouch packaging.
The COVID-19 pandemic has led to numerous disruptions in industries across the globe. Some businesses were realign their strategic and operational frameworks to remain agile and reduce the loss of revenues especially in the early part of 2020. Rapid pace of use of digital networks across enterprises has witnessed uptick in the latter part of the year. This has also boosted the prospects in the ESD bags and pouch packaging market. Further, growing spending on sourcing military-grade electronics in several developing nations has also imparted a robust fillip to the transportation of such electronic components, thereby spurring the utilization of ESD bags and pouch packaging. Also, rapidly growing internet of things is fueling the demand for electronics, which, in turn, is propelling the demand for ESD bags and pouch packaging.
1. Global ESD Bags & Pouch Packaging Market - Executive Summary
2. Global ESD Bags & Pouch Packaging Market Overview
2.1. Introduction
2.1.1. Global ESD Bags & Pouch Packaging Market Taxonomy
2.1.2. Global ESD Bags & Pouch Packaging Market Definition
2.2. Global ESD Bags & Pouch Packaging Market Size (US$ Mn) and Forecast, 2012-2022
2.2.1. Global ESD Bags & Pouch Packaging Market Y-o-Y Growth
2.3. Global ESD Bags & Pouch Packaging Market Dynamics
2.4. Supply Chain
2.5. Cost Structure
2.6. Pricing Analysis
2.7. Raw Material Sourcing Strategy and Analysis
2.8. List of Distributors
2.9. Key Participants Market Presence (Intensity Map) By Region
3. Global ESD Bags & Pouch Packaging Market Analysis and Forecast By Material & Additive Type
3.1. Global ESD Bags & Pouch Packaging Market Size and Forecast By Material & Additive Type, 2012-2022
3.1.1. Conductive & Dissipative Polymers Market Size and Forecast, 2012-2022
3.1.1.1. Revenue (US$ Mn) Comparison, By Region
3.1.1.2. Market Share Comparison, By Region
3.1.1.3. Y-o-Y growth Comparison, By Region
3.1.2. Metal Market Size and Forecast, 2012-2022
3.1.2.1. Revenue (US$ Mn) Comparison, By Region
3.1.2.2. Market Share Comparison, By Region
3.1.2.3. Y-o-Y growth Comparison, By Region
3.1.3. Additive Market Size and Forecast, 2012-2022
3.1.3.1. Revenue (US$ Mn) Comparison, By Region
3.1.3.2. Market Share Comparison, By Region
3.1.3.3. Y-o-Y growth Comparison, By Region
4. Global ESD Bags & Pouch Packaging Market Analysis and Forecast By End Use Industry
4.1. Global ESD Bags & Pouch Packaging Market Size and Forecast By End Use Industry, 2012-2022
4.1.1. Electrical & Electronics Market Size and Forecast, 2012-2022
4.1.1.1. Revenue (US$ Mn) Comparison, By Region
4.1.1.2. Market Share Comparison, By Region
4.1.1.3. Y-o-Y growth Comparison, By Region
4.1.2. Automobile Market Size and Forecast, 2012-2022
4.1.2.1. Revenue (US$ Mn) Comparison, By Region
4.1.2.2. Market Share Comparison, By Region
4.1.2.3. Y-o-Y growth Comparison, By Region
4.1.3. Defense & Military Market Size and Forecast, 2012-2022
4.1.3.1. Revenue (US$ Mn) Comparison, By Region
4.1.3.2. Market Share Comparison, By Region
4.1.3.3. Y-o-Y growth Comparison, By Region
4.1.4. Manufacturing Market Size and Forecast, 2012-2022
4.1.4.1. Revenue (US$ Mn) Comparison, By Region
4.1.4.2. Market Share Comparison, By Region
4.1.4.3. Y-o-Y growth Comparison, By Region
4.1.5. Aerospace Market Size and Forecast, 2012-2022
4.1.5.1. Revenue (US$ Mn) Comparison, By Region
4.1.5.2. Market Share Comparison, By Region
4.1.5.3. Y-o-Y growth Comparison, By Region
4.1.6. Healthcare Market Size and Forecast, 2012-2022
4.1.6.1. Revenue (US$ Mn) Comparison, By Region
4.1.6.2. Market Share Comparison, By Region
4.1.6.3. Y-o-Y growth Comparison, By Region
4.1.7. Other End Use Industry Market Size and Forecast, 2012-2022
4.1.7.1. Revenue (US$ Mn) Comparison, By Region
4.1.7.2. Market Share Comparison, By Region
4.1.7.3. Y-o-Y growth Comparison, By Region
5. Global ESD Bags & Pouch Packaging Market Analysis and Forecast By Application Type
5.1. Global ESD Bags & Pouch Packaging Market Size and Forecast By Application Type, 2012-2022
5.1.1. Electrical & Electronic Component Market Size and Forecast, 2012-2022
5.1.1.1. Revenue (US$ Mn) Comparison, By Region
5.1.1.2. Market Share Comparison, By Region
5.1.1.3. Y-o-Y growth Comparison, By Region
5.1.2. Explosive Powders Market Size and Forecast, 2012-2022
5.1.2.1. Revenue (US$ Mn) Comparison, By Region
5.1.2.2. Market Share Comparison, By Region
5.1.2.3. Y-o-Y growth Comparison, By Region
5.1.3. Drugs Market Size and Forecast, 2012-2022
5.1.3.1. Revenue (US$ Mn) Comparison, By Region
5.1.3.2. Market Share Comparison, By Region
5.1.3.3. Y-o-Y growth Comparison, By Region
5.1.4. Other Application Type Market Size and Forecast, 2012-2022
5.1.4.1. Revenue (US$ Mn) Comparison, By Region
5.1.4.2. Market Share Comparison, By Region
5.1.4.3. Y-o-Y growth Comparison, By Region
6. Global ESD Bags & Pouch Packaging Market Analysis and Forecast By Region
6.1. Global ESD Bags & Pouch Packaging Market Size and Forecast, 2012-2022
6.1.1. North America ESD Bags & Pouch Packaging Market Size and Forecast, 2012-2022
6.1.1.1. Revenue (US$ Mn) Comparison, By Material & Additive Type
6.1.1.2. Revenue (US$ Mn) Comparison, By End Use Industry
6.1.1.3. Revenue (US$ Mn) Comparison, By Application Type
6.1.2. Latin America ESD Bags & Pouch Packaging Market Size and Forecast, 2012-2022
6.1.2.1. Revenue (US$ Mn) Comparison, By Material & Additive Type
6.1.2.2. Revenue (US$ Mn) Comparison, By End Use Industry
6.1.2.3. Revenue (US$ Mn) Comparison, By Application Type
6.1.3. Europe ESD Bags & Pouch Packaging Market Size and Forecast, 2012-2022
6.1.3.1. Revenue (US$ Mn) Comparison, By Material & Additive Type
6.1.3.2. Revenue (US$ Mn) Comparison, By End Use Industry
6.1.3.3. Revenue (US$ Mn) Comparison, By Application Type
6.1.4. Japan ESD Bags & Pouch Packaging Market Size and Forecast, 2012-2022
6.1.4.1. Revenue (US$ Mn) Comparison, By Material & Additive Type
6.1.4.2. Revenue (US$ Mn) Comparison, By End Use Industry
6.1.4.3. Revenue (US$ Mn) Comparison, By Application Type
6.1.5. APEJ ESD Bags & Pouch Packaging Market Size and Forecast, 2012-2022
6.1.5.1. Revenue (US$ Mn) Comparison, By Material & Additive Type
6.1.5.2. Revenue (US$ Mn) Comparison, By End Use Industry
6.1.5.3. Revenue (US$ Mn) Comparison, By Application Type
6.1.6. MEA ESD Bags & Pouch Packaging Market Size and Forecast, 2012-2022
6.1.6.1. Revenue (US$ Mn) Comparison, By Material & Additive Type
6.1.6.2. Revenue (US$ Mn) Comparison, By End Use Industry
6.1.6.3. Revenue (US$ Mn) Comparison, By Application Type
7. North America ESD Bags & Pouch Packaging Market Analysis and Forecast, By Country, 2012-2022
7.1. US ESD Bags & Pouch Packaging Market Size and Forecast, 2012-2022
7.1.1. Revenue (US$ Mn) Comparison, By Material & Additive Type
7.1.2. Revenue (US$ Mn) Comparison, By End Use Industry
7.1.3. Revenue (US$ Mn) Comparison, By Application Type
7.2. Canada ESD Bags & Pouch Packaging Market Size and Forecast, 2012-2022
7.2.1. Revenue (US$ Mn) Comparison, By Material & Additive Type
7.2.2. Revenue (US$ Mn) Comparison, By End Use Industry
7.2.3. Revenue (US$ Mn) Comparison, By Application Type
8. Latin America ESD Bags & Pouch Packaging Market Analysis and Forecast, By Country, 2012-2022
8.1. Brazil ESD Bags & Pouch Packaging Market Size and Forecast, 2012-2022
8.1.1. Revenue (US$ Mn) Comparison, By Material & Additive Type
8.1.2. Revenue (US$ Mn) Comparison, By End Use Industry
8.1.3. Revenue (US$ Mn) Comparison, By Application Type
8.2. Mexico ESD Bags & Pouch Packaging Market Size and Forecast, 2012-2022
8.2.1. Revenue (US$ Mn) Comparison, By Material & Additive Type
8.2.2. Revenue (US$ Mn) Comparison, By End Use Industry
8.2.3. Revenue (US$ Mn) Comparison, By Application Type
8.3. Argentina ESD Bags & Pouch Packaging Market Size and Forecast, 2012-2022
8.3.1. Revenue (US$ Mn) Comparison, By Material & Additive Type
8.3.2. Revenue (US$ Mn) Comparison, By End Use Industry
8.3.3. Revenue (US$ Mn) Comparison, By Application Type
9. Europe ESD Bags & Pouch Packaging Market Analysis and Forecast, By Country, 2012-2022
9.1. Germany ESD Bags & Pouch Packaging Market Size and Forecast, 2012-2022
9.1.1. Revenue (US$ Mn) Comparison, By Material & Additive Type
9.1.2. Revenue (US$ Mn) Comparison, By End Use Industry
9.1.3. Revenue (US$ Mn) Comparison, By Application Type
9.2. UK ESD Bags & Pouch Packaging Market Size and Forecast, 2012-2022
9.2.1. Revenue (US$ Mn) Comparison, By Material & Additive Type
9.2.2. Revenue (US$ Mn) Comparison, By End Use Industry
9.2.3. Revenue (US$ Mn) Comparison, By Application Type
9.3. France ESD Bags & Pouch Packaging Market Size and Forecast, 2012-2022
9.3.1. Revenue (US$ Mn) Comparison, By Material & Additive Type
9.3.2. Revenue (US$ Mn) Comparison, By End Use Industry
9.3.3. Revenue (US$ Mn) Comparison, By Application Type
9.4. Spain ESD Bags & Pouch Packaging Market Size and Forecast, 2012-2022
9.4.1. Revenue (US$ Mn) Comparison, By Material & Additive Type
9.4.2. Revenue (US$ Mn) Comparison, By End Use Industry
9.4.3. Revenue (US$ Mn) Comparison, By Application Type
9.5. Italy ESD Bags & Pouch Packaging Market Size and Forecast, 2012-2022
9.5.1. Revenue (US$ Mn) Comparison, By Material & Additive Type
9.5.2. Revenue (US$ Mn) Comparison, By End Use Industry
9.5.3. Revenue (US$ Mn) Comparison, By Application Type
9.6. Russia ESD Bags & Pouch Packaging Market Size and Forecast, 2012-2022
9.6.1. Revenue (US$ Mn) Comparison, By Material & Additive Type
9.6.2. Revenue (US$ Mn) Comparison, By End Use Industry
9.6.3. Revenue (US$ Mn) Comparison, By Application Type
10. Japan ESD Bags & Pouch Packaging Market Analysis and Forecast, By Country, 2012-2022
10.1. Japan ESD Bags & Pouch Packaging Market Size and Forecast, 2012-2022
10.1.1. Revenue (US$ Mn) Comparison, By Material & Additive Type
10.1.2. Revenue (US$ Mn) Comparison, By End Use Industry
10.1.3. Revenue (US$ Mn) Comparison, By Application Type
11. APEJ ESD Bags & Pouch Packaging Market Analysis and Forecast, By Country, 2012-2022
11.1. China ESD Bags & Pouch Packaging Market Size and Forecast, 2012-2022
11.1.1. Revenue (US$ Mn) Comparison, By Material & Additive Type
11.1.2. Revenue (US$ Mn) Comparison, By End Use Industry
11.1.3. Revenue (US$ Mn) Comparison, By Application Type
11.2. India ESD Bags & Pouch Packaging Market Size and Forecast, 2012-2022
11.2.1. Revenue (US$ Mn) Comparison, By Material & Additive Type
11.2.2. Revenue (US$ Mn) Comparison, By End Use Industry
11.2.3. Revenue (US$ Mn) Comparison, By Application Type
11.3. Malaysia ESD Bags & Pouch Packaging Market Size and Forecast, 2012-2022
11.3.1. Revenue (US$ Mn) Comparison, By Material & Additive Type
11.3.2. Revenue (US$ Mn) Comparison, By End Use Industry
11.3.3. Revenue (US$ Mn) Comparison, By Application Type
11.4. Thailand ESD Bags & Pouch Packaging Market Size and Forecast, 2012-2022
11.4.1. Revenue (US$ Mn) Comparison, By Material & Additive Type
11.4.2. Revenue (US$ Mn) Comparison, By End Use Industry
11.4.3. Revenue (US$ Mn) Comparison, By Application Type
11.5. Singapore ESD Bags & Pouch Packaging Market Size and Forecast, 2012-2022
11.5.1. Revenue (US$ Mn) Comparison, By Material & Additive Type
11.5.2. Revenue (US$ Mn) Comparison, By End Use Industry
11.5.3. Revenue (US$ Mn) Comparison, By Application Type
11.6. Australia ESD Bags & Pouch Packaging Market Size and Forecast, 2012-2022
11.6.1. Revenue (US$ Mn) Comparison, By Material & Additive Type
11.6.2. Revenue (US$ Mn) Comparison, By End Use Industry
11.6.3. Revenue (US$ Mn) Comparison, By Application Type
12. MEA ESD Bags & Pouch Packaging Market Analysis and Forecast, By Country, 2012-2022
12.1. GCC Countries ESD Bags & Pouch Packaging Market Size and Forecast, 2012-2022
12.1.1. Revenue (US$ Mn) Comparison, By Material & Additive Type
12.1.2. Revenue (US$ Mn) Comparison, By End Use Industry
12.1.3. Revenue (US$ Mn) Comparison, By Application Type
12.2. South Africa ESD Bags & Pouch Packaging Market Size and Forecast, 2012-2022
12.2.1. Revenue (US$ Mn) Comparison, By Material & Additive Type
12.2.2. Revenue (US$ Mn) Comparison, By End Use Industry
12.2.3. Revenue (US$ Mn) Comparison, By Application Type
12.3. Nigeria ESD Bags & Pouch Packaging Market Size and Forecast, 2012-2022
12.3.1. Revenue (US$ Mn) Comparison, By Material & Additive Type
12.3.2. Revenue (US$ Mn) Comparison, By End Use Industry
12.3.3. Revenue (US$ Mn) Comparison, By Application Type
12.4. Israel ESD Bags & Pouch Packaging Market Size and Forecast, 2012-2022
12.4.1. Revenue (US$ Mn) Comparison, By Material & Additive Type
12.4.2. Revenue (US$ Mn) Comparison, By End Use Industry
12.4.3. Revenue (US$ Mn) Comparison, By Application Type
13. Global ESD Bags & Pouch Packaging Market Company Share, Competition Landscape and Company Profiles
13.1. Company Share Analysis
13.2. Competition Landscape
13.3. Company Profiles
13.3.1. Desco Industries, Inc.
13.3.2. Tekins Limited
13.3.3. Elcom (U.K.) Ltd.
13.3.4. GWP Group Limited
13.3.5. Botron Company Inc
13.3.6. Conductive Containers, Inc.
13.3.7. Helios Packaging
13.3.8. Electrotek Static Controls Pvt Ltd
13.3.9. Statclean Technology (S) Pte Ltd
14. Research Methodology
15. Secondary and Primary Sources
16. Assumptions and Acronyms
17. Disclaimer
List of Tables
TABLE 1 Global ESD Bags & Pouch Packaging Market Value (US$ Mn), 2012-2016
TABLE 2 Global ESD Bags & Pouch Packaging Market Value (US$ Mn), 2017-2022
TABLE 3 Global ESD Bags & Pouch Packaging Market Value (US$ Mn) and Y-o-Y, 2015-2022
TABLE 4 Global Conductive & Dissipative Polymers Segment Value (US$ Mn), By Region 2012-2016
TABLE 5 Global Conductive & Dissipative Polymers Segment Value (US$ Mn), By Region 2017-2022
TABLE 6 Global Conductive & Dissipative Polymers Segment Market Share, By Region 2012-2016
TABLE 7 Global Conductive & Dissipative Polymers Segment Market Share, By Region 2017-2022
TABLE 8 Global Conductive & Dissipative Polymers Segment Y-o-Y, By Region 2015-2022
TABLE 9 Global Metal Segment Value (US$ Mn), By Region 2012-2016
TABLE 10 Global Metal Segment Value (US$ Mn), By Region 2017-2022
TABLE 11 Global Metal Segment Market Share, By Region 2012-2016
TABLE 12 Global Metal Segment Market Share, By Region 2017-2022
TABLE 13 Global Metal Segment Y-o-Y, By Region 2015-2022
TABLE 14 Global Additive Segment Value (US$ Mn), By Region 2012-2016
TABLE 15 Global Additive Segment Value (US$ Mn), By Region 2017-2022
TABLE 16 Global Additive Segment Market Share, By Region 2012-2016
TABLE 17 Global Additive Segment Market Share, By Region 2017-2022
TABLE 18 Global Additive Segment Y-o-Y, By Region 2015-2022
TABLE 19 Global Electrical & Electronics Segment Value (US$ Mn), By Region 2012-2016
TABLE 20 Global Electrical & Electronics Segment Value (US$ Mn), By Region 2017-2022
TABLE 21 Global Electrical & Electronics Segment Market Share, By Region 2012-2016
TABLE 22 Global Electrical & Electronics Segment Market Share, By Region 2017-2022
TABLE 23 Global Electrical & Electronics Segment Y-o-Y, By Region 2015-2022
TABLE 24 Global Automobile Segment Value (US$ Mn), By Region 2012-2016
TABLE 25 Global Automobile Segment Value (US$ Mn), By Region 2017-2022
TABLE 26 Global Automobile Segment Market Share, By Region 2012-2016
TABLE 27 Global Automobile Segment Market Share, By Region 2017-2022
TABLE 28 Global Automobile Segment Y-o-Y, By Region 2015-2022
TABLE 29 Global Defense & Military Segment Value (US$ Mn), By Region 2012-2016
TABLE 30 Global Defense & Military Segment Value (US$ Mn), By Region 2017-2022
TABLE 31 Global Defense & Military Segment Market Share, By Region 2012-2016
TABLE 32 Global Defense & Military Segment Market Share, By Region 2017-2022
TABLE 33 Global Defense & Military Segment Y-o-Y, By Region 2015-2022
TABLE 34 Global Manufacturing Segment Value (US$ Mn), By Region 2012-2016
TABLE 35 Global Manufacturing Segment Value (US$ Mn), By Region 2017-2022
TABLE 36 Global Manufacturing Segment Market Share, By Region 2012-2016
TABLE 37 Global Manufacturing Segment Market Share, By Region 2017-2022
TABLE 38 Global Manufacturing Segment Y-o-Y, By Region 2015-2022
TABLE 39 Global Aerospace Segment Value (US$ Mn), By Region 2012-2016
TABLE 40 Global Aerospace Segment Value (US$ Mn), By Region 2017-2022
TABLE 41 Global Aerospace Segment Market Share, By Region 2012-2016
TABLE 42 Global Aerospace Segment Market Share, By Region 2017-2022
TABLE 43 Global Aerospace Segment Y-o-Y, By Region 2015-2022
TABLE 44 Global Healthcare Segment Value (US$ Mn), By Region 2012-2016
TABLE 45 Global Healthcare Segment Value (US$ Mn), By Region 2017-2022
TABLE 46 Global Healthcare Segment Market Share, By Region 2012-2016
TABLE 47 Global Healthcare Segment Market Share, By Region 2017-2022
TABLE 48 Global Healthcare Segment Y-o-Y, By Region 2015-2022
TABLE 49 Global Other End Use Industry Segment Value (US$ Mn), By Region 2012-2016
TABLE 50 Global Other End Use Industry Segment Value (US$ Mn), By Region 2017-2022
TABLE 51 Global Other End Use Industry Segment Market Share, By Region 2012-2016
TABLE 52 Global Other End Use Industry Segment Market Share, By Region 2017-2022
TABLE 53 Global Other End Use Industry Segment Y-o-Y, By Region 2015-2022
TABLE 54 Global Electrical & Electronic Component Segment Value (US$ Mn), By Region 2012-2016
TABLE 55 Global Electrical & Electronic Component Segment Value (US$ Mn), By Region 2017-2022
TABLE 56 Global Electrical & Electronic Component Segment Market Share, By Region 2012-2016
TABLE 57 Global Electrical & Electronic Component Segment Market Share, By Region 2017-2022
TABLE 58 Global Electrical & Electronic Component Segment Y-o-Y, By Region 2015-2022
TABLE 59 Global Explosive Powders Segment Value (US$ Mn), By Region 2012-2016
TABLE 60 Global Explosive Powders Segment Value (US$ Mn), By Region 2017-2022
TABLE 61 Global Explosive Powders Segment Market Share, By Region 2012-2016
TABLE 62 Global Explosive Powders Segment Market Share, By Region 2017-2022
TABLE 63 Global Explosive Powders Segment Y-o-Y, By Region 2015-2022
TABLE 64 Global Drugs Segment Value (US$ Mn), By Region 2012-2016
TABLE 65 Global Drugs Segment Value (US$ Mn), By Region 2017-2022
TABLE 66 Global Drugs Segment Market Share, By Region 2012-2016
TABLE 67 Global Drugs Segment Market Share, By Region 2017-2022
TABLE 68 Global Drugs Segment Y-o-Y, By Region 2015-2022
TABLE 69 Global Other Application Type Segment Value (US$ Mn), By Region 2012-2016
TABLE 70 Global Other Application Type Segment Value (US$ Mn), By Region 2017-2022
TABLE 71 Global Other Application Type Segment Market Share, By Region 2012-2016
TABLE 72 Global Other Application Type Segment Market Share, By Region 2017-2022
TABLE 73 Global Other Application Type Segment Y-o-Y, By Region 2015-2022
TABLE 74 North America ESD Bags & Pouch Packaging Market Value (US$ Mn), By Material & Additive Type 2012-2016
TABLE 75 North America ESD Bags & Pouch Packaging Market Value (US$ Mn), By Material & Additive Type 2017-2022
TABLE 76 North America ESD Bags & Pouch Packaging Market Value (US$ Mn), By End Use Industry 2012-2016
TABLE 77 North America ESD Bags & Pouch Packaging Market Value (US$ Mn), By End Use Industry 2017-2022
TABLE 78 North America ESD Bags & Pouch Packaging Market Value (US$ Mn), By Application Type 2012-2016
TABLE 79 North America ESD Bags & Pouch Packaging Market Value (US$ Mn), By Application Type 2017-2022
TABLE 80 Latin America ESD Bags & Pouch Packaging Market Value (US$ Mn), By Material & Additive Type 2012-2016
TABLE 81 Latin America ESD Bags & Pouch Packaging Market Value (US$ Mn), By Material & Additive Type 2017-2022
TABLE 82 Latin America ESD Bags & Pouch Packaging Market Value (US$ Mn), By End Use Industry 2012-2016
TABLE 83 Latin America ESD Bags & Pouch Packaging Market Value (US$ Mn), By End Use Industry 2017-2022
TABLE 84 Latin America ESD Bags & Pouch Packaging Market Value (US$ Mn), By Application Type 2012-2016
TABLE 85 Latin America ESD Bags & Pouch Packaging Market Value (US$ Mn), By Application Type 2017-2022
TABLE 86 Europe ESD Bags & Pouch Packaging Market Value (US$ Mn), By Material & Additive Type 2012-2016
TABLE 87 Europe ESD Bags & Pouch Packaging Market Value (US$ Mn), By Material & Additive Type 2017-2022
TABLE 88 Europe ESD Bags & Pouch Packaging Market Value (US$ Mn), By End Use Industry 2012-2016
TABLE 89 Europe ESD Bags & Pouch Packaging Market Value (US$ Mn), By End Use Industry 2017-2022
TABLE 90 Europe ESD Bags & Pouch Packaging Market Value (US$ Mn), By Application Type 2012-2016
TABLE 91 Europe ESD Bags & Pouch Packaging Market Value (US$ Mn), By Application Type 2017-2022
TABLE 92 Japan ESD Bags & Pouch Packaging Market Value (US$ Mn), By Material & Additive Type 2012-2016
TABLE 93 Japan ESD Bags & Pouch Packaging Market Value (US$ Mn), By Material & Additive Type 2017-2022
TABLE 94 Japan ESD Bags & Pouch Packaging Market Value (US$ Mn), By End Use Industry 2012-2016
TABLE 95 Japan ESD Bags & Pouch Packaging Market Value (US$ Mn), By End Use Industry 2017-2022
TABLE 96 Japan ESD Bags & Pouch Packaging Market Value (US$ Mn), By Application Type 2012-2016
TABLE 97 Japan ESD Bags & Pouch Packaging Market Value (US$ Mn), By Application Type 2017-2022
TABLE 98 APEJ ESD Bags & Pouch Packaging Market Value (US$ Mn), By Material & Additive Type 2012-2016
TABLE 99 APEJ ESD Bags & Pouch Packaging Market Value (US$ Mn), By Material & Additive Type 2017-2022
TABLE 100 APEJ ESD Bags & Pouch Packaging Market Value (US$ Mn), By End Use Industry 2012-2016
TABLE 101 APEJ ESD Bags & Pouch Packaging Market Value (US$ Mn), By End Use Industry 2017-2022
TABLE 102 APEJ ESD Bags & Pouch Packaging Market Value (US$ Mn), By Application Type 2012-2016
TABLE 103 APEJ ESD Bags & Pouch Packaging Market Value (US$ Mn), By Application Type 2017-2022
TABLE 104 MEA ESD Bags & Pouch Packaging Market Value (US$ Mn), By Material & Additive Type 2012-2016
TABLE 105 MEA ESD Bags & Pouch Packaging Market Value (US$ Mn), By Material & Additive Type 2017-2022
TABLE 106 MEA ESD Bags & Pouch Packaging Market Value (US$ Mn), By End Use Industry 2012-2016
TABLE 107 MEA ESD Bags & Pouch Packaging Market Value (US$ Mn), By End Use Industry 2017-2022
TABLE 108 MEA ESD Bags & Pouch Packaging Market Value (US$ Mn), By Application Type 2012-2016
TABLE 109 MEA ESD Bags & Pouch Packaging Market Value (US$ Mn), By Application Type 2017-2022
TABLE 110 US ESD Bags & Pouch Packaging Market Value (US$ Mn), By Material & Additive Type 2012-2016
TABLE 111 US ESD Bags & Pouch Packaging Market Value (US$ Mn), By Material & Additive Type 2017-2022
TABLE 112 US ESD Bags & Pouch Packaging Market Value (US$ Mn), By End Use Industry 2012-2016
TABLE 113 US ESD Bags & Pouch Packaging Market Value (US$ Mn), By End Use Industry 2017-2022
TABLE 114 US ESD Bags & Pouch Packaging Market Value (US$ Mn), By Application Type 2012-2016
TABLE 115 US ESD Bags & Pouch Packaging Market Value (US$ Mn), By Application Type 2017-2022
TABLE 116 Canada ESD Bags & Pouch Packaging Market Value (US$ Mn), By Material & Additive Type 2012-2016
TABLE 117 Canada ESD Bags & Pouch Packaging Market Value (US$ Mn), By Material & Additive Type 2017-2022
TABLE 118 Canada ESD Bags & Pouch Packaging Market Value (US$ Mn), By End Use Industry 2012-2016
TABLE 119 Canada ESD Bags & Pouch Packaging Market Value (US$ Mn), By End Use Industry 2017-2022
TABLE 120 Canada ESD Bags & Pouch Packaging Market Value (US$ Mn), By Application Type 2012-2016
TABLE 121 Canada ESD Bags & Pouch Packaging Market Value (US$ Mn), By Application Type 2017-2022
TABLE 122 Brazil ESD Bags & Pouch Packaging Market Value (US$ Mn), By Material & Additive Type 2012-2016
TABLE 123 Brazil ESD Bags & Pouch Packaging Market Value (US$ Mn), By Material & Additive Type 2017-2022
TABLE 124 Brazil ESD Bags & Pouch Packaging Market Value (US$ Mn), By End Use Industry 2012-2016
TABLE 125 Brazil ESD Bags & Pouch Packaging Market Value (US$ Mn), By End Use Industry 2017-2022
TABLE 126 Brazil ESD Bags & Pouch Packaging Market Value (US$ Mn), By Application Type 2012-2016
TABLE 127 Brazil ESD Bags & Pouch Packaging Market Value (US$ Mn), By Application Type 2017-2022
TABLE 128 Mexico ESD Bags & Pouch Packaging Market Value (US$ Mn), By Material & Additive Type 2012-2016
TABLE 129 Mexico ESD Bags & Pouch Packaging Market Value (US$ Mn), By Material & Additive Type 2017-2022
TABLE 130 Mexico ESD Bags & Pouch Packaging Market Value (US$ Mn), By End Use Industry 2012-2016
TABLE 131 Mexico ESD Bags & Pouch Packaging Market Value (US$ Mn), By End Use Industry 2017-2022
TABLE 132 Mexico ESD Bags & Pouch Packaging Market Value (US$ Mn), By Application Type 2012-2016
TABLE 133 Mexico ESD Bags & Pouch Packaging Market Value (US$ Mn), By Application Type 2017-2022
TABLE 134 Argentina ESD Bags & Pouch Packaging Market Value (US$ Mn), By Material & Additive Type 2012-2016
TABLE 135 Argentina ESD Bags & Pouch Packaging Market Value (US$ Mn), By Material & Additive Type 2017-2022
TABLE 136 Argentina ESD Bags & Pouch Packaging Market Value (US$ Mn), By End Use Industry 2012-2016
TABLE 137 Argentina ESD Bags & Pouch Packaging Market Value (US$ Mn), By End Use Industry 2017-2022
TABLE 138 Argentina ESD Bags & Pouch Packaging Market Value (US$ Mn), By Application Type 2012-2016
TABLE 139 Argentina ESD Bags & Pouch Packaging Market Value (US$ Mn), By Application Type 2017-2022
TABLE 140 Germany ESD Bags & Pouch Packaging Market Value (US$ Mn), By Material & Additive Type 2012-2016
TABLE 141 Germany ESD Bags & Pouch Packaging Market Value (US$ Mn), By Material & Additive Type 2017-2022
TABLE 142 Germany ESD Bags & Pouch Packaging Market Value (US$ Mn), By End Use Industry 2012-2016
TABLE 143 Germany ESD Bags & Pouch Packaging Market Value (US$ Mn), By End Use Industry 2017-2022
TABLE 144 Germany ESD Bags & Pouch Packaging Market Value (US$ Mn), By Application Type 2012-2016
TABLE 145 Germany ESD Bags & Pouch Packaging Market Value (US$ Mn), By Application Type 2017-2022
TABLE 146 UK ESD Bags & Pouch Packaging Market Value (US$ Mn), By Material & Additive Type 2012-2016
TABLE 147 UK ESD Bags & Pouch Packaging Market Value (US$ Mn), By Material & Additive Type 2017-2022
TABLE 148 UK ESD Bags & Pouch Packaging Market Value (US$ Mn), By End Use Industry 2012-2016
TABLE 149 UK ESD Bags & Pouch Packaging Market Value (US$ Mn), By End Use Industry 2017-2022
TABLE 150 UK ESD Bags & Pouch Packaging Market Value (US$ Mn), By Application Type 2012-2016
TABLE 151 UK ESD Bags & Pouch Packaging Market Value (US$ Mn), By Application Type 2017-2022
TABLE 152 France ESD Bags & Pouch Packaging Market Value (US$ Mn), By Material & Additive Type 2012-2016
TABLE 153 France ESD Bags & Pouch Packaging Market Value (US$ Mn), By Material & Additive Type 2017-2022
TABLE 154 France ESD Bags & Pouch Packaging Market Value (US$ Mn), By End Use Industry 2012-2016
TABLE 155 France ESD Bags & Pouch Packaging Market Value (US$ Mn), By End Use Industry 2017-2022
TABLE 156 France ESD Bags & Pouch Packaging Market Value (US$ Mn), By Application Type 2012-2016
TABLE 157 France ESD Bags & Pouch Packaging Market Value (US$ Mn), By Application Type 2017-2022
TABLE 158 Spain ESD Bags & Pouch Packaging Market Value (US$ Mn), By Material & Additive Type 2012-2016
TABLE 159 Spain ESD Bags & Pouch Packaging Market Value (US$ Mn), By Material & Additive Type 2017-2022
TABLE 160 Spain ESD Bags & Pouch Packaging Market Value (US$ Mn), By End Use Industry 2012-2016
TABLE 161 Spain ESD Bags & Pouch Packaging Market Value (US$ Mn), By End Use Industry 2017-2022
TABLE 162 Spain ESD Bags & Pouch Packaging Market Value (US$ Mn), By Application Type 2012-2016
TABLE 163 Spain ESD Bags & Pouch Packaging Market Value (US$ Mn), By Application Type 2017-2022
TABLE 164 Italy ESD Bags & Pouch Packaging Market Value (US$ Mn), By Material & Additive Type 2012-2016
TABLE 165 Italy ESD Bags & Pouch Packaging Market Value (US$ Mn), By Material & Additive Type 2017-2022
TABLE 166 Italy ESD Bags & Pouch Packaging Market Value (US$ Mn), By End Use Industry 2012-2016
TABLE 167 Italy ESD Bags & Pouch Packaging Market Value (US$ Mn), By End Use Industry 2017-2022
TABLE 168 Italy ESD Bags & Pouch Packaging Market Value (US$ Mn), By Application Type 2012-2016
TABLE 169 Italy ESD Bags & Pouch Packaging Market Value (US$ Mn), By Application Type 2017-2022
TABLE 170 Russia ESD Bags & Pouch Packaging Market Value (US$ Mn), By Material & Additive Type 2012-2016
TABLE 171 Russia ESD Bags & Pouch Packaging Market Value (US$ Mn), By Material & Additive Type 2017-2022
TABLE 172 Russia ESD Bags & Pouch Packaging Market Value (US$ Mn), By End Use Industry 2012-2016
TABLE 173 Russia ESD Bags & Pouch Packaging Market Value (US$ Mn), By End Use Industry 2017-2022
TABLE 174 Russia ESD Bags & Pouch Packaging Market Value (US$ Mn), By Application Type 2012-2016
TABLE 175 Russia ESD Bags & Pouch Packaging Market Value (US$ Mn), By Application Type 2017-2022
TABLE 176 Japan ESD Bags & Pouch Packaging Market Value (US$ Mn), By Material & Additive Type 2012-2016
TABLE 177 Japan ESD Bags & Pouch Packaging Market Value (US$ Mn), By Material & Additive Type 2017-2022
TABLE 178 Japan ESD Bags & Pouch Packaging Market Value (US$ Mn), By End Use Industry 2012-2016
TABLE 179 Japan ESD Bags & Pouch Packaging Market Value (US$ Mn), By End Use Industry 2017-2022
TABLE 180 Japan ESD Bags & Pouch Packaging Market Value (US$ Mn), By Application Type 2012-2016
TABLE 181 Japan ESD Bags & Pouch Packaging Market Value (US$ Mn), By Application Type 2017-2022
TABLE 182 China ESD Bags & Pouch Packaging Market Value (US$ Mn), By Material & Additive Type 2012-2016
TABLE 183 China ESD Bags & Pouch Packaging Market Value (US$ Mn), By Material & Additive Type 2017-2022
TABLE 184 China ESD Bags & Pouch Packaging Market Value (US$ Mn), By End Use Industry 2012-2016
TABLE 185 China ESD Bags & Pouch Packaging Market Value (US$ Mn), By End Use Industry 2017-2022
TABLE 186 China ESD Bags & Pouch Packaging Market Value (US$ Mn), By Application Type 2012-2016
TABLE 187 China ESD Bags & Pouch Packaging Market Value (US$ Mn), By Application Type 2017-2022
TABLE 188 India ESD Bags & Pouch Packaging Market Value (US$ Mn), By Material & Additive Type 2012-2016
TABLE 189 India ESD Bags & Pouch Packaging Market Value (US$ Mn), By Material & Additive Type 2017-2022
TABLE 190 India ESD Bags & Pouch Packaging Market Value (US$ Mn), By End Use Industry 2012-2016
TABLE 191 India ESD Bags & Pouch Packaging Market Value (US$ Mn), By End Use Industry 2017-2022
TABLE 192 India ESD Bags & Pouch Packaging Market Value (US$ Mn), By Application Type 2012-2016
TABLE 193 India ESD Bags & Pouch Packaging Market Value (US$ Mn), By Application Type 2017-2022
TABLE 194 Malaysia ESD Bags & Pouch Packaging Market Value (US$ Mn), By Material & Additive Type 2012-2016
TABLE 195 Malaysia ESD Bags & Pouch Packaging Market Value (US$ Mn), By Material & Additive Type 2017-2022
TABLE 196 Malaysia ESD Bags & Pouch Packaging Market Value (US$ Mn), By End Use Industry 2012-2016
TABLE 197 Malaysia ESD Bags & Pouch Packaging Market Value (US$ Mn), By End Use Industry 2017-2022
TABLE 198 Malaysia ESD Bags & Pouch Packaging Market Value (US$ Mn), By Application Type 2012-2016
TABLE 199 Malaysia ESD Bags & Pouch Packaging Market Value (US$ Mn), By Application Type 2017-2022
TABLE 200 Thailand ESD Bags & Pouch Packaging Market Value (US$ Mn), By Material & Additive Type 2012-2016
TABLE 201 Thailand ESD Bags & Pouch Packaging Market Value (US$ Mn), By Material & Additive Type 2017-2022
TABLE 202 Thailand ESD Bags & Pouch Packaging Market Value (US$ Mn), By End Use Industry 2012-2016
TABLE 203 Thailand ESD Bags & Pouch Packaging Market Value (US$ Mn), By End Use Industry 2017-2022
TABLE 204 Thailand ESD Bags & Pouch Packaging Market Value (US$ Mn), By Application Type 2012-2016
TABLE 205 Thailand ESD Bags & Pouch Packaging Market Value (US$ Mn), By Application Type 2017-2022
TABLE 206 Singapore ESD Bags & Pouch Packaging Market Value (US$ Mn), By Material & Additive Type 2012-2016
TABLE 207 Singapore ESD Bags & Pouch Packaging Market Value (US$ Mn), By Material & Additive Type 2017-2022
TABLE 208 Singapore ESD Bags & Pouch Packaging Market Value (US$ Mn), By End Use Industry 2012-2016
TABLE 209 Singapore ESD Bags & Pouch Packaging Market Value (US$ Mn), By End Use Industry 2017-2022
TABLE 210 Singapore ESD Bags & Pouch Packaging Market Value (US$ Mn), By Application Type 2012-2016
TABLE 211 Singapore ESD Bags & Pouch Packaging Market Value (US$ Mn), By Application Type 2017-2022
TABLE 212 Australia ESD Bags & Pouch Packaging Market Value (US$ Mn), By Material & Additive Type 2012-2016
TABLE 213 Australia ESD Bags & Pouch Packaging Market Value (US$ Mn), By Material & Additive Type 2017-2022
TABLE 214 Australia ESD Bags & Pouch Packaging Market Value (US$ Mn), By End Use Industry 2012-2016
TABLE 215 Australia ESD Bags & Pouch Packaging Market Value (US$ Mn), By End Use Industry 2017-2022
TABLE 216 Australia ESD Bags & Pouch Packaging Market Value (US$ Mn), By Application Type 2012-2016
TABLE 217 Australia ESD Bags & Pouch Packaging Market Value (US$ Mn), By Application Type 2017-2022
TABLE 218 GCC Countries ESD Bags & Pouch Packaging Market Value (US$ Mn), By Material & Additive Type 2012-2016
TABLE 219 GCC Countries ESD Bags & Pouch Packaging Market Value (US$ Mn), By Material & Additive Type 2017-2022
TABLE 220 GCC Countries ESD Bags & Pouch Packaging Market Value (US$ Mn), By End Use Industry 2012-2016
TABLE 221 GCC Countries ESD Bags & Pouch Packaging Market Value (US$ Mn), By End Use Industry 2017-2022
TABLE 222 GCC Countries ESD Bags & Pouch Packaging Market Value (US$ Mn), By Application Type 2012-2016
TABLE 223 GCC Countries ESD Bags & Pouch Packaging Market Value (US$ Mn), By Application Type 2017-2022
TABLE 224 South Africa ESD Bags & Pouch Packaging Market Value (US$ Mn), By Material & Additive Type 2012-2016
TABLE 225 South Africa ESD Bags & Pouch Packaging Market Value (US$ Mn), By Material & Additive Type 2017-2022
TABLE 226 South Africa ESD Bags & Pouch Packaging Market Value (US$ Mn), By End Use Industry 2012-2016
TABLE 227 South Africa ESD Bags & Pouch Packaging Market Value (US$ Mn), By End Use Industry 2017-2022
TABLE 228 South Africa ESD Bags & Pouch Packaging Market Value (US$ Mn), By Application Type 2012-2016
TABLE 229 South Africa ESD Bags & Pouch Packaging Market Value (US$ Mn), By Application Type 2017-2022
TABLE 230 Nigeria ESD Bags & Pouch Packaging Market Value (US$ Mn), By Material & Additive Type 2012-2016
TABLE 231 Nigeria ESD Bags & Pouch Packaging Market Value (US$ Mn), By Material & Additive Type 2017-2022
TABLE 232 Nigeria ESD Bags & Pouch Packaging Market Value (US$ Mn), By End Use Industry 2012-2016
TABLE 233 Nigeria ESD Bags & Pouch Packaging Market Value (US$ Mn), By End Use Industry 2017-2022
TABLE 234 Nigeria ESD Bags & Pouch Packaging Market Value (US$ Mn), By Application Type 2012-2016
TABLE 235 Nigeria ESD Bags & Pouch Packaging Market Value (US$ Mn), By Application Type 2017-2022
TABLE 236 Israel ESD Bags & Pouch Packaging Market Value (US$ Mn), By Material & Additive Type 2012-2016
TABLE 237 Israel ESD Bags & Pouch Packaging Market Value (US$ Mn), By Material & Additive Type 2017-2022
TABLE 238 Israel ESD Bags & Pouch Packaging Market Value (US$ Mn), By End Use Industry 2012-2016
TABLE 239 Israel ESD Bags & Pouch Packaging Market Value (US$ Mn), By End Use Industry 2017-2022
TABLE 240 Israel ESD Bags & Pouch Packaging Market Value (US$ Mn), By Application Type 2012-2016
TABLE 241 Israel ESD Bags & Pouch Packaging Market Value (US$ Mn), By Application Type 2017-2022
List of Figures
FIG. 1 Global ESD Bags & Pouch Packaging Market Value (US$ Mn), 2012-2016
FIG. 2 Global ESD Bags & Pouch Packaging Market Value (US$ Mn) Forecast, 2017-2022
FIG. 3 Global ESD Bags & Pouch Packaging Market Value (US$ Mn) and Y-o-Y, 2015-2022
FIG. 4 Global Conductive & Dissipative Polymers Segment Market Value (US$ Mn) By Region, 2012-2016
FIG. 5 Global Conductive & Dissipative Polymers Segment Market Value (US$ Mn) By Region, 2017-2022
FIG. 6 Global Conductive & Dissipative Polymers Segment Y-o-Y Growth Rate, By Region, 2015-2022
FIG. 7 Global Metal Segment Market Value (US$ Mn) By Region, 2012-2016
FIG. 8 Global Metal Segment Market Value (US$ Mn) By Region, 2017-2022
FIG. 9 Global Metal Segment Y-o-Y Growth Rate, By Region, 2015-2022
FIG. 10 Global Additive Segment Market Value (US$ Mn) By Region, 2012-2016
FIG. 11 Global Additive Segment Market Value (US$ Mn) By Region, 2017-2022
FIG. 12 Global Additive Segment Y-o-Y Growth Rate, By Region, 2015-2022
FIG. 13 Global Electrical & Electronics Segment Market Value (US$ Mn) By Region, 2012-2016
FIG. 14 Global Electrical & Electronics Segment Market Value (US$ Mn) By Region, 2017-2022
FIG. 15 Global Electrical & Electronics Segment Y-o-Y Growth Rate, By Region, 2015-2022
FIG. 16 Global Automobile Segment Market Value (US$ Mn) By Region, 2012-2016
FIG. 17 Global Automobile Segment Market Value (US$ Mn) By Region, 2017-2022
FIG. 18 Global Automobile Segment Y-o-Y Growth Rate, By Region, 2015-2022
FIG. 19 Global Defense & Military Segment Market Value (US$ Mn) By Region, 2012-2016
FIG. 20 Global Defense & Military Segment Market Value (US$ Mn) By Region, 2017-2022
FIG. 21 Global Defense & Military Segment Y-o-Y Growth Rate, By Region, 2015-2022
FIG. 22 Global Manufacturing Segment Market Value (US$ Mn) By Region, 2012-2016
FIG. 23 Global Manufacturing Segment Market Value (US$ Mn) By Region, 2017-2022
FIG. 24 Global Manufacturing Segment Y-o-Y Growth Rate, By Region, 2015-2022
FIG. 25 Global Aerospace Segment Market Value (US$ Mn) By Region, 2012-2016
FIG. 26 Global Aerospace Segment Market Value (US$ Mn) By Region, 2017-2022
FIG. 27 Global Aerospace Segment Y-o-Y Growth Rate, By Region, 2015-2022
FIG. 28 Global Healthcare Segment Market Value (US$ Mn) By Region, 2012-2016
FIG. 29 Global Healthcare Segment Market Value (US$ Mn) By Region, 2017-2022
FIG. 30 Global Healthcare Segment Y-o-Y Growth Rate, By Region, 2015-2022
FIG. 31 Global Other End Use Industry Segment Market Value (US$ Mn) By Region, 2012-2016
FIG. 32 Global Other End Use Industry Segment Market Value (US$ Mn) By Region, 2017-2022
FIG. 33 Global Other End Use Industry Segment Y-o-Y Growth Rate, By Region, 2015-2022
FIG. 34 Global Electrical & Electronic Component Segment Market Value (US$ Mn) By Region, 2012-2016
FIG. 35 Global Electrical & Electronic Component Segment Market Value (US$ Mn) By Region, 2017-2022
FIG. 36 Global Electrical & Electronic Component Segment Y-o-Y Growth Rate, By Region, 2015-2022
FIG. 37 Global Explosive Powders Segment Market Value (US$ Mn) By Region, 2012-2016
FIG. 38 Global Explosive Powders Segment Market Value (US$ Mn) By Region, 2017-2022
FIG. 39 Global Explosive Powders Segment Y-o-Y Growth Rate, By Region, 2015-2022
FIG. 40 Global Drugs Segment Market Value (US$ Mn) By Region, 2012-2016
FIG. 41 Global Drugs Segment Market Value (US$ Mn) By Region, 2017-2022
FIG. 42 Global Drugs Segment Y-o-Y Growth Rate, By Region, 2015-2022
FIG. 43 Global Other Application Type Segment Market Value (US$ Mn) By Region, 2012-2016
FIG. 44 Global Other Application Type Segment Market Value (US$ Mn) By Region, 2017-2022
FIG. 45 Global Other Application Type Segment Y-o-Y Growth Rate, By Region, 2015-2022
FIG. 46 North America ESD Bags & Pouch Packaging Market Value (US$ Mn), By Material & Additive Type 2012-2016
FIG. 47 North America ESD Bags & Pouch Packaging Market Value (US$ Mn), By Material & Additive Type 2017-2022
FIG. 48 North America ESD Bags & Pouch Packaging Market Value (US$ Mn), By End Use Industry 2012-2016
FIG. 49 North America ESD Bags & Pouch Packaging Market Value (US$ Mn), By End Use Industry 2017-2022
FIG. 50 North America ESD Bags & Pouch Packaging Market Value (US$ Mn), By Application Type 2012-2016
FIG. 51 North America ESD Bags & Pouch Packaging Market Value (US$ Mn), By Application Type 2017-2022
FIG. 52 Latin America ESD Bags & Pouch Packaging Market Value (US$ Mn), By Material & Additive Type 2012-2016
FIG. 53 Latin America ESD Bags & Pouch Packaging Market Value (US$ Mn), By Material & Additive Type 2017-2022
FIG. 54 Latin America ESD Bags & Pouch Packaging Market Value (US$ Mn), By End Use Industry 2012-2016
FIG. 55 Latin America ESD Bags & Pouch Packaging Market Value (US$ Mn), By End Use Industry 2017-2022
FIG. 56 Latin America ESD Bags & Pouch Packaging Market Value (US$ Mn), By Application Type 2012-2016
FIG. 57 Latin America ESD Bags & Pouch Packaging Market Value (US$ Mn), By Application Type 2017-2022
FIG. 58 Europe ESD Bags & Pouch Packaging Market Value (US$ Mn), By Material & Additive Type 2012-2016
FIG. 59 Europe ESD Bags & Pouch Packaging Market Value (US$ Mn), By Material & Additive Type 2017-2022
FIG. 60 Europe ESD Bags & Pouch Packaging Market Value (US$ Mn), By End Use Industry 2012-2016
FIG. 61 Europe ESD Bags & Pouch Packaging Market Value (US$ Mn), By End Use Industry 2017-2022
FIG. 62 Europe ESD Bags & Pouch Packaging Market Value (US$ Mn), By Application Type 2012-2016
FIG. 63 Europe ESD Bags & Pouch Packaging Market Value (US$ Mn), By Application Type 2017-2022
FIG. 64 Japan ESD Bags & Pouch Packaging Market Value (US$ Mn), By Material & Additive Type 2012-2016
FIG. 65 Japan ESD Bags & Pouch Packaging Market Value (US$ Mn), By Material & Additive Type 2017-2022
FIG. 66 Japan ESD Bags & Pouch Packaging Market Value (US$ Mn), By End Use Industry 2012-2016
FIG. 67 Japan ESD Bags & Pouch Packaging Market Value (US$ Mn), By End Use Industry 2017-2022
FIG. 68 Japan ESD Bags & Pouch Packaging Market Value (US$ Mn), By Application Type 2012-2016
FIG. 69 Japan ESD Bags & Pouch Packaging Market Value (US$ Mn), By Application Type 2017-2022
FIG. 70 APEJ ESD Bags & Pouch Packaging Market Value (US$ Mn), By Material & Additive Type 2012-2016
FIG. 71 APEJ ESD Bags & Pouch Packaging Market Value (US$ Mn), By Material & Additive Type 2017-2022
FIG. 72 APEJ ESD Bags & Pouch Packaging Market Value (US$ Mn), By End Use Industry 2012-2016
FIG. 73 APEJ ESD Bags & Pouch Packaging Market Value (US$ Mn), By End Use Industry 2017-2022
FIG. 74 APEJ ESD Bags & Pouch Packaging Market Value (US$ Mn), By Application Type 2012-2016
FIG. 75 APEJ ESD Bags & Pouch Packaging Market Value (US$ Mn), By Application Type 2017-2022
FIG. 76 MEA ESD Bags & Pouch Packaging Market Value (US$ Mn), By Material & Additive Type 2012-2016
FIG. 77 MEA ESD Bags & Pouch Packaging Market Value (US$ Mn), By Material & Additive Type 2017-2022
FIG. 78 MEA ESD Bags & Pouch Packaging Market Value (US$ Mn), By End Use Industry 2012-2016
FIG. 79 MEA ESD Bags & Pouch Packaging Market Value (US$ Mn), By End Use Industry 2017-2022
FIG. 80 MEA ESD Bags & Pouch Packaging Market Value (US$ Mn), By Application Type 2012-2016
FIG. 81 MEA ESD Bags & Pouch Packaging Market Value (US$ Mn), By Application Type 2017-2022
Copyright © Transparency Market Research, Inc. All Rights reserved
Trust Online

ESD Bags & Pouch Packaging Market