
Reports
Reports
Remote Working Norms Spurring Growth of Endpoint Security Market
Endpoints are increasingly becoming points of cyberattacks. The shift to remote working, that is, work-from-home normal, has accelerated the need for a robust endpoint security. Endpoints are mainly comprised of laptops and tablets, mobile devices, internet of things (IoT), digital printers, point-of-sale systems.
Strides being made by IoT devices especially spurred by growing inclination to make smart homes are propelling the prospects of the endpoint security market. The losses arising out of data breaches are substantial each year and are rising year-over-year. The shift toward digitalization of business processes is a key driver of the endpoint security market. The points of intersection of machines and humans have increased considerably. According to an estimate, the losses accounted for data breaches were around 40% of the revenues.
The need for preventing file-based malware attacks is a key trend bolstering the demand for endpoint security market. Players in the market are expected to garner new revenue gains from prevalence of mail services and web apps. The growing demand for centrally managed security solutions for cloud computing is a key trend bolstering the prospects of the endpoint security market.
Over the past few decades, the growing trend of bring your own device (BYOD) in enterprises of all sizes is expected to impart a high momentum to the expansion of the endpoint security market. Growing popularity of a hybrid architecture design for endpoint security is a key trend bolstering the prospects of the endpoint security market. The growing adoption of threat hunting and endpoint detection and response (EDR) is expanding the avenue in the endpoint security market. Players are expanding the functionalities of endpoint security tools. A key instance is advancing managed threat hunting and threat intelligence integration features. The growing demand for endpoint security in hybrid cloud is a key driver for the global endpoint security market.
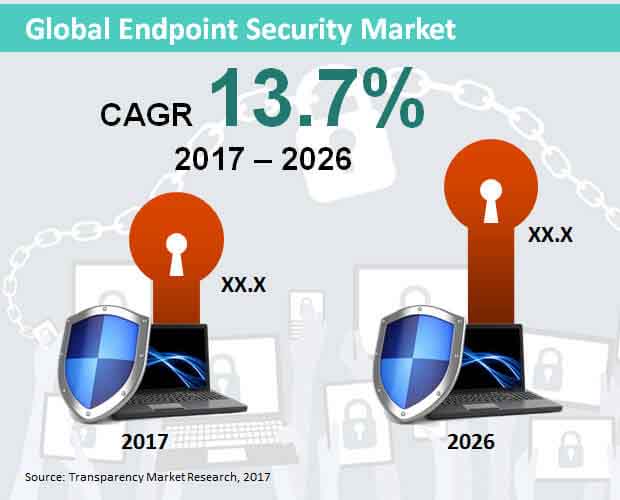
Global Endpoint Security Market: Snapshot
Would an increase in the number of connected devices such as laptops, tablets, phones, and other wireless devices used in corporate networks, that is an equally increase in the rise of security threats. Endpoint security is there for used for ensuring that these devices follow a definite set of compliance standards, thereby improving security period in endpoint security, computer networks are protected. The computer networks remote devices are protected by endpoint security. By 2026, the global endpoint security market is expected to generate revenue crossing US$40,000 mn. Key players operating within the market are as follows: Symantec, Intel, Cisco Systems, Kaspersky Lab, Trend Micro, Sophos, IBM Corporation, Webroot, F-Secure, and Microsoft Corporation.
Need to Prevent Cyber Attacks and Threats Driving Demand for Endpoint Security
With an increasing number of internet service providers getting attracted towards distributed architecture so as to prevent data tabs, many of the cyber-attacks related to endpoint systems are originating from interactions on the web as well as from peer-to-peer usage. These threats target a particular system and therefore the detection of threat as well as the elimination of threat becomes a very challenging process at the network level. This has resulted in many of the end-users adhering to endpoint security systems for preventing such threats. An important factor which is assisting the growth of this market is the need for compliance within government financial organizations which is in turn prompting users to adopt in point security solutions. A trend which can be witnessed within the global endpoint security market is the surgeon the demand for software-as-a-service based security solution since they are affordable, easy to install, and upgrade.
Demand Highest from Developed Regions of Europe and North America
On the basis of geography, the demand for endpoint security is from Europe and North America. This is because there is a high proliferation of high-speed internet services and mobile phones in these regions. In addition to this, both Europe and North America our house to several key players which offer Advanced Solutions for end use industries such as BFSI, automotive, and health care. Growth is also expected within the endpoint security marketing Asia-Pacific excluding Japan. In fact this region is anticipated to experience the fastest expansion rate during the forecast period. The growth of the market for endpoint Security in Asia-Pacific excluding Japan is attributed to the growing trend of bring your own device as well as the surge in the popularity of cloud computing. The increased mobility is also assisting the growth of this market.
Demand for Antivirus Tools Highest in Terms of Application
On the basis of application, it is the antivirus tools which is expected to generate the maximum revenue for endpoint security. This is because antivirus tools reduce the probability of infection in endpoints through threats such as rootkits, trojans, spyware, keyloggers, worms, adware, and viruses. The growing amount of crucial information sent over the network will boost the demand for antivirus tools further. In terms of venues industry, the BFSI and Healthcare as well as retail sectors will be most lucrative.
1. Global Economic Outlook
2. Global End Point Security Market - Executive Summary
3. Global End Point Security Market Overview
3.1. Introduction
3.1.1. Global End Point Security Market Taxonomy
3.1.2. Global End Point Security Market Definition
3.2. Global End Point Security Market Size (US$ Mn) and Forecast, 2012-2026
3.2.1. Global End Point Security Market Y-o-Y Growth
3.3. Global End Point Security Market Dynamics
3.4. End Point Security Vendor Offerings
3.5. Value Chain
3.6. PESTLE Analysis
3.7. PLC Analysis
3.8. Enterprise Security for Different End Point Solutions
3.9. Key Participants Market Presence (Intensity Map) By Region
4. Global End Point Security Market Analysis and Forecast 2012-2026
4.1. Global End Point Security Market Size and Forecast By Deployment Type, 2012-2026
4.1.1. On Premise Market Size and Forecast, 2012-2026
4.1.1.1. Revenue (US$ Mn) Comparison, By Region
4.1.1.2. Market Share Comparison, By Region
4.1.1.3. Y-o-Y growth Comparison, By Region
4.1.2. SaaS Market Size and Forecast, 2012-2026
4.1.2.1. Revenue (US$ Mn) Comparison, By Region
4.1.2.2. Market Share Comparison, By Region
4.1.2.3. Y-o-Y growth Comparison, By Region
4.2. Global End Point Security Market Size and Forecast By End User, 2012-2026
4.2.1. Large Enterprise Market Size and Forecast, 2012-2026
4.2.1.1. Revenue (US$ Mn) Comparison, By Region
4.2.1.2. Market Share Comparison, By Region
4.2.1.3. Y-o-Y growth Comparison, By Region
4.2.2. Small Enterprise Market Size and Forecast, 2012-2026
4.2.2.1. Revenue (US$ Mn) Comparison, By Region
4.2.2.2. Market Share Comparison, By Region
4.2.2.3. Y-o-Y growth Comparison, By Region
4.3. Global End Point Security Market Size and Forecast By Application, 2012-2026
4.3.1. Malware Detection Market Size and Forecast, 2012-2026
4.3.1.1. Revenue (US$ Mn) Comparison, By Region
4.3.1.2. Market Share Comparison, By Region
4.3.1.3. Y-o-Y growth Comparison, By Region
4.3.2. Anti virus Tools Market Size and Forecast, 2012-2026
4.3.2.1. Revenue (US$ Mn) Comparison, By Region
4.3.2.2. Market Share Comparison, By Region
4.3.2.3. Y-o-Y growth Comparison, By Region
4.3.3. Firewall Management Market Size and Forecast, 2012-2026
4.3.3.1. Revenue (US$ Mn) Comparison, By Region
4.3.3.2. Market Share Comparison, By Region
4.3.3.3. Y-o-Y growth Comparison, By Region
4.3.4. Web & Email Security Market Size and Forecast, 2012-2026
4.3.4.1. Revenue (US$ Mn) Comparison, By Region
4.3.4.2. Market Share Comparison, By Region
4.3.4.3. Y-o-Y growth Comparison, By Region
4.3.5. Patch Assessment Market Size and Forecast, 2012-2026
4.3.5.1. Revenue (US$ Mn) Comparison, By Region
4.3.5.2. Market Share Comparison, By Region
4.3.5.3. Y-o-Y growth Comparison, By Region
4.3.6. Other Applications Market Size and Forecast, 2012-2026
4.3.6.1. Revenue (US$ Mn) Comparison, By Region
4.3.6.2. Market Share Comparison, By Region
4.3.6.3. Y-o-Y growth Comparison, By Region
4.4. Global End Point Security Market Size and Forecast By Industry, 2012-2026
4.4.1. BFSI Market Size and Forecast, 2012-2026
4.4.1.1. Revenue (US$ Mn) Comparison, By Region
4.4.1.2. Market Share Comparison, By Region
4.4.1.3. Y-o-Y growth Comparison, By Region
4.4.2. Healthcare Market Size and Forecast, 2012-2026
4.4.2.1. Revenue (US$ Mn) Comparison, By Region
4.4.2.2. Market Share Comparison, By Region
4.4.2.3. Y-o-Y growth Comparison, By Region
4.4.4. Retail Market Size and Forecast, 2012-2026
4.4.4.1. Revenue (US$ Mn) Comparison, By Region
4.4.4.2. Market Share Comparison, By Region
4.4.4.3. Y-o-Y growth Comparison, By Region
4.4.4. Retail Market Size and Forecast, 2012-2026
4.4.4.1. Revenue (US$ Mn) Comparison, By Region
4.4.4.2. Market Share Comparison, By Region
4.4.4.3. Y-o-Y growth Comparison, By Region
4.4.5. Energy & Utilities Market Size and Forecast, 2012-2026
4.4.5.1. Revenue (US$ Mn) Comparison, By Region
4.4.5.2. Market Share Comparison, By Region
4.4.5.3. Y-o-Y growth Comparison, By Region
4.4.6. Manufacturing Market Size and Forecast, 2012-2026
4.4.6.1. Revenue (US$ Mn) Comparison, By Region
4.4.6.2. Market Share Comparison, By Region
4.4.6.3. Y-o-Y growth Comparison, By Region
4.4.7. Others Market Size and Forecast, 2012-2026
4.4.7.1. Revenue (US$ Mn) Comparison, By Region
4.4.7.2. Market Share Comparison, By Region
4.4.7.3. Y-o-Y growth Comparison, By Region
5. North America End Point Security Market Size and Forecast, 2012-2026
5.1. North America Outlook
5.2. North America Parent Market Outlook
5.3. North America Target Market Outlook
5.4. Revenue (US$ Mn) Comparison, By Country
5.4.1. US Market Size and Forecast (US$ Mn), 2012-2026
5.4.2. Canada Market Size and Forecast (US$ Mn), 2012-2026
5.5. Revenue (US$ Mn) Comparison, By Deployment Type
5.6. Revenue (US$ Mn) Comparison, By End User
5.7. Revenue (US$ Mn) Comparison, By Application
5.8. Revenue (US$ Mn) Comparison, By Industry
6. Latin America End Point Security Market Size and Forecast, 2012-2026
6.1. Latin America Outlook
6.2. Latin America Parent Market Outlook
6.3. Latin America Target Market Outlook
6.4. Revenue (US$ Mn) Comparison, By Country
6.4.1. Brazil Market Size and Forecast (US$ Mn), 2012-2026
6.4.2. Mexico Market Size and Forecast (US$ Mn), 2012-2026
6.4.3. Argentina Market Size and Forecast (US$ Mn), 2012-2026
6.5. Revenue (US$ Mn) Comparison, By Deployment Type
6.6. Revenue (US$ Mn) Comparison, By End User
6.7. Revenue (US$ Mn) Comparison, By Application
6.8. Revenue (US$ Mn) Comparison, By Industry
7. Europe End Point Security Market Size and Forecast, 2012-2026
7.1. Europe Outlook
7.2. Europe Parent Market Outlook
7.3. Europe Target Market Outlook
7.4. Revenue (US$ Mn) Comparison, By Country
7.4.1. Germany Market Size and Forecast (US$ Mn), 2012-2026
7.4.2. UK Market Size and Forecast (US$ Mn), 2012-2026
7.4.3. France Market Size and Forecast (US$ Mn), 2012-2026
7.4.4. Spain Market Size and Forecast (US$ Mn), 2012-2026
7.4.5. Italy Market Size and Forecast (US$ Mn), 2012-2026
7.4.6. Nordic Market Size and Forecast (US$ Mn), 2012-2026
7.5. Revenue (US$ Mn) Comparison, By Deployment Type
7.6. Revenue (US$ Mn) Comparison, By End User
7.7. Revenue (US$ Mn) Comparison, By Application
7.8. Revenue (US$ Mn) Comparison, By Industry
8. Japan End Point Security Market Size and Forecast, 2012-2026
8.1. Japan Outlook
8.2. Japan Parent Market Outlook
8.3. Japan Target Market Outlook
8.4. Revenue (US$ Mn) Comparison, By Country
8.4.1. Japan Market Size and Forecast (US$ Mn), 2012-2026
8.5. Revenue (US$ Mn) Comparison, By Deployment Type
8.6. Revenue (US$ Mn) Comparison, By End User
8.7. Revenue (US$ Mn) Comparison, By Application
8.8. Revenue (US$ Mn) Comparison, By Industry
9. APEJ End Point Security Market Size and Forecast, 2012-2026
9.1. APEJ Outlook
9.2. APEJ Parent Market Outlook
9.3. APEJ Target Market Outlook
9.4. Revenue (US$ Mn) Comparison, By Country
9.4.1. China Market Size and Forecast (US$ Mn), 2012-2026
9.4.2. India Market Size and Forecast (US$ Mn), 2012-2026
9.4.3. Malaysia Market Size and Forecast (US$ Mn), 2012-2026
9.4.4. Thailand Market Size and Forecast (US$ Mn), 2012-2026
9.4.5. Singapore Market Size and Forecast (US$ Mn), 2012-2026
9.4.6. Australia Market Size and Forecast (US$ Mn), 2012-2026
9.5. Revenue (US$ Mn) Comparison, By Deployment Type
9.6. Revenue (US$ Mn) Comparison, By End User
9.7. Revenue (US$ Mn) Comparison, By Application
9.8. Revenue (US$ Mn) Comparison, By Industry
10. MEA End Point Security Market Size and Forecast, 2012-2026
10.1. MEA Outlook
10.2. MEA Parent Market Outlook
10.3. MEA Target Market Outlook
10.4. Revenue (US$ Mn) Comparison, By Country
10.4.1. GCC Countries Market Size and Forecast (US$ Mn), 2012-2026
10.4.2. South Africa Market Size and Forecast (US$ Mn), 2012-2026
10.4.3. Nigeria Market Size and Forecast (US$ Mn), 2012-2026
10.4.4. Israel Market Size and Forecast (US$ Mn), 2012-2026
10.5. Revenue (US$ Mn) Comparison, By Deployment Type
10.6. Revenue (US$ Mn) Comparison, By End User
10.7. Revenue (US$ Mn) Comparison, By Application
10.8. Revenue (US$ Mn) Comparison, By Industry
11. Global End Point Security Market Company Share, Competition Landscape and Company Profiles
11.1. Company Share Analysis
11.2. Competition Landscape
11.3. Company Profiles
11.3.1. Symantec Corporation
11.3.2. Intel Corporation
11.3.3. Kaspersky Lab
11.3.4. Cisco Systems, Inc.
11.3.5. Trend Micro Incorporated
11.3.6. IBM Corporation
11.3.7. Sophos Group PLC
11.3.8. Webroot Inc.
11.3.9. Microsoft Corporation
11.3.10. F-Secure Corporation
12. Research Methodology
13. Secondary and Primary Sources
14. Assumptions and Acronyms
15. Disclaimer
List of Table
TABLE 1 Global End Point Security Market Value (US$ Mn), 2012-2017
TABLE 2 Global End Point Security Market Value (US$ Mn), 2018-2026
TABLE 3 Global End Point Security Market Value (US$ Mn) and Y-o-Y, 2017-2026
TABLE 4 Global On-Premises Segment Value (US$ Mn), By Region 2012-2017
TABLE 5 Global On-Premises Segment Value (US$ Mn), By Region 2018-2026
TABLE 6 Global On-Premises Segment Market Share, By Region 2012-2017
TABLE 7 Global On-Premises Segment Market Share, By Region 2018-2026
TABLE 8 Global On-Premises Segment Y-o-Y, By Region 2017-2026
TABLE 9 Global SaaS Segment Value (US$ Mn), By Region 2012-2017
TABLE 10 Global SaaS Segment Value (US$ Mn), By Region 2018-2026
TABLE 11 Global SaaS Segment Market Share, By Region 2012-2017
TABLE 12 Global SaaS Segment Market Share, By Region 2018-2026
TABLE 13 Global SaaS Segment Y-o-Y, By Region 2017-2026
TABLE 14 Global Large Enterprise Segment Value (US$ Mn), By Region 2012-2017
TABLE 15 Global Large Enterprise Segment Value (US$ Mn), By Region 2018-2026
TABLE 16 Global Large Enterprise Segment Market Share, By Region 2012-2017
TABLE 17 Global Large Enterprise Segment Market Share, By Region 2018-2026
TABLE 18 Global Large Enterprise Segment Y-o-Y, By Region 2017-2026
TABLE 19 Global Small & Medium Enterprise Segment Value (US$ Mn), By Region 2012-2017
TABLE 20 Global Small & Medium Enterprise Segment Value (US$ Mn), By Region 2018-2026
TABLE 21 Global Small & Medium Enterprise Segment Market Share, By Region 2012-2017
TABLE 22 Global Small & Medium Enterprise Segment Market Share, By Region 2018-2026
TABLE 23 Global Small & Medium Enterprise Segment Y-o-Y, By Region 2017-2026
TABLE 24 Global Malware Detection Segment Value (US$ Mn), By Region 2012-2017
TABLE 25 Global Malware Detection Segment Value (US$ Mn), By Region 2018-2026
TABLE 26 Global Malware Detection Segment Market Share, By Region 2012-2017
TABLE 27 Global Malware Detection Segment Market Share, By Region 2018-2026
TABLE 28 Global Malware Detection Segment Y-o-Y, By Region 2017-2026
TABLE 29 Global Antivirus Tools Segment Value (US$ Mn), By Region 2012-2017
TABLE 30 Global Antivirus Tools Segment Value (US$ Mn), By Region 2018-2026
TABLE 31 Global Antivirus Tools Segment Market Share, By Region 2012-2017
TABLE 32 Global Antivirus Tools Segment Market Share, By Region 2018-2026
TABLE 33 Global Antivirus Tools Segment Y-o-Y, By Region 2017-2026
TABLE 34 Global Firewall Management Segment Value (US$ Mn), By Region 2012-2017
TABLE 35 Global Firewall Management Segment Value (US$ Mn), By Region 2018-2026
TABLE 36 Global Firewall Management Segment Market Share, By Region 2012-2017
TABLE 37 Global Firewall Management Segment Market Share, By Region 2018-2026
TABLE 38 Global Firewall Management Segment Y-o-Y, By Region 2017-2026
TABLE 39 Global Web & Email Security Segment Value (US$ Mn), By Region 2012-2017
TABLE 40 Global Web & Email Security Segment Value (US$ Mn), By Region 2018-2026
TABLE 41 Global Web & Email Security Segment Market Share, By Region 2012-2017
TABLE 42 Global Web & Email Security Segment Market Share, By Region 2018-2026
TABLE 43 Global Web & Email Security Segment Y-o-Y, By Region 2017-2026
TABLE 44 Global Patch Assessment Segment Value (US$ Mn), By Region 2012-2017
TABLE 45 Global Patch Assessment Segment Value (US$ Mn), By Region 2018-2026
TABLE 46 Global Patch Assessment Segment Market Share, By Region 2012-2017
TABLE 47 Global Patch Assessment Segment Market Share, By Region 2018-2026
TABLE 48 Global Patch Assessment Segment Y-o-Y, By Region 2017-2026
TABLE 49 Global Other Applications Segment Value (US$ Mn), By Region 2012-2017
TABLE 50 Global Other Applications Segment Value (US$ Mn), By Region 2018-2026
TABLE 51 Global Other Applications Segment Market Share, By Region 2012-2017
TABLE 52 Global Other Applications Segment Market Share, By Region 2018-2026
TABLE 53 Global Other Applications Segment Y-o-Y, By Region 2017-2026
TABLE 54 Global BFSI Segment Value (US$ Mn), By Region 2012-2017
TABLE 55 Global BFSI Segment Value (US$ Mn), By Region 2018-2026
TABLE 56 Global BFSI Segment Market Share, By Region 2012-2017
TABLE 57 Global BFSI Segment Market Share, By Region 2018-2026
TABLE 58 Global BFSI Segment Y-o-Y, By Region 2017-2026
TABLE 59 Global Healthcare Segment Value (US$ Mn), By Region 2012-2017
TABLE 60 Global Healthcare Segment Value (US$ Mn), By Region 2018-2026
TABLE 61 Global Healthcare Segment Market Share, By Region 2012-2017
TABLE 62 Global Healthcare Segment Market Share, By Region 2018-2026
TABLE 63 Global Healthcare Segment Y-o-Y, By Region 2017-2026
TABLE 64 Global IT & Telecom Segment Value (US$ Mn), By Region 2012-2017
TABLE 65 Global IT & Telecom Segment Value (US$ Mn), By Region 2018-2026
TABLE 66 Global IT & Telecom Segment Market Share, By Region 2012-2017
TABLE 67 Global IT & Telecom Segment Market Share, By Region 2018-2026
TABLE 68 Global IT & Telecom Segment Y-o-Y, By Region 2017-2026
TABLE 69 Global Retail Segment Value (US$ Mn), By Region 2012-2017
TABLE 70 Global Retail Segment Value (US$ Mn), By Region 2018-2026
TABLE 71 Global Retail Segment Market Share, By Region 2012-2017
TABLE 72 Global Retail Segment Market Share, By Region 2018-2026
TABLE 73 Global Retail Segment Y-o-Y, By Region 2017-2026
TABLE 74 Global Energy & Utilities Segment Value (US$ Mn), By Region 2012-2017
TABLE 75 Global Energy & Utilities Segment Value (US$ Mn), By Region 2018-2026
TABLE 76 Global Energy & Utilities Segment Market Share, By Region 2012-2017
TABLE 77 Global Energy & Utilities Segment Market Share, By Region 2018-2026
TABLE 78 Global Energy & Utilities Segment Y-o-Y, By Region 2017-2026
TABLE 79 Global Manufacturing Segment Value (US$ Mn), By Region 2012-2017
TABLE 80 Global Manufacturing Segment Value (US$ Mn), By Region 2018-2026
TABLE 81 Global Manufacturing Segment Market Share, By Region 2012-2017
TABLE 82 Global Manufacturing Segment Market Share, By Region 2018-2026
TABLE 83 Global Manufacturing Segment Y-o-Y, By Region 2017-2026
TABLE 84 Global Others Segment Value (US$ Mn), By Region 2012-2017
TABLE 85 Global Others Segment Value (US$ Mn), By Region 2018-2026
TABLE 86 Global Others Segment Market Share, By Region 2012-2017
TABLE 87 Global Others Segment Market Share, By Region 2018-2026
TABLE 88 Global Others Segment Y-o-Y, By Region 2017-2026
TABLE 89 North America End Point Security Market Value (US$ Mn), By Country 2012-2017
TABLE 90 North America End Point Security Market Value (US$ Mn), By Country 2018-2026
TABLE 91 North America End Point Security Market Value (US$ Mn), By Deployment Type 2012-2017
TABLE 92 North America End Point Security Market Value (US$ Mn), By Deployment Type 2018-2026
TABLE 93 North America End Point Security Market Value (US$ Mn), By End User 2012-2017
TABLE 94 North America End Point Security Market Value (US$ Mn), By End User 2018-2026
TABLE 95 North America End Point Security Market Value (US$ Mn), By Applications 2012-2017
TABLE 96 North America End Point Security Market Value (US$ Mn), By Applications 2018-2026
TABLE 97 North America End Point Security Market Value (US$ Mn), By Industry 2012-2017
TABLE 98 North America End Point Security Market Value (US$ Mn), By Industry 2018-2026
TABLE 99 Latin America End Point Security Market Value (US$ Mn), By Country 2012-2017
TABLE 100 Latin America End Point Security Market Value (US$ Mn), By Country 2018-2026
TABLE 101 Latin America End Point Security Market Value (US$ Mn), By Deployment Type 2012-2017
TABLE 102 Latin America End Point Security Market Value (US$ Mn), By Deployment Type 2018-2026
TABLE 103 Latin America End Point Security Market Value (US$ Mn), By End User 2012-2017
TABLE 104 Latin America End Point Security Market Value (US$ Mn), By End User 2018-2026
TABLE 105 Latin America End Point Security Market Value (US$ Mn), By Applications 2012-2017
TABLE 106 Latin America End Point Security Market Value (US$ Mn), By Applications 2018-2026
TABLE 107 Latin America End Point Security Market Value (US$ Mn), By Industry 2012-2017
TABLE 108 Latin America End Point Security Market Value (US$ Mn), By Industry 2018-2026
TABLE 109 Europe End Point Security Market Value (US$ Mn), By Country 2012-2017
TABLE 110 Europe End Point Security Market Value (US$ Mn), By Country 2018-2026
TABLE 111 Europe End Point Security Market Value (US$ Mn), By Deployment Type 2012-2017
TABLE 112 Europe End Point Security Market Value (US$ Mn), By Deployment Type 2018-2026
TABLE 113 Europe End Point Security Market Value (US$ Mn), By End User 2012-2017
TABLE 114 Europe End Point Security Market Value (US$ Mn), By End User 2018-2026
TABLE 115 Europe End Point Security Market Value (US$ Mn), By Applications 2012-2017
TABLE 116 Europe End Point Security Market Value (US$ Mn), By Applications 2018-2026
TABLE 117 Europe End Point Security Market Value (US$ Mn), By Industry 2012-2017
TABLE 118 Europe End Point Security Market Value (US$ Mn), By Industry 2018-2026
TABLE 119 Japan End Point Security Market Value (US$ Mn), By Country 2012-2017
TABLE 120 Japan End Point Security Market Value (US$ Mn), By Country 2018-2026
TABLE 121 Japan End Point Security Market Value (US$ Mn), By Deployment Type 2012-2017
TABLE 122 Japan End Point Security Market Value (US$ Mn), By Deployment Type 2018-2026
TABLE 123 Japan End Point Security Market Value (US$ Mn), By End User 2012-2017
TABLE 124 Japan End Point Security Market Value (US$ Mn), By End User 2018-2026
TABLE 125 Japan End Point Security Market Value (US$ Mn), By Applications 2012-2017
TABLE 126 Japan End Point Security Market Value (US$ Mn), By Applications 2018-2026
TABLE 127 Japan End Point Security Market Value (US$ Mn), By Industry 2012-2017
TABLE 128 Japan End Point Security Market Value (US$ Mn), By Industry 2018-2026
TABLE 129 APEJ End Point Security Market Value (US$ Mn), By Country 2012-2017
TABLE 130 APEJ End Point Security Market Value (US$ Mn), By Country 2018-2026
TABLE 131 APEJ End Point Security Market Value (US$ Mn), By Deployment Type 2012-2017
TABLE 132 APEJ End Point Security Market Value (US$ Mn), By Deployment Type 2018-2026
TABLE 133 APEJ End Point Security Market Value (US$ Mn), By End User 2012-2017
TABLE 134 APEJ End Point Security Market Value (US$ Mn), By End User 2018-2026
TABLE 135 APEJ End Point Security Market Value (US$ Mn), By Applications 2012-2017
TABLE 136 APEJ End Point Security Market Value (US$ Mn), By Applications 2018-2026
TABLE 137 APEJ End Point Security Market Value (US$ Mn), By Industry 2012-2017
TABLE 138 APEJ End Point Security Market Value (US$ Mn), By Industry 2018-2026
TABLE 139 MEA End Point Security Market Value (US$ Mn), By Country 2012-2017
TABLE 140 MEA End Point Security Market Value (US$ Mn), By Country 2018-2026
TABLE 141 MEA End Point Security Market Value (US$ Mn), By Deployment Type 2012-2017
TABLE 142 MEA End Point Security Market Value (US$ Mn), By Deployment Type 2018-2026
TABLE 143 MEA End Point Security Market Value (US$ Mn), By End User 2012-2017
TABLE 144 MEA End Point Security Market Value (US$ Mn), By End User 2018-2026
TABLE 145 MEA End Point Security Market Value (US$ Mn), By Applications 2012-2017
TABLE 146 MEA End Point Security Market Value (US$ Mn), By Applications 2018-2026
TABLE 147 MEA End Point Security Market Value (US$ Mn), By Industry 2012-2017
TABLE 148 MEA End Point Security Market Value (US$ Mn), By Industry 2018-2026
List of Figure
FIG. 1 Global End Point Security Market Value (US$ Mn), 2012-2017
FIG. 2 Global End Point Security Market Value (US$ Mn) Forecast, 2018-2026
FIG. 3 Global End Point Security Market Value (US$ Mn) and Y-o-Y, 2017-2026
FIG. 4 Global On-Premises Segment Market Value (US$ Mn) By Region, 2012-2017
FIG. 5 Global On-Premises Segment Market Value (US$ Mn) By Region, 2018-2026
FIG. 6 Global On-Premises Segment Y-o-Y Growth Rate, By Region, 2017-2026
FIG. 7 Global SaaS Segment Market Value (US$ Mn) By Region, 2012-2017
FIG. 8 Global SaaS Segment Market Value (US$ Mn) By Region, 2018-2026
FIG. 9 Global SaaS Segment Y-o-Y Growth Rate, By Region, 2017-2026
FIG. 10 Global Large Enterprise Segment Market Value (US$ Mn) By Region, 2012-2017
FIG. 11 Global Large Enterprise Segment Market Value (US$ Mn) By Region, 2018-2026
FIG. 12 Global Large Enterprise Segment Y-o-Y Growth Rate, By Region, 2017-2026
FIG. 13 Global Small & Medium Enterprise Segment Market Value (US$ Mn) By Region, 2012-2017
FIG. 14 Global Small & Medium Enterprise Segment Market Value (US$ Mn) By Region, 2018-2026
FIG. 15 Global Small & Medium Enterprise Segment Y-o-Y Growth Rate, By Region, 2017-2026
FIG. 16 Global Malware Detection Segment Market Value (US$ Mn) By Region, 2012-2017
FIG. 17 Global Malware Detection Segment Market Value (US$ Mn) By Region, 2018-2026
FIG. 18 Global Malware Detection Segment Y-o-Y Growth Rate, By Region, 2017-2026
FIG. 19 Global Antivirus Tools Segment Market Value (US$ Mn) By Region, 2012-2017
FIG. 20 Global Antivirus Tools Segment Market Value (US$ Mn) By Region, 2018-2026
FIG. 21 Global Antivirus Tools Segment Y-o-Y Growth Rate, By Region, 2017-2026
FIG. 22 Global Firewall Management Segment Market Value (US$ Mn) By Region, 2012-2017
FIG. 23 Global Firewall Management Segment Market Value (US$ Mn) By Region, 2018-2026
FIG. 24 Global Firewall Management Segment Y-o-Y Growth Rate, By Region, 2017-2026
FIG. 25 Global Web & Email Security Segment Market Value (US$ Mn) By Region, 2012-2017
FIG. 26 Global Web & Email Security Segment Market Value (US$ Mn) By Region, 2018-2026
FIG. 27 Global Web & Email Security Segment Y-o-Y Growth Rate, By Region, 2017-2026
FIG. 28 Global Patch Assessment Segment Market Value (US$ Mn) By Region, 2012-2017
FIG. 29 Global Patch Assessment Segment Market Value (US$ Mn) By Region, 2018-2026
FIG. 30 Global Patch Assessment Segment Y-o-Y Growth Rate, By Region, 2017-2026
FIG. 31 Global Other Applications Segment Market Value (US$ Mn) By Region, 2012-2017
FIG. 32 Global Other Applications Segment Market Value (US$ Mn) By Region, 2018-2026
FIG. 33 Global Other Applications Segment Y-o-Y Growth Rate, By Region, 2017-2026
FIG. 34 Global BFSI Segment Market Value (US$ Mn) By Region, 2012-2017
FIG. 35 Global BFSI Segment Market Value (US$ Mn) By Region, 2018-2026
FIG. 36 Global BFSI Segment Y-o-Y Growth Rate, By Region, 2017-2026
FIG. 37 Global Healthcare Segment Market Value (US$ Mn) By Region, 2012-2017
FIG. 38 Global Healthcare Segment Market Value (US$ Mn) By Region, 2018-2026
FIG. 39 Global Healthcare Segment Y-o-Y Growth Rate, By Region, 2017-2026
FIG. 40 Global IT & Telecom Segment Market Value (US$ Mn) By Region, 2012-2017
FIG. 41 Global IT & Telecom Segment Market Value (US$ Mn) By Region, 2018-2026
FIG. 42 Global IT & Telecom Segment Y-o-Y Growth Rate, By Region, 2017-2026
FIG. 43 Global Retail Segment Market Value (US$ Mn) By Region, 2012-2017
FIG. 44 Global Retail Segment Market Value (US$ Mn) By Region, 2018-2026
FIG. 45 Global Retail Segment Y-o-Y Growth Rate, By Region, 2017-2026
FIG. 46 Global Energy & Utilities Segment Market Value (US$ Mn) By Region, 2012-2017
FIG. 47 Global Energy & Utilities Segment Market Value (US$ Mn) By Region, 2018-2026
FIG. 48 Global Energy & Utilities Segment Y-o-Y Growth Rate, By Region, 2017-2026
FIG. 49 Global Manufacturing Segment Market Value (US$ Mn) By Region, 2012-2017
FIG. 50 Global Manufacturing Segment Market Value (US$ Mn) By Region, 2018-2026
FIG. 51 Global Manufacturing Segment Y-o-Y Growth Rate, By Region, 2017-2026
FIG. 52 Global Others Segment Market Value (US$ Mn) By Region, 2012-2017
FIG. 53 Global Others Segment Market Value (US$ Mn) By Region, 2018-2026
FIG. 54 Global Others Segment Y-o-Y Growth Rate, By Region, 2017-2026
FIG. 55 North America End Point Security Market Value (US$ Mn), By Country 2012-2017
FIG. 56 North America End Point Security Market Value (US$ Mn), By Country 2018-2026
FIG. 57 North America End Point Security Market Value (US$ Mn), By Deployment Type 2012-2017
FIG. 58 North America End Point Security Market Value (US$ Mn), By Deployment Type 2018-2026
FIG. 59 North America End Point Security Market Value (US$ Mn), By End User 2012-2017
FIG. 60 North America End Point Security Market Value (US$ Mn), By End User 2018-2026
FIG. 61 North America End Point Security Market Value (US$ Mn), By Applications 2012-2017
FIG. 62 North America End Point Security Market Value (US$ Mn), By Applications 2018-2026
FIG. 63 North America End Point Security Market Value (US$ Mn), By Industry 2012-2017
FIG. 64 North America End Point Security Market Value (US$ Mn), By Industry 2018-2026
FIG. 65 Latin America End Point Security Market Value (US$ Mn), By Country 2012-2017
FIG. 66 Latin America End Point Security Market Value (US$ Mn), By Country 2018-2026
FIG. 67 Latin America End Point Security Market Value (US$ Mn), By Deployment Type 2012-2017
FIG. 68 Latin America End Point Security Market Value (US$ Mn), By Deployment Type 2018-2026
FIG. 69 Latin America End Point Security Market Value (US$ Mn), By End User 2012-2017
FIG. 70 Latin America End Point Security Market Value (US$ Mn), By End User 2018-2026
FIG. 71 Latin America End Point Security Market Value (US$ Mn), By Applications 2012-2017
FIG. 72 Latin America End Point Security Market Value (US$ Mn), By Applications 2018-2026
FIG. 73 Latin America End Point Security Market Value (US$ Mn), By Industry 2012-2017
FIG. 74 Latin America End Point Security Market Value (US$ Mn), By Industry 2018-2026
FIG. 75 Europe End Point Security Market Value (US$ Mn), By Country 2012-2017
FIG. 76 Europe End Point Security Market Value (US$ Mn), By Country 2018-2026
FIG. 77 Europe End Point Security Market Value (US$ Mn), By Deployment Type 2012-2017
FIG. 78 Europe End Point Security Market Value (US$ Mn), By Deployment Type 2018-2026
FIG. 79 Europe End Point Security Market Value (US$ Mn), By End User 2012-2017
FIG. 80 Europe End Point Security Market Value (US$ Mn), By End User 2018-2026
FIG. 81 Europe End Point Security Market Value (US$ Mn), By Applications 2012-2017
FIG. 82 Europe End Point Security Market Value (US$ Mn), By Applications 2018-2026
FIG. 83 Europe End Point Security Market Value (US$ Mn), By Industry 2012-2017
FIG. 84 Europe End Point Security Market Value (US$ Mn), By Industry 2018-2026
FIG. 85 Japan End Point Security Market Value (US$ Mn), By Country 2012-2017
FIG. 86 Japan End Point Security Market Value (US$ Mn), By Country 2018-2026
FIG. 87 Japan End Point Security Market Value (US$ Mn), By Deployment Type 2012-2017
FIG. 88 Japan End Point Security Market Value (US$ Mn), By Deployment Type 2018-2026
FIG. 89 Japan End Point Security Market Value (US$ Mn), By Applications 2012-2017
FIG. 90 Japan End Point Security Market Value (US$ Mn), By End User 2018-2026
FIG. 91 Japan End Point Security Market Value (US$ Mn), By Applications 2012-2017
FIG. 92 Japan End Point Security Market Value (US$ Mn), By Applications 2018-2026
FIG. 93 Japan End Point Security Market Value (US$ Mn), By Industry 2012-2017
FIG. 94 Japan End Point Security Market Value (US$ Mn), By Industry 2018-2026
FIG. 95 APEJ End Point Security Market Value (US$ Mn), By Country 2012-2017
FIG. 96 APEJ End Point Security Market Value (US$ Mn), By Country 2018-2026
FIG. 97 APEJ End Point Security Market Value (US$ Mn), By Deployment Type 2012-2017
FIG. 98 APEJ End Point Security Market Value (US$ Mn), By Deployment Type 2018-2026
FIG. 99 APEJ End Point Security Market Value (US$ Mn), By End User 2012-2017
FIG. 100 APEJ End Point Security Market Value (US$ Mn), By End User 2018-2026
FIG. 101 APEJ End Point Security Market Value (US$ Mn), By Applications 2012-2017
FIG. 102 APEJ End Point Security Market Value (US$ Mn), By Applications 2018-2026
FIG. 103 APEJ End Point Security Market Value (US$ Mn), By Industry 2012-2017
FIG. 104 APEJ End Point Security Market Value (US$ Mn), By Industry 2018-2026
FIG. 105 MEA End Point Security Market Value (US$ Mn), By Country 2012-2017
FIG. 106 MEA End Point Security Market Value (US$ Mn), By Country 2018-2026
FIG. 107 MEA End Point Security Market Value (US$ Mn), By Deployment Type 2012-2017
FIG. 108 MEA End Point Security Market Value (US$ Mn), By Deployment Type 2018-2026
FIG. 109 MEA End Point Security Market Value (US$ Mn), By End User 2012-2017
FIG. 110 MEA End Point Security Market Value (US$ Mn), By End User 2018-2026
FIG. 111 MEA End Point Security Market Value (US$ Mn), By Applications 2012-2017
FIG. 112 MEA End Point Security Market Value (US$ Mn), By Applications 2018-2026
FIG. 113 MEA End Point Security Market Value (US$ Mn), By Industry 2012-2017
FIG. 114 MEA End Point Security Market Value (US$ Mn), By Industry 2018-2026
Copyright © Transparency Market Research, Inc. All Rights reserved
Trust Online

Endpoint Security Market (Forecast 2017 - 2026)