
Reports
Reports
As the need for mechanical protection of insulated printed circuit boards continue to increase, manufacturers are looking for lucrative options for encapsulating electronic products. Significant environmental challenges including general contamination, vibration, moisture and physical or thermal shock can disrupt the functioning of the electronic components and the printed circuit boards. Growing need for protecting the printed circuit boards has led to surge in demand for the encapsulation resins globally. Application of resins encapsulates the entire device, which forms a complete barrier from extreme environment conditions in order to offer superior performance.
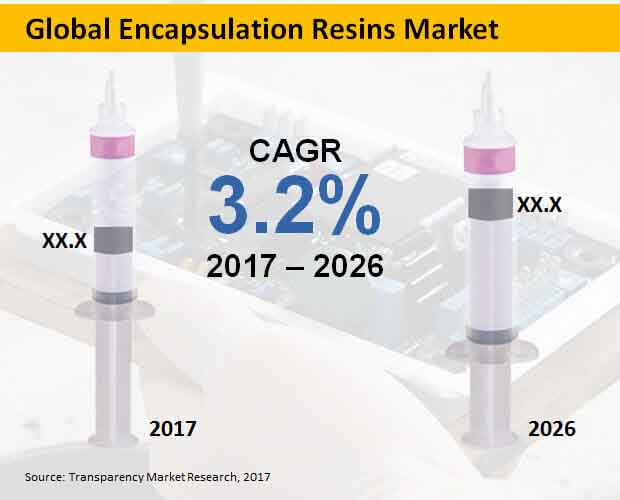
According to Transparency Market Research, the global market of encapsulation resins is expected to represent a value of over US$ 3,700 Mn by the end of 2026.
Electronic Industry to Impact Global Market Growth
With rapid expansion in the electronic industry, demand for the printed circuit boards in range of industrial, domestic, military and automotive products continues to increase. Growing need to ensure the dependability of critical devices has led the manufacturers to opt for the enhanced protective solutions such as encapsulation resins. Moreover, increasing number of potential requirements within the LED electronic products will further continue to rev up demand for the encapsulation resins in the electronic industry.
Application in Marine Products to Boost Sales
Growing need to protect the marine products from exposure to salt water is expected to boost sales of encapsulation resin products. Production of electronic devices for application in marine environment has led the manufacturers to focus on opting for innovative protection solutions such as epoxy resins. Manufacturers of the electronic devices for marine environment prefer using epoxy resins in order to protect the LED lights on the ship decks, under-water cable jointing and protection of sensor devices. These factors are expected to contribute towards the global market growth of encapsulation resins significantly during the forecast period.
Potting Compounds to Underscore Lucrative Growth Opportunities
As the need to protect the sensitive electronic components of products increases, manufacturers are focusing on implementing potting resins. Attributed to dielectric properties, thermal conductivity, mechanical strength, hardness, chemical resistance and shock resistance, preference for potting compounds will continue to remain high while manufacturing electronic products. Increasing production of electronic devices among the original equipment manufacturers is further expected to impact the global market growth of encapsulation resins positively.
Research and Development to Fuel Demand
Demand for the encapsulation resins is also expected to remain high attributed to surge in the research and development activities undertaken by the leading organizations and companies globally. Growing advancements in development of sensors for medical and research purposes has escalated demand for encapsulation resins. In order to offer enhanced and uninterrupted connectivity in the electronic products, manufacturers are focusing on developing innovative solutions such as smart passive sensors. Surge in demand for sensor products that offers prolonged services has led manufacturers of the electronic products to implement protective solutions such as encapsulating electronic components in resins. Moreover, as sensor devices translate the environmental and physical characteristics into electrical signal, demand for resins is expected to remain high.
Electronics & Electrical Components to Represent a Leading Segment
As the need to protect various electronic products against corrosion in the industrial environment arises, demand for epoxy resins is expected to remain high globally. On the basis of product type, the epoxy resins segment is expected to witness significant revenue growth, recording for a value of over US$ 1,000 Mn by the end of 2026. In contrary, the other resins product type segment is expected to register a robust CAGR during the forecast period.
Based on end use industries, the electronics & electrical components segment is expected to represent the highest revenue growth, accounting for a value of over US$ 900 Mn by the end of 2017. On the contrary, the others end use industries segment is expected to register a significant CAGR throughout the forecast period.
Competition Tracking
Leading market players operating in the global market of encapsulation resins include Shin-Etsu Chemical Co. Ltd., Fuji Chemical Industrial Co., Ltd., Master Bond Inc., H. B. Fuller Company, Huntsman Corporation, Hitachi Chemical, Henkel ag & co. kgaa, Dow Chemical Company and ACC Silicones Ltd., BASF.
1. Global Economic Outlook
2. Global Encapsulation Resins Market - Executive Summary
3. Global Encapsulation Resins Market Overview
3.1. Introduction
3.1.1. Global Encapsulation Resins Market Taxonomy
3.1.2. Global Encapsulation Resins Market Definition
3.2. Global Encapsulation Resins Market Size (US$ Mn) and Forecast, 2012-2026
3.2.1. Global Encapsulation Resins Market Y-o-Y Growth
3.3. Global Encapsulation Resins Market Dynamics
3.4. Supply Chain
3.5. Cost Structure
3.6. Pricing Analysis
3.7. PESTL Analysis
3.8. Product Life Cycle Analysis
3.9. Porter’s Five Force Analysis
3.10. List of Distributors
3.11. Key Participants Market Presence (Intensity Map) By Region
4. Global Encapsulation Resins Market Analysis and Forecast 2012-2026
4.1. Global Encapsulation Resins Market Size and Forecast By Resins Type, 2012-2026
4.1.1. Epoxy Resins Market Size and Forecast, 2012-2026
4.1.1.1. Revenue (US$ Mn) Comparison, By Region
4.1.1.2. Market Share Comparison, By Region
4.1.1.3. Y-o-Y growth Comparison, By Region
4.1.2. Polyurethane Resins Market Size and Forecast, 2012-2026
4.1.2.1. Revenue (US$ Mn) Comparison, By Region
4.1.2.2. Market Share Comparison, By Region
4.1.2.3. Y-o-Y growth Comparison, By Region
4.1.3. Silicone Resins Market Size and Forecast, 2012-2026
4.1.3.1. Revenue (US$ Mn) Comparison, By Region
4.1.3.2. Market Share Comparison, By Region
4.1.3.3. Y-o-Y growth Comparison, By Region
4.1.4. Others Resins Market Size and Forecast, 2012-2026
4.1.4.1. Revenue (US$ Mn) Comparison, By Region
4.1.4.2. Market Share Comparison, By Region
4.1.4.3. Y-o-Y growth Comparison, By Region
4.2. Global Encapsulation Resins Market Size and Forecast By End Use Industries, 2012-2026
4.2.1. Electronics & Electricals Components Market Size and Forecast, 2012-2026
4.2.1.1. Revenue (US$ Mn) Comparison, By Region
4.2.1.2. Market Share Comparison, By Region
4.2.1.3. Y-o-Y growth Comparison, By Region
4.2.2. Automotive Components Market Size and Forecast, 2012-2026
4.2.2.1. Revenue (US$ Mn) Comparison, By Region
4.2.2.2. Market Share Comparison, By Region
4.2.2.3. Y-o-Y growth Comparison, By Region
4.2.3. Telecommunication Components Market Size and Forecast, 2012-2026
4.2.3.1. Revenue (US$ Mn) Comparison, By Region
4.2.3.2. Market Share Comparison, By Region
4.2.3.3. Y-o-Y growth Comparison, By Region
4.2.4. Others Market Size and Forecast, 2012-2026
4.2.4.1. Revenue (US$ Mn) Comparison, By Region
4.2.4.2. Market Share Comparison, By Region
4.2.4.3. Y-o-Y growth Comparison, By Region
5. North America Encapsulation Resins Market Size and Forecast, 2012-2026
5.1. North America Outlook
5.2. North America Parent Market Outlook
5.3. North America Target Market Outlook
5.4. Revenue (US$ Mn) Comparison, By Country
5.4.1. US Market Size and Forecast (US$ Mn), 2012-2026
5.4.2. Canada Market Size and Forecast (US$ Mn), 2012-2026
5.5. Revenue (US$ Mn) Comparison, By Resins Type
5.6. Revenue (US$ Mn) Comparison, By End Use Industries
6. Latin America Encapsulation Resins Market Size and Forecast, 2012-2026
6.1. Latin America Outlook
6.2. Latin America Parent Market Outlook
6.3. Latin America Target Market Outlook
6.4. Revenue (US$ Mn) Comparison, By Country
6.4.1. Brazil Market Size and Forecast (US$ Mn), 2012-2026
6.4.2. Mexico Market Size and Forecast (US$ Mn), 2012-2026
6.4.3. Rest of Latin America Market Size and Forecast (US$ Mn), 2012-2026
6.5. Revenue (US$ Mn) Comparison, By Resins Type
6.6. Revenue (US$ Mn) Comparison, By End Use Industries
7. Europe Encapsulation Resins Market Size and Forecast, 2012-2026
7.1. Europe Outlook
7.2. Europe Parent Market Outlook
7.3. Europe Target Market Outlook
7.4. Revenue (US$ Mn) Comparison, By Country
7.4.1. Germany Market Size and Forecast (US$ Mn), 2012-2026
7.4.2. UK Market Size and Forecast (US$ Mn), 2012-2026
7.4.3. France Market Size and Forecast (US$ Mn), 2012-2026
7.4.4. Spain Market Size and Forecast (US$ Mn), 2012-2026
7.4.5. Italy Market Size and Forecast (US$ Mn), 2012-2026
7.4.6. Rest of Europe Market Size and Forecast (US$ Mn), 2012-2026
7.5. Revenue (US$ Mn) Comparison, By Resins Type
7.6. Revenue (US$ Mn) Comparison, By End Use Industries
8. Japan Encapsulation Resins Market Size and Forecast, 2012-2026
8.1. Japan Outlook
8.2. Japan Parent Market Outlook
8.3. Japan Target Market Outlook
8.4. Revenue (US$ Mn) Comparison, By Country
8.4.1. Japan Market Size and Forecast (US$ Mn), 2012-2026
8.5. Revenue (US$ Mn) Comparison, By Resins Type
8.6. Revenue (US$ Mn) Comparison, By End Use Industries
9. APEJ Encapsulation Resins Market Size and Forecast, 2012-2026
9.1. APEJ Outlook
9.2. APEJ Parent Market Outlook
9.3. APEJ Target Market Outlook
9.4. Revenue (US$ Mn) Comparison, By Country
9.4.1. China Market Size and Forecast (US$ Mn), 2012-2026
9.4.2. India Market Size and Forecast (US$ Mn), 2012-2026
9.4.3. South Korea Market Size and Forecast (US$ Mn), 2012-2026
9.4.4. Taiwan Market Size and Forecast (US$ Mn), 2012-2026
9.4.5. Singapore Market Size and Forecast (US$ Mn), 2012-2026
9.4.6. Australia Market Size and Forecast (US$ Mn), 2012-2026
9.5. Revenue (US$ Mn) Comparison, By Resins Type
9.6. Revenue (US$ Mn) Comparison, By End Use Industries
10. MEA Encapsulation Resins Market Size and Forecast, 2012-2026
10.1. MEA Outlook
10.2. MEA Parent Market Outlook
10.3. MEA Target Market Outlook
10.4. Revenue (US$ Mn) Comparison, By Country
10.4.1. GCC Countries Market Size and Forecast (US$ Mn), 2012-2026
10.4.2. South Africa Market Size and Forecast (US$ Mn), 2012-2026
10.4.3. Turkey Market Size and Forecast (US$ Mn), 2012-2026
10.4.4. Rest of MEA Market Size and Forecast (US$ Mn), 2012-2026
10.5. Revenue (US$ Mn) Comparison, By Resins Type
10.6. Revenue (US$ Mn) Comparison, By End Use Industries
11. Global Encapsulation Resins Market Company Share, Competition Landscape and Company Profiles
11.1. Company Share Analysis
11.2. Competition Landscape
11.3. Company Profiles
11.3.1. ACC Silicones Ltd.
11.3.2. BASF
11.3.3. Dow Chemical Company
11.3.4. Henkel ag & co. kgaa
11.3.5. Hitachi Chemical
11.3.6. Huntsman Corporation
11.3.7. H. B. Fuller Company
11.3.8. Master Bond Inc.
11.3.9. Fuji Chemical Industrial Co., Ltd.
11.3.10. Shin-Etsu Chemical Co. Ltd.
12. Research Methodology
13. Secondary and Primary Sources
14. Assumptions and Acronyms
15. Disclaimer
List of Tables
TABLE 1 Global Encapsulation Resins Market Value (US$ Mn), 2012-2017
TABLE 2 Global Encapsulation Resins Market Value (US$ Mn), 2018-2026
TABLE 3 Global Encapsulation Resins Market Value (US$ Mn) and Y-o-Y, 2017-2026
TABLE 4 Global Epoxy Resins Segment Value (US$ Mn), By Region 2012-2017
TABLE 5 Global Epoxy Resins Segment Value (US$ Mn), By Region 2018-2026
TABLE 6 Global Epoxy Resins Segment Market Share, By Region 2012-2017
TABLE 7 Global Epoxy Resins Segment Market Share, By Region 2018-2026
TABLE 8 Global Epoxy Resins Segment Y-o-Y, By Region 2017-2026
TABLE 9 Global Polyurethane Resins Segment Value (US$ Mn), By Region 2012-2017
TABLE 10 Global Polyurethane Resins Segment Value (US$ Mn), By Region 2018-2026
TABLE 11 Global Polyurethane Resins Segment Market Share, By Region 2012-2017
TABLE 12 Global Polyurethane Resins Segment Market Share, By Region 2018-2026
TABLE 13 Global Polyurethane Resins Segment Y-o-Y, By Region 2017-2026
TABLE 14 Global Silicone Resins Segment Value (US$ Mn), By Region 2012-2017
TABLE 15 Global Silicone Resins Segment Value (US$ Mn), By Region 2018-2026
TABLE 16 Global Silicone Resins Segment Market Share, By Region 2012-2017
TABLE 17 Global Silicone Resins Segment Market Share, By Region 2018-2026
TABLE 18 Global Silicone Resins Segment Y-o-Y, By Region 2017-2026
TABLE 19 Global Others Resins Segment Value (US$ Mn), By Region 2012-2017
TABLE 20 Global Others Resins Segment Value (US$ Mn), By Region 2018-2026
TABLE 21 Global Others Resins Segment Market Share, By Region 2012-2017
TABLE 22 Global Others Resins Segment Market Share, By Region 2018-2026
TABLE 23 Global Others Resins Segment Y-o-Y, By Region 2017-2026
TABLE 24 Global Electronics & Electricals Components Segment Value (US$ Mn), By Region 2012-2017
TABLE 25 Global Electronics & Electricals Components Segment Value (US$ Mn), By Region 2018-2026
TABLE 26 Global Electronics & Electricals Components Segment Market Share, By Region 2012-2017
TABLE 27 Global Electronics & Electricals Components Segment Market Share, By Region 2018-2026
TABLE 28 Global Electronics & Electricals Components Segment Y-o-Y, By Region 2017-2026
TABLE 29 Global Automotive Components Segment Value (US$ Mn), By Region 2012-2017
TABLE 30 Global Automotive Components Segment Value (US$ Mn), By Region 2018-2026
TABLE 31 Global Automotive Components Segment Market Share, By Region 2012-2017
TABLE 32 Global Automotive Components Segment Market Share, By Region 2018-2026
TABLE 33 Global Automotive Components Segment Y-o-Y, By Region 2017-2026
TABLE 34 Global Telecommunication Components Segment Value (US$ Mn), By Region 2012-2017
TABLE 35 Global Telecommunication Components Segment Value (US$ Mn), By Region 2018-2026
TABLE 36 Global Telecommunication Components Segment Market Share, By Region 2012-2017
TABLE 37 Global Telecommunication Components Segment Market Share, By Region 2018-2026
TABLE 38 Global Telecommunication Components Segment Y-o-Y, By Region 2017-2026
TABLE 39 Global Others Segment Value (US$ Mn), By Region 2012-2017
TABLE 40 Global Others Segment Value (US$ Mn), By Region 2018-2026
TABLE 41 Global Others Segment Market Share, By Region 2012-2017
TABLE 42 Global Others Segment Market Share, By Region 2018-2026
TABLE 43 Global Others Segment Y-o-Y, By Region 2017-2026
TABLE 44 North America Encapsulation Resins Market Value (US$ Mn), By Country 2012-2017
TABLE 45 North America Encapsulation Resins Market Value (US$ Mn), By Country 2018-2026
TABLE 46 North America Encapsulation Resins Market Value (US$ Mn), By Product Type 2012-2017
TABLE 47 North America Encapsulation Resins Market Value (US$ Mn), By Product Type 2018-2026
TABLE 48 North America Encapsulation Resins Market Value (US$ Mn), By End Use Industries 2012-2017
TABLE 49 North America Encapsulation Resins Market Value (US$ Mn), By End Use Industries 2018-2026
TABLE 50 Latin America Encapsulation Resins Market Value (US$ Mn), By Country 2012-2017
TABLE 51 Latin America Encapsulation Resins Market Value (US$ Mn), By Country 2018-2026
TABLE 52 Latin America Encapsulation Resins Market Value (US$ Mn), By Product Type 2012-2017
TABLE 53 Latin America Encapsulation Resins Market Value (US$ Mn), By Product Type 2018-2026
TABLE 54 Latin America Encapsulation Resins Market Value (US$ Mn), By End Use Industries 2012-2017
TABLE 55 Latin America Encapsulation Resins Market Value (US$ Mn), By End Use Industries 2018-2026
TABLE 56 Europe Encapsulation Resins Market Value (US$ Mn), By Country 2012-2017
TABLE 57 Europe Encapsulation Resins Market Value (US$ Mn), By Country 2018-2026
TABLE 58 Europe Encapsulation Resins Market Value (US$ Mn), By Product Type 2012-2017
TABLE 59 Europe Encapsulation Resins Market Value (US$ Mn), By Product Type 2018-2026
TABLE 60 Europe Encapsulation Resins Market Value (US$ Mn), By End Use Industries 2012-2017
TABLE 61 Europe Encapsulation Resins Market Value (US$ Mn), By End Use Industries 2018-2026
TABLE 62 Japan Encapsulation Resins Market Value (US$ Mn), By Country 2012-2017
TABLE 63 Japan Encapsulation Resins Market Value (US$ Mn), By Country 2018-2026
TABLE 64 Japan Encapsulation Resins Market Value (US$ Mn), By Product Type 2012-2017
TABLE 65 Japan Encapsulation Resins Market Value (US$ Mn), By Product Type 2018-2026
TABLE 66 Japan Encapsulation Resins Market Value (US$ Mn), By End Use Industries 2012-2017
TABLE 67 Japan Encapsulation Resins Market Value (US$ Mn), By End Use Industries 2018-2026
TABLE 68 APEJ Encapsulation Resins Market Value (US$ Mn), By Country 2012-2017
TABLE 69 APEJ Encapsulation Resins Market Value (US$ Mn), By Country 2018-2026
TABLE 70 APEJ Encapsulation Resins Market Value (US$ Mn), By Product Type 2012-2017
TABLE 71 APEJ Encapsulation Resins Market Value (US$ Mn), By Product Type 2018-2026
TABLE 72 APEJ Encapsulation Resins Market Value (US$ Mn), By End Use Industries 2012-2017
TABLE 73 APEJ Encapsulation Resins Market Value (US$ Mn), By End Use Industries 2018-2026
TABLE 74 MEA Encapsulation Resins Market Value (US$ Mn), By Country 2012-2017
TABLE 75 MEA Encapsulation Resins Market Value (US$ Mn), By Country 2018-2026
TABLE 76 MEA Encapsulation Resins Market Value (US$ Mn), By Product Type 2012-2017
TABLE 77 MEA Encapsulation Resins Market Value (US$ Mn), By Product Type 2018-2026
TABLE 78 MEA Encapsulation Resins Market Value (US$ Mn), By End Use Industries 2012-2017
TABLE 79 MEA Encapsulation Resins Market Value (US$ Mn), By End Use Industries 2018-2026
List of Figures
FIG. 1 Global Encapsulation Resins Market Value (US$ Mn), 2012-2017
FIG. 2 Global Encapsulation Resins Market Value (US$ Mn) Forecast, 2018-2026
FIG. 3 Global Encapsulation Resins Market Value (US$ Mn) and Y-o-Y, 2017-2026
FIG. 4 Global Epoxy Resins Segment Market Value (US$ Mn) By Region, 2012-2017
FIG. 5 Global Epoxy Resins Segment Market Value (US$ Mn) By Region, 2018-2026
FIG. 6 Global Epoxy Resins Segment Y-o-Y Growth Rate, By Region, 2017-2026
FIG. 7 Global Polyurethane Resins Segment Market Value (US$ Mn) By Region, 2012-2017
FIG. 8 Global Polyurethane Resins Segment Market Value (US$ Mn) By Region, 2018-2026
FIG. 9 Global Polyurethane Resins Segment Y-o-Y Growth Rate, By Region, 2017-2026
FIG. 10 Global Silicone Resins Segment Market Value (US$ Mn) By Region, 2012-2017
FIG. 11 Global Silicone Resins Segment Market Value (US$ Mn) By Region, 2018-2026
FIG. 12 Global Silicone Resins Segment Y-o-Y Growth Rate, By Region, 2017-2026
FIG. 13 Global Others Resins Segment Market Value (US$ Mn) By Region, 2012-2017
FIG. 14 Global Others Resins Segment Market Value (US$ Mn) By Region, 2018-2026
FIG. 15 Global Others Resins Segment Y-o-Y Growth Rate, By Region, 2017-2026
FIG. 16 Global Electronics & Electricals Components Segment Market Value (US$ Mn) By Region, 2012-2017
FIG. 17 Global Electronics & Electricals Components Segment Market Value (US$ Mn) By Region, 2018-2026
FIG. 18 Global Electronics & Electricals Components Segment Y-o-Y Growth Rate, By Region, 2017-2026
FIG. 19 Global Automotive Components Segment Market Value (US$ Mn) By Region, 2012-2017
FIG. 20 Global Automotive Components Segment Market Value (US$ Mn) By Region, 2018-2026
FIG. 21 Global Automotive Components Segment Y-o-Y Growth Rate, By Region, 2017-2026
FIG. 22 Global Telecommunication Components Segment Market Value (US$ Mn) By Region, 2012-2017
FIG. 23 Global Telecommunication Components Segment Market Value (US$ Mn) By Region, 2018-2026
FIG. 24 Global Telecommunication Components Segment Y-o-Y Growth Rate, By Region, 2017-2026
FIG. 25 Global Others Segment Market Value (US$ Mn) By Region, 2012-2017
FIG. 26 Global Others Segment Market Value (US$ Mn) By Region, 2018-2026
FIG. 27 Global Others Segment Y-o-Y Growth Rate, By Region, 2017-2026
FIG. 28 North America Encapsulation Resins Market Value (US$ Mn), By Country 2012-2017
FIG. 29 North America Encapsulation Resins Market Value (US$ Mn), By Country 2018-2026
FIG. 30 North America Encapsulation Resins Market Value (US$ Mn), By Product Type 2012-2017
FIG. 31 North America Encapsulation Resins Market Value (US$ Mn), By Product Type 2018-2026
FIG. 32 North America Encapsulation Resins Market Value (US$ Mn), By End Use Industries 2012-2017
FIG. 33 North America Encapsulation Resins Market Value (US$ Mn), By End Use Industries 2018-2026
FIG. 34 Latin America Encapsulation Resins Market Value (US$ Mn), By Country 2012-2017
FIG. 35 Latin America Encapsulation Resins Market Value (US$ Mn), By Country 2018-2026
FIG. 36 Latin America Encapsulation Resins Market Value (US$ Mn), By Product Type 2012-2017
FIG. 37 Latin America Encapsulation Resins Market Value (US$ Mn), By Product Type 2018-2026
FIG. 38 Latin America Encapsulation Resins Market Value (US$ Mn), By End Use Industries 2012-2017
FIG. 39 Latin America Encapsulation Resins Market Value (US$ Mn), By End Use Industries 2018-2026
FIG. 40 Europe Encapsulation Resins Market Value (US$ Mn), By Country 2012-2017
FIG. 41 Europe Encapsulation Resins Market Value (US$ Mn), By Country 2018-2026
FIG. 42 Europe Encapsulation Resins Market Value (US$ Mn), By Product Type 2012-2017
FIG. 43 Europe Encapsulation Resins Market Value (US$ Mn), By Product Type 2018-2026
FIG. 44 Europe Encapsulation Resins Market Value (US$ Mn), By End Use Industries 2012-2017
FIG. 45 Europe Encapsulation Resins Market Value (US$ Mn), By End Use Industries 2018-2026
FIG. 46 Japan Encapsulation Resins Market Value (US$ Mn), By Country 2012-2017
FIG. 47 Japan Encapsulation Resins Market Value (US$ Mn), By Country 2018-2026
FIG. 48 Japan Encapsulation Resins Market Value (US$ Mn), By Product Type 2012-2017
FIG. 49 Japan Encapsulation Resins Market Value (US$ Mn), By Product Type 2018-2026
FIG. 50 Japan Encapsulation Resins Market Value (US$ Mn), By 2012-2017
FIG. 51 Japan Encapsulation Resins Market Value (US$ Mn), By End Use Industries 2018-2026
FIG. 52 APEJ Encapsulation Resins Market Value (US$ Mn), By Country 2012-2017
FIG. 53 APEJ Encapsulation Resins Market Value (US$ Mn), By Country 2018-2026
FIG. 54 APEJ Encapsulation Resins Market Value (US$ Mn), By Product Type 2012-2017
FIG. 55 APEJ Encapsulation Resins Market Value (US$ Mn), By Product Type 2018-2026
FIG. 56 APEJ Encapsulation Resins Market Value (US$ Mn), By End Use Industries 2012-2017
FIG. 57 APEJ Encapsulation Resins Market Value (US$ Mn), By End Use Industries 2018-2026
FIG. 58 MEA Encapsulation Resins Market Value (US$ Mn), By Country 2012-2017
FIG. 59 MEA Encapsulation Resins Market Value (US$ Mn), By Country 2018-2026
FIG. 60 MEA Encapsulation Resins Market Value (US$ Mn), By Product Type 2012-2017
FIG. 61 MEA Encapsulation Resins Market Value (US$ Mn), By Product Type 2018-2026
FIG. 62 MEA Encapsulation Resins Market Value (US$ Mn), By End Use Industries 2012-2017
FIG. 63 MEA Encapsulation Resins Market Value (US$ Mn), By End Use Industries 2018-2026
Copyright © Transparency Market Research, Inc. All Rights reserved
Trust Online

Encapsulation Resins Market