
Reports
Reports
North America Drywall Textures Market: Snapshot
The expansion of the residential and commercial construction industries and the growth of the home improvement industry have boosted the demand for drywall textures in the North America. The housing market in the U.S. has been expanding at a steady pace, driven by a low supply of existing homes, higher prospects of jobs, and rise in incomes. According to the U.S. Census Bureau and the Department of Housing and Urban Development, the number of privately owned housing constructions in June 2016 increased by 18.9%. This growth of the housing market has had a positive impact on the North America drywall textures market.
The drywall textures market in North America was valued at US$741.1 mn in 2014 and is projected to reach US$1.0 bn by 2024, expanding at a CAGR of 4.5% therein. In terms of volume, the market is expected to register a CAGR of 3.8% during the forecast period.
Stringent Building Codes Drive Installation of Fire-resistant Drywalls
By product, regular drywall and fire-resistant drywall collectively accounted more than half the North America market in 2015. Currently, regular drywall dominates the North America drywall textures market, holding a 37% share in 2015. Regular drywall is used in applications that involve direct mechanical attachment to ceiling frames and metal walls or attachment to surfaces using adhesives. The demand for fire-resistant drywall can be attributed to the implementation of local building codes pertaining to residential spaces in North America. These codes mandate the installation of fire-rated drywall on interior and exterior walls near furnaces and utility rooms. Fire-resistant drywall is also commonly used for commercial and multi-family construction, where fire-rating is required.
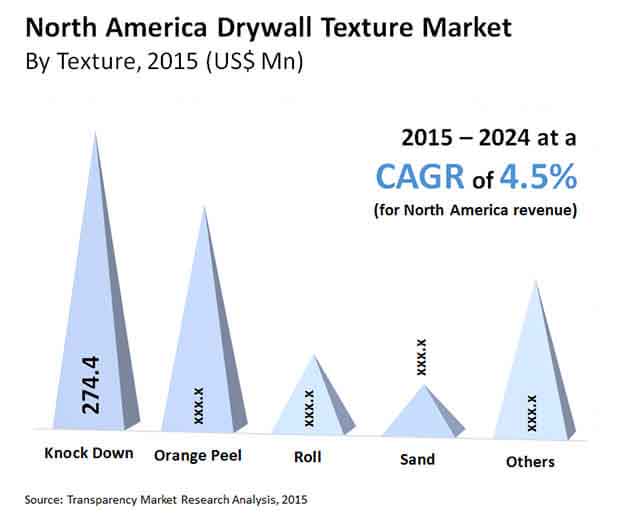
By texture, knockdown and orange peel collectively accounted for 65% of the North America drywall textures market in terms of revenue in 2015. Knockdown textures are estimated to form the most attractive segment during the forecast period as they are increasingly popular in many towns and cities across the U.S.
U.S. Emerges as Leading Market for Drywall Textures in North America
In terms of volume, the U.S. has been the leading market for drywall textures, followed by Canada. Accounting for 75% of the North America market in 2015, the U.S drywall textures market is likely to expand at a steady pace due to the rising demand for the same in building and construction applications. The demand for regular drywall has been comparatively high in the U.S. market by product and this segment is likely to expand at a steady rate from 2016 to 2024. By mud, topping joint compounds held the leading share in this country-specific market for drywall textures. Registering a high CAGR of 4.8% during the course of the forecast period, the knockdown segment of the U.S. drywall textures market by texture is also the most prominent category in terms of revenue. The residential sector in the U.S. has been the leading end user of drywall textures, while walls form the dominant application segment in the country.
Key players operating in the North America drywall textures market include Graco Inc., 3M, Knauf Gips KG, The Sherwin-Williams Company, USG Corporation, Artisan Textures and Drywall, Inc., Muddy Boys, Inc, PABCO Gypsum, Hamilton Drywall Products, LS Drywall Inc., and Shikoku International Corporation.
Strides in Urban Development Drive Demand for Advanced Formulations in North America Drywall Textures Market
Drywall textures are used as finishing of interior wall surfaces, and are used popularly to cover imperfections. Over the years, the North America drywall textures market has witnessed strides notably in relation to new products and formulations. They have been extensively demanded in aligning with rental flats and homes to not just cover imperfections but also give an interesting feel that can merge with different décor choices. Growing use of drywall textures in DIY application mode has helped spurred the sales in the North America drywall textures market. New types of drywall textures are used to cover minor imperfections and add a rough elegance. The demand has thrived on the back of ceaseless urban development. The prospects in the regional market have been increasingly enriched by the advent of spray drywall textures. The advent of specialized spray nozzles that help end users impart unique textures has boosted demand in the market. Technological advancements in the application equipment have allowed users to achieve a uniform drywall texture. Growing use of products in finishing drywall walls and ceilings has also broadened the application area. The growing number of methods and machinery used for matching drywall texture has expanded the canvas for companies in the regional market.
The COVID-19 pandemic has led to several disruptions in the macroeconomic and microeconomic dynamics. The supply chain of raw and processed materials from factories or warehouses have been severely hampered over the past few months, since the WHO announced it as a pandemic in 2020. The subsequent economic downturns led to decline in consumer optimism in various businesses across industries. The morbidity was substantial also in parts of North America with the cases rising at alarming rate in the U.S. and Canada in the last quarter of 2020. Governments had to suspend the movement of labor and materials. All these developments have increasingly impacted the demand and consumption volumes in the North America drywall textures market.
Chapter 1 Preface
1.1 Report Scope and Market Segmentation
1.2 Research Highlights
Chapter 2 Assumptions and Research Methodology
2.1 Assumptions and Acronyms Used
2.2 Research Methodology
Chapter 3 Executive Summary
3.1 North America Drywall Textures Market By Market Value (US$ Mn) and Market Value Share by Country
3.2 Key Trends
Chapter 4 Market Overview
4.1 Product Overview
4.2 Key Industry Developments
4.3 Market Indicators
4.4 Driver and Restraint Snapshot Analysis
4.4.1 Drivers
4.4.2 Restraints
4.4.3 Opportunity Analysis
4.4.4 Porter's Five Forces Analysis
4.5 Value Chain Analysis
4.5.1 Threat of New Entrants
4.5.2 Threat of Substitutes
4.5.3 Degree of Competition
4.5.4 Threat of Suppliers
4.5.5 Threat of Buyers
4.5.6 Degree of Competition
4.5.7 Value Chain Analysis
Chapter 5 North America Drywall Texture Market Analysis and Forecast
5.1 Key Findings
5.2 Key Trends
5.3 North America Drywall Texture Market Analysis and Forecasts, 2015–2024
Chapter 6 North America Drywall Texture Market Analysis by Product, 2015-2024
6.1 Introduction
6.2 Product Comparison
6.3North America Drywall Texture Market Value Share Analysis by Product Type
6.4 Drywall Texture Market Analysis by Product
6.5 Drywall Texture Market Attractiveness Analysis by Product Type
Chapter 7 North America Drywall Texture Market Analysis by Mud, 2015-2024
7.1 Introduction
7.2 North America Drywall Texture Market Value Share Analysis by Mud type
7.3 Drywall Texture Market Analysis by Mud
7.4 Drywall Texture Market Attractiveness Analysis by Mud Type
Chapter 8 North America Drywall Texture Market Analysis by Texture, 2015-2024
8.1 Introduction
8.2 North America Drywall Texture Market Value Share Analysis by Texture type
8.3 Drywall Texture Market Analysis by Texture
8.4 Drywall Texture Market Attractiveness Analysis by Texture Type
8.5 Drywall Texture Equipment and Aerosol Spray Textures
Chapter 9 North America Drywall Texture Market Analysis by Application, 2015-2024
9.1 North America Drywall Texture Market Value Share Analysis by Application type
9.2 Drywall Texture Market Analysis by Application
Chapter 10 North America Drywall Texture Market Analysis by End User, 2015-2024
10.1 North America Drywall Texture Market Value Share Analysis by End User
10.2 North America Drywall Texture Market Value Share Analysis by Residential Type
10.3 North America Drywall Texture Market Analysis by End User
Chapter 11North America Drywall Texture Market Analysis by Country, 2015-2024
11.1 U.S. Drywall Texture Market Analysis by Product
11.2 U.S. Drywall Texture Market Analysis by Mud
11.3 U.S. Drywall Texture Market Analysis by Texture
11.4 U.S. Drywall Texture Market Analysis by Application
11.5 U.S. Drywall Texture Market Analysis by End-user
11.6 Canada Drywall Texture Market Analysis by Product
11.7 Canada Drywall Texture Market Analysis by Mud
11.8 Canada Drywall Texture Market Analysis by Texture
11.9 Canada Drywall Texture Market Analysis by Application
11.10 Canada Drywall Texture Market Analysis by End-user
Chapter 12 Company Profiles
12.1 North America Drywall Texture Market Share Analysis by Company (2015)
12.2 Competition Matrix
12.3 Graco Inc.
12.3.1 Company Description
12.3.2 Business Overview
12.3.3 SWOT Analysis
12.3.4 Financial Details
12.3.5Strategic Overview
12.4 3M
12.4.1 Company Description
12.4.2 Business Overview
12.4.3 SWOT Analysis
12.4.4 Financial Details
12.4.5 Strategic Overview
12.5 Knauf Gips KG
12.5.1 Company Description
12.5.2Business Overview
12.5.3 SWOT Analysis
12.5.4 Financial Details
12.5.5Strategic Overview
12.6 The Sherwin-Williams Company
12.6.1 Company Description
12.6.2 Business Overview
12.6.3 SWOT Analysis
12.6.4 Financial Details
12.6.5 Strategic Overview
12.7 USG Corporation
12.7.1 Company Description
12.7.2 Business Overview
12.7.3 SWOT Analysis
12.7.4 Financial Details
12.7.5 Strategic Overview
12.8 Artisan Textures and Drywall, Inc.
12.8.1 Company Description
12.8.2Business Overview
12.8.3 SWOT Analysis
12.8.4 Financial Details
12.8.5 Strategic Overview
12.9 Muddy Boys, Inc
12.9.1 Company Description
12.9.2 Business Overview
12.9.3 SWOT Analysis
12.9.4 Recent Developments
12.9.5 Strategic Overview
12.10 PABCO Gypsum
12.10.1 Company Description
12.10.2 Business Overview
12.10.3 SWOT Analysis
12.10.4 Recent Developments
12.10.5Strategic Overview
12.11 Hamilton Drywall Products
12.11.1 Company Description
12.11.2 Business Overview
12.11.3 Strategic Overview
12.12 LS Drywall Inc
12.12.1 Company Description
12.12.2 Business Overview
12.12.3 Strategic Overview
12.13 Shikoku International Corporation
12.13.1 Company Description
12.13.2 Business Overview
12.13.3 Strategic Overview
Chapter 13 Key Takeaways
List of Figures
Figure 1: North America Drywall Texture Market Size (US$ Mn) and Volume (Mn Sq.Mtr) Forecast, 2015–2024
Figure 2: North America Drywall Texture Average Price (US$/Per Square Meter) 2015–2024
Figure 3: North America Drywall Texture Market Value Share Analysis by Product Type, 2016 and 2024
Figure 4: Regular Drywall Market, 2015 – 2024 (Mn Sq.Mtr) (US$ Mn)
Figure 5: Moisture Resistant Drywall Market, 2015 – 2024 (Mn Sq.Mtr) (US$ Mn)
Figure 6: Fire Resistant Drywall Market, 2015 – 2024 (Mn Sq.Mtr) (US$ Mn)
Figure 7: Others Market, 2015 – 2024 (Mn Sq.Mtr) (US$ Mn)
Figure 8: Drywall Texture Market Attractiveness Analysis by Product Type
Figure 9: North America Drywall Texture Market Value Share Analysis by Mud Type, 2015 and 2024
Figure 10: Topping Joint Compound Market, 2015 – 2024 (Mn Sq.Mtr) (US$ Mn)
Figure 11: All Purpose Joint Compound Market, 2015 – 2024 (Mn Sq.Mtr) (US$ Mn)
Figure 12: Others Market, 2015 – 2024 (Mn Sq.Mtr) (US$ Mn)
Figure 13: Drywall Texture Market Attractiveness Analysis by Product Type
Figure 14: North America Drywall Texture Market Value Share Analysis by Texture Type, 2016 and 2024
Figure 15: Knockdown Texture Market, 2015 – 2024 (Mn Sq.Mtr) (US$ Mn)
Figure 16: Orange Peel Texture Market, 2015 – 2024 (Mn Sq.Mtr) (US$ Mn)
Figure 17: Roll Texture Market, 2015 – 2024 (Mn Sq.Mtr) (US$ Mn)
Figure 18: Sand Texture Market, 2015 – 2024 (Mn Sq.Mtr) (US$ Mn)
Figure 19: Others Market, 2015 – 2024 (Mn Sq.Mtr) (US$ Mn)
Figure 20: Drywall Texture Market Attractiveness Analysis by Texture Type
Figure 21: North America Drywall Texture Market Value Share Analysis by Aerosol Spray Texture Type, 2015
Figure 22: North America Drywall Texture Market Value Share Analysis by Application, 2016 and 2024
Figure 23: Drywall Texture Market for Walls, 2015 – 2024 (Mn Sq.Mtr) (US$ Mn)
Figure 24: Drywall Texture Market for Ceilings, 2015 – 2024 (Mn Sq.Mtr) (US$ Mn)
Figure 25: Drywall Texture Market for Others, 2015 – 2024 (Mn Sq.Mtr) (US$ Mn)
Figure 26: North America Drywall Texture Market Value Share Analysis by End User, 2015 and 2024
Figure 27: North America Drywall Texture Market Value Share Analysis by Residential Type, 2015 and 2024
Figure 28: Drywall Texture Market for Residential Construction, 2015 – 2024 (Mn Sq.Mtr) (US$ Mn)
Figure 29: Drywall Texture Market for Commercial Construction, 2015 – 2024 (Mn Sq.Mtr) (US$ Mn)
Figure 30: Drywall Texture Market for Non Residential Construction, 2015 – 2024 (Mn Sq.Mtr) (US$ Mn)
Figure 31: Do It Yourself Market for Residential Construction, 2015 – 2024 (Mn Sq.Mtr) (US$ Mn)
Figure 32: Professionals Market for Residential Construction, 2015 – 2024 (Mn Sq.Mtr) (US$ Mn)
Figure 33: Regular Drywall Market, 2015 – 2024 (Mn Sq.Mtr) (US$ Mn)
Figure 34: Moisture Resistant Drywall Market, 2015 – 2024 (Mn Sq.Mtr) (US$ Mn)
Figure 35: Fire Resistant Drywall Market, 2015 – 2024 (Mn Sq.Mtr) (US$ Mn)
Figure 36: Others Market, 2015 – 2024 (Mn Sq.Mtr) (US$ Mn)
Figure 37: Topping Joint Compound Market, 2015 – 2024 (Mn Sq.Mtr) (US$ Mn)
Figure 38: All Purpose Joint Compound Market, 2015 – 2024 (Mn Sq.Mtr) (US$ Mn)
Figure 39: Others Market, 2015 – 2024 (Mn Sq.Mtr) (US$ Mn)
Figure 40: Knockdown Texture Market, 2015 – 2024 (Mn Sq.Mtr) (US$ Mn)
Figure 41: Orange Peel Texture Market, 2015 – 2024 (Mn Sq.Mtr) (US$ Mn)
Figure 42: Roll Texture Market, 2015 – 2024 (Mn Sq.Mtr) (US$ Mn)
Figure 43: Sand Texture Market, 2015 – 2024 (Mn Sq.Mtr) (US$ Mn)
Figure 44: Others Market, 2015 – 2024 (Mn Sq.Mtr) (US$ Mn)
Figure 45: Drywall Texture Market for Walls, 2015 – 2024 (Mn Sq.Mtr) (US$ Mn)
Figure 46: Drywall Texture Market for Ceilings, 2015 – 2024 (Mn Sq.Mtr) (US$ Mn)
Figure 47: Drywall Texture Market for Others, 2015 – 2024 (Mn Sq.Mtr) (US$ Mn)
Figure 48: Drywall Texture Market for Residential Construction, 2015 – 2024 (Mn Sq.Mtr) (US$ Mn)
Figure 49: Drywall Texture Market for Commercial Construction, 2015 – 2024 (Mn Sq.Mtr) (US$ Mn)
Figure 50: Drywall Texture Market for Non Residential Construction, 2015 – 2024 (Mn Sq.Mtr) (US$ Mn)
Figure 51: Do It Yourself Market for Residential Construction, 2015 – 2024 (Mn Sq.Mtr) (US$ Mn)
Figure 52: Professionals Market for Residential Construction, 2015 – 2024 (Mn Sq.Mtr) (US$ Mn)
Figure 53: Regular Drywall Market, 2015 – 2024 (Mn Sq.Mtr) (US$ Mn)
Figure 54: Moisture Resistant Drywall Market, 2015 – 2024 (Mn Sq.Mtr) (US$ Mn)
Figure 55: Fire Resistant Drywall Market, 2015 – 2024 (Mn Sq.Mtr) (US$ Mn)
Figure 56: Others Market, 2015 – 2024 (Mn Sq.Mtr) (US$ Mn)
Figure 57: Topping Joint Compound Market, 2015 – 2024 (Mn Sq.Mtr) (US$ Mn)
Figure 58: All Purpose Joint Compound Market, 2015 – 2024 (Mn Sq.Mtr) (US$ Mn)
Figure 59: Others Market, 2015 – 2024 (Mn Sq.Mtr) (US$ Mn)
Figure 60: Knockdown Texture Market, 2015 – 2024 (Mn Sq.Mtr) (US$ Mn)
Figure 61: Orange Peel Texture Market, 2015 – 2024 (Mn Sq.Mtr) (US$ Mn)
Figure 62: Roll Texture Market, 2015 – 2024 (Mn Sq.Mtr) (US$ Mn)
Figure 63: Sand Texture Market, 2015 – 2024 (Mn Sq.Mtr) (US$ Mn)
Figure 64: Others Market, 2015 – 2024 (Mn Sq.Mtr) (US$ Mn)
Figure 65: Drywall Texture Market for Walls, 2015 – 2024 (Mn Sq.Mtr) (US$ Mn)
Figure 66: Drywall Texture Market for Ceilings, 2015 – 2024 (Mn Sq.Mtr) (US$ Mn)
Figure 67: Drywall Texture Market for Others, 2015 – 2024 (Mn Sq.Mtr) (US$ Mn)
Figure 68: Drywall Texture Market for Residential Construction, 2015 – 2024 (Mn Sq.Mtr) (US$ Mn)
Figure 69: Drywall Texture Market for Commercial Construction, 2015 – 2024 (Mn Sq.Mtr) (US$ Mn)
Figure 70: Drywall Texture Market for Non Residential Construction, 2015 – 2024 (Mn Sq.Mtr) (US$ Mn)
Figure 71: Do It Yourself Market for Residential Construction, 2015 – 2024 (Mn Sq.Mtr) (US$ Mn)
Figure 72: Professionals Market for Residential Construction, 2015 – 2024 (Mn Sq.Mtr) (US$ Mn)
Figure 73: North America Drywall Texture Market Share Analysis by Company (2015)
Copyright © Transparency Market Research, Inc. All Rights reserved
Trust Online

Drywall Textures Market