
Reports
Reports
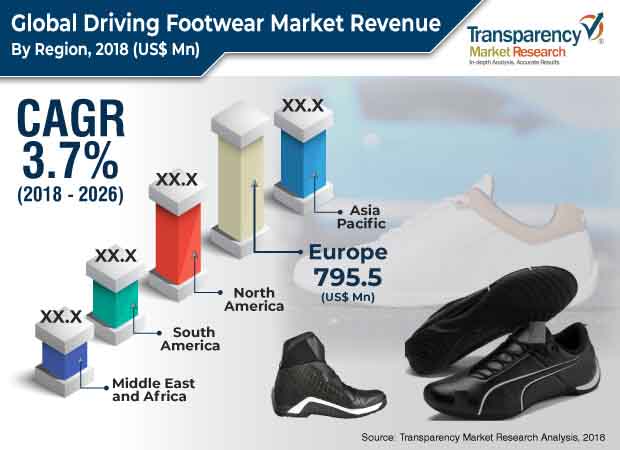
Global Driving Footwear Market - Snapshot
Across the globe, there is an increasing demand for sports bikes. In Asia Pacific, demand for sports bikes or super bikes is increasing in China and India. In India, major luxury motorcycle brands such as Ducati, Kawasaki, Triumph, and Harley-Davidson are increasing their sales. According to Society for Indian Automobile Manufacturers (SIAM), the overall sales of two-wheelers reached17.8 million units in 2012 -13 which increased at a CAGR of 5.8% to reach 25.0 million units in 2017-18.According to Motorcycle Industry Association (MCIA), the U.K., the number of sport/ tour motorcycle sales in the U.K. was 2,877 in November 2017 YTD, which increased by 7.4% to reach 3,091 in November 2018 YTD. The overall motorcycle sale in the U.K. in November 2017 YTD was 92,016 which increased 3.3% to reach 95,015 in 2018 YTD. In the U.K., the number of motorcycles in use was 1.24 million in 2014 which increased to 1.26 million in 2017. Thus motorcycle sales across Asia Pacific, European, and other countries are increasing the demand for driving footwear.
In the motorsports category, Formula One, owned by Formula One Group is one of the most popular motor racing sports globally. In the U.S., Formula One racing is expected to grow in popularity after U.S. based Liberty Media Corporation (LMC) acquired Formula One auto racing in January 2017. In 2016, consumers in the U.S. spent US$ 56 billion to attend sporting events and the spending is expected to grow in future. Formula One Group expects increased revenue for Formula One sports from ticket sales, advertising, and sponsorship in the U.S. in future. Asia Pacific countries are also seeing rising popularity of Formula One. Vietnam’s capital city Hanoi is expected to hold Formula One races for the first time from 2020. All these factors present a huge opportunity for growth of the driving footwear market in the U.S. and Vietnam. Thus, increasing penetration of motorsports in developing countries of Asia Pacific is expected to increase the demand for driving footwear.
The study provides a conclusive view of the global driving footwear market by segmenting it in terms of product type, material type, vehicle type, consumer group, and distribution channel. In terms of product type, the driving footwear market has been classified into boots, shoes, and others. The others category includes sneakers, training shoes, etc. Based on material type, the market is segmented into leather, synthetic, and natural fibers. Based on vehicle type, the market is segmented into two wheelers and four wheelers. Based on consumer group, the market is classified into men and women. Based on distribution channel, the market is segmented into online and offline.
E-commerce presents a huge opportunity for the growth of the driving footwear market. In general, the global footwear market is growing in single digits, but online sale of footwear including driving footwear is increasing in double digits. In China, which has the largest number of e-shoppers in the world, online sale of driving footwear is expected to grow at a very high rate. According to global driving footwear manufacturer Puma SE, by 2020, China is expected to hold 60.0% of the global e-commerce market followed by the U.S. with 17.0%.
Across the world there is a decrease in appetite for driving leather footwear such as leather boots and shoes. A major reason for the decrease in demand for leather footwear is that consumers have become ethically conscious shoppers and look for non-leather driving footwear for their needs.In 2014, the U.S. faced a drought, which caused herds of cattle to decrease, consequently yielding fewer hides, resulting in increase in price of hides. Driving footwear manufacturers and other footwear manufacturers turned to other non-leather material for footwear production. After the shortage of hides was over, these U.S. footwear manufacturers did not go back to use leather as a material. Rising popularity of driving footwear sneakers are also decreasing the demand for leather footwear. Sneakers are generally made of non-leather material.
The report highlights major companies operating in the global driving footwear market including Puma SE, Adidas AG, Alpinestars S.p.A, Dainese S.p.A, Fox Head Inc., SCOTT Sports SA, Lemans Corporation, Gianni Falco Srl, Sparco Spa and Piloti Inc.
1. Preface
1.1. Research Scope and Objectives
2. Assumptions and Research Methodology
3. Executive Summary
4. Market Overview
4.1. Market Dynamics
4.1.1. Drivers
4.1.2. Restraints
4.1.3. Opportunities
4.2. Key Trends Analysis
4.3. Industry SWOT Analysis
4.4. Porter’s Five Forces Analysis
4.5. Value Chain Analysis
4.6. Key Market Indicators
4.7. Global Market Outlook
5. Global Driving Footwear Market Analysis and Forecast, by Product Type
5.1. Driving Footwear Market Size (‘000 Units) (US$ Mn), by Product Type, 2016 - 2026
5.1.1. Boots
5.1.2. Shoes
5.1.3. Others
5.2. Incremental Opportunity, by Product Type
6. Global Driving Footwear Market Analysis and Forecast, by Material Type
6.1. Driving Footwear Market Size (‘000 Units) (US$ Mn), by Material Type, 2016 - 2026
6.1.1. Leather
6.1.2. Synthetic
6.1.3. Natural Fibers
6.2. Incremental Opportunity, by Material Type
7. Global Driving Footwear Market Analysis and Forecast, by Vehicle Type
7.1. Driving Footwear Market Size (‘000 Units) (US$ Mn), by Type, 2016 - 2026
7.1.1. Two Wheelers
7.1.2. Four Wheelers
7.2. Incremental Opportunity, by Vehicle Type
8. Global Driving Footwear Market Analysis and Forecast, by Consumer Group
8.1. Driving Footwear Market Size (‘000 Units) (US$ Mn), by Consumer Group, 2016 - 2026
8.1.1. Men
8.1.2. Women
8.2. Incremental Opportunity, by Consumer Group
9. Global Driving Footwear Market Analysis and Forecast, by Distribution Channel
9.1. Driving Footwear Market Size (‘000 Units) (US$ Mn), by Distribution Channel, 2016 - 2026
9.1.1. Online
9.1.2. Offline
9.2. Incremental Opportunity, by Distribution Channel
10. Global Driving Footwear Market Analysis and Forecast, by Region
10.1. Regional Snapshot
10.2. Global Driving Footwear Market Size (‘000 Units) (US$ Mn), by Region, 2016 - 2026
10.2.1. North America
10.2.2. Europe
10.2.3. Asia Pacific
10.2.4. Middle East & Africa (MEA)
10.2.5. South America
10.3. Global Incremental Opportunity, by Region
11. North America Driving Footwear Market Analysis and Forecast
11.1. Regional Snapshot
11.2. Key Trend Analysis
11.3. Brand Analysis
11.4. Driving Footwear Market Size (‘000 Units) (US$ Mn), by Product Type, 2016 - 2026
11.4.1. Boots
11.4.2. Shoes
11.4.3. Others
11.5. Driving Footwear Market Size (‘000 Units) (US$ Mn), by Material Type, 2016 - 2026
11.5.1. Leather
11.5.2. Synthetic
11.5.3. Natural Fibers
11.6. Driving Footwear Market Size (‘000 Units) (US$ Mn), by Vehicle Type, 2016 - 2026
11.6.1. Two Wheelers
11.6.2. Four Wheelers
11.7. Driving Footwear Market Size (‘000 Units) (US$ Mn), by Consumer Group, 2016 - 2026
11.7.1. Men
11.7.2. Women
11.8. Driving Footwear Market Size (‘000 Units) (US$ Mn), by Distribution Channel, 2016 - 2026
11.8.1. Online
11.8.2. Offline
11.9. Driving Footwear Market Size (‘000 Units) (US$ Mn), by Country& Sub-region, 2016 - 2026
11.9.1. U.S.
11.9.2. Canada
11.9.3. Rest of North America
11.10. Incremental Opportunity Analysis
11.10.1. By Product Type
11.10.2. By Material Type
11.10.3. By Vehicle Type
11.10.4. By Consumer Group
11.10.5. By Distribution Channel
11.10.6. By Country
12. U.S. Driving Footwear Market Analysis and Forecast
12.1. Price Trend Analysis
12.1.1. Price Trend (2016 – 2026)
12.1.2. Price Positioning Matrix
12.2. Driving Footwear Market Size (‘000 Units) (US$ Mn), by Product Type, 2016 - 2026
12.2.1. Boots
12.2.2. Shoes
12.2.3. Others
12.3. Driving Footwear Market Size (‘000 Units) (US$ Mn), by Material Type, 2016 - 2026
12.3.1. Leather
12.3.2. Synthetic
12.3.3. Natural Fibers
12.4. Driving Footwear Market Size (‘000 Units) (US$ Mn), by Vehicle Type, 2016 - 2026
12.4.1. Two Wheelers
12.4.2. Four Wheelers
12.5. Driving Footwear Market Size (‘000 Units) (US$ Mn), by Consumer Group, 2016 - 2026
12.5.1. Men
12.5.2. Women
12.6. Driving Footwear Market Size (‘000 Units) (US$ Mn), by Distribution Channel, 2016 - 2026
12.6.1. Online
12.6.2. Offline
12.7. Incremental Opportunity Analysis
12.7.1. By Product Type
12.7.2. By Material Type
12.7.3. By Vehicle Type
12.7.4. By Consumer Group
12.7.5. By Distribution Channel
13. Canada Driving Footwear Market Analysis and Forecast
13.1. Price Trend Analysis
13.1.1. Price Trend (2016 – 2026)
13.1.2. Price Positioning Matrix
13.2. Driving Footwear Market Size (‘000 Units) (US$ Mn), by Product Type, 2016 - 2026
13.2.1. Boots
13.2.2. Shoes
13.2.3. Others
13.3. Driving Footwear Market Size (‘000 Units) (US$ Mn), by Material Type, 2016 - 2026
13.3.1. Leather
13.3.2. Synthetic
13.3.3. Natural Fibers
13.4. Driving Footwear Market Size (‘000 Units) (US$ Mn), by Vehicle Type, 2016 - 2026
13.4.1. Two Wheelers
13.4.2. Four Wheelers
13.5. Driving Footwear Market Size (‘000 Units) (US$ Mn), by Consumer Group, 2016 - 2026
13.5.1. Men
13.5.2. Women
13.6. Driving Footwear Market Size (‘000 Units) (US$ Mn), by Distribution Channel, 2016 - 2026
13.6.1. Online
13.6.2. Offline
13.7. Incremental Opportunity Analysis
13.7.1. By Product Type
13.7.2. By Material Type
13.7.3. By Vehicle Type
13.7.4. By Consumer Group
13.7.5. By Distribution Channel
14. Europe Driving Footwear Market Analysis and Forecast
14.1. Regional Snapshot
14.2. Key Trend Analysis
14.3. Brand Analysis
14.4. Driving Footwear Market Size (‘000 Units) (US$ Mn), by Product Type, 2016 - 2026
14.4.1. Boots
14.4.2. Shoes
14.4.3. Others
14.5. Driving Footwear Market Size (‘000 Units) (US$ Mn), by Material Type, 2016 - 2026
14.5.1. Leather
14.5.2. Synthetic
14.5.3. Natural Fibers
14.6. Driving Footwear Market Size (‘000 Units) (US$ Mn), by Vehicle Type, 2016 - 2026
14.6.1. Two Wheelers
14.6.2. Four Wheelers
14.7. Driving Footwear Market Size (‘000 Units) (US$ Mn), by Consumer Group, 2016 - 2026
14.7.1. Men
14.7.2. Women
14.8. Driving Footwear Market Size (‘000 Units) (US$ Mn), by Distribution Channel, 2016 - 2026
14.8.1. Online
14.8.2. Offline
14.9. Europe Driving Footwear Market Size (‘000 Units) (US$ Mn), by Country& Sub-region, 2016 - 2026
14.9.1. U.K.
14.9.2. Germany
14.9.3. Italy
14.9.4. France
14.9.5. Spain
14.9.6. Rest of Europe
14.10. Europe Incremental Opportunity Analysis
14.10.1. By Product Type
14.10.2. By Material Type
14.10.3. By Vehicle Type
14.10.4. By Consumer Group
14.10.5. By Distribution Channel
14.10.6. By Country
15. U.K. Driving Footwear Market Analysis and Forecast
15.1. Price Trend Analysis
15.1.1. Price Trend (2016 – 2026)
15.1.2. Price Positioning Matrix
15.2. Driving Footwear Market Size (‘000 Units) (US$ Mn), by Product Type, 2016 - 2026
15.2.1. Boots
15.2.2. Shoes
15.2.3. Others
15.3. Driving Footwear Market Size (‘000 Units) (US$ Mn), by Material Type, 2016 - 2026
15.3.1. Leather
15.3.2. Synthetic
15.3.3. Natural Fibers
15.4. Driving Footwear Market Size (‘000 Units) (US$ Mn), by Vehicle Type, 2016 - 2026
15.4.1. Two Wheelers
15.4.2. Four Wheelers
15.5. Driving Footwear Market Size (‘000 Units) (US$ Mn), by Consumer Group, 2016 - 2026
15.5.1. Men
15.5.2. Women
15.6. Driving Footwear Market Size (‘000 Units) (US$ Mn), by Distribution Channel, 2016 - 2026
15.6.1. Online
15.6.2. Offline
15.7. Incremental Opportunity Analysis
15.7.1. By Product Type
15.7.2. By Material Type
15.7.3. By Vehicle Type
15.7.4. By Consumer Group
15.7.5. By Distribution Channel
16. Germany Driving Footwear Market Analysis and Forecast
16.1. Price Trend Analysis
16.1.1. Price Trend (2016 – 2026)
16.1.2. Price Positioning Matrix
16.2. Driving Footwear Market Size (‘000 Units) (US$ Mn), by Product Type, 2016 - 2026
16.2.1. Boots
16.2.2. Shoes
16.2.3. Others
16.3. Driving Footwear Market Size (‘000 Units) (US$ Mn), by Material Type, 2016 - 2026
16.3.1. Leather
16.3.2. Synthetic
16.3.3. Natural Fibers
16.4. Driving Footwear Market Size (‘000 Units) (US$ Mn), by Vehicle Type, 2016 - 2026
16.4.1. Two Wheelers
16.4.2. Four Wheelers
16.5. Driving Footwear Market Size (‘000 Units) (US$ Mn), by Consumer Group, 2016 - 2026
16.5.1. Men
16.5.2. Women
16.6.D riving Footwear Market Size (‘000 Units) (US$ Mn), by Distribution Channel, 2016 - 2026
16.6.1. Online
16.6.2. Offline
16.7. Incremental Opportunity Analysis
16.7.1. By Product Type
16.7.2. By Material Type
16.7.3. By Vehicle Type
16.7.4. By Consumer Group
16.7.5. By Distribution Channel
17. Italy Driving Footwear Market Analysis and Forecast
17.1. Price Trend Analysis
17.1.1. Price Trend (2016 – 2026)
17.1.2. Price Positioning Matrix
17.2. Driving Footwear Market Size (‘000 Units) (US$ Mn), by Product Type, 2016 - 2026
17.2.1. Boots
17.2.2. Shoes
17.2.3. Others
17.3. Driving Footwear Market Size (‘000 Units) (US$ Mn), by Material Type, 2016 - 2026
17.3.1. Leather
17.3.2. Synthetic
17.3.3. Natural Fibers
17.4. Driving Footwear Market Size (‘000 Units) (US$ Mn), by Vehicle Type, 2016 - 2026
17.4.1. Two Wheelers
17.4.2. Four Wheelers
17.5. Driving Footwear Market Size (‘000 Units) (US$ Mn), by Consumer Group, 2016 - 2026
17.5.1. Men
17.5.2. Women
17.6. Driving Footwear Market Size (‘000 Units) (US$ Mn), by Distribution Channel, 2016 - 2026
17.6.1. Online
17.6.2. Offline
17.7. Incremental Opportunity Analysis
17.7.1. By Product Type
17.7.2. By Material Type
17.7.3. By Vehicle Type
17.7.4. By Consumer Group
17.7.5. By Distribution Channel
18. France Driving Footwear Market Analysis and Forecast
18.1. Price Trend Analysis
18.1.1. Price Trend (2016 – 2026)
18.1.2. Price Positioning Matrix
18.2. Driving Footwear Market Size (‘000 Units) (US$ Mn), by Product Type, 2016 - 2026
18.2.1. Boots
18.2.2. Shoes
18.2.3. Others
18.3. Driving Footwear Market Size (‘000 Units) (US$ Mn), by Material Type, 2016 - 2026
18.3.1. Leather
18.3.2. Synthetic
18.3.3. Natural Fibers
18.4. Driving Footwear Market Size (‘000 Units) (US$ Mn), by Vehicle Type, 2016 - 2026
18.4.1. Two Wheelers
18.4.2. Four Wheelers
18.5. Driving Footwear Market Size (‘000 Units) (US$ Mn), by Consumer Group, 2016 - 2026
18.5.1. Men
18.5.2. Women
18.6. Driving Footwear Market Size (‘000 Units) (US$ Mn), by Distribution Channel, 2016 - 2026
18.6.1. Online
18.6.2. Offline
18.7. Incremental Opportunity Analysis
18.7.1. By Product Type
18.7.2. By Material Type
18.7.3. By Vehicle Type
18.7.4. By Consumer Group
18.7.5. By Distribution Channel
19. Spain Driving Footwear Market Analysis and Forecast
19.1. Price Trend Analysis
19.1.1. Price Trend (2016 – 2026)
19.1.2. Price Positioning Matrix
19.2. Driving Footwear Market Size (‘000 Units) (US$ Mn), by Product Type, 2016 - 2026
19.2.1. Boots
19.2.2. Shoes
19.2.3. Others
19.3. Driving Footwear Market Size (‘000 Units) (US$ Mn), by Material Type, 2016 - 2026
19.3.1. Leather
19.3.2. Synthetic
19.3.3. Natural Fibers
19.4. Driving Footwear Market Size (‘000 Units) (US$ Mn), by Vehicle Type, 2016 - 2026
19.4.1. Two Wheelers
19.4.2. Four Wheelers
19.5. Driving Footwear Market Size (‘000 Units) (US$ Mn), by Consumer Group, 2016 - 2026
19.5.1. Men
19.5.2. Women
19.6. Driving Footwear Market Size (‘000 Units) (US$ Mn), by Distribution Channel, 2016 - 2026
19.6.1. Online
19.6.2. Offline
19.7. Incremental Opportunity Analysis
19.7.1. By Product Type
19.7.2. By Material Type
19.7.3. By Vehicle Type
19.7.4. By Consumer Group
19.7.5. By Distribution Channel
20. Asia Pacific Driving Footwear Market Analysis and Forecast
20.1. Regional Snapshot
20.2. Key Trend Analysis
20.3. Brand Analysis
20.4. Driving Footwear Market Size (‘000 Units) (US$ Mn), by Product Type, 2016 - 2026
20.4.1. Boots
20.4.2. Shoes
20.4.3. Others
20.5. Driving Footwear Market Size (‘000 Units) (US$ Mn), by Material Type, 2016 - 2026
20.5.1. Leather
20.5.2. Synthetic
20.5.3. Natural Fibers
20.6. Driving Footwear Market Size (‘000 Units) (US$ Mn), by Vehicle Type, 2016 - 2026
20.6.1. Two Wheelers
20.6.2. Four Wheelers
20.7. Driving Footwear Market Size (‘000 Units) (US$ Mn), by Consumer Group, 2016 - 2026
20.7.1. Men
20.7.2. Women
20.8. Driving Footwear Market Size (‘000 Units) (US$ Mn), by Distribution Channel, 2016 - 2026
20.8.1. Online
20.8.2. Offline
20.9. Asia Pacific Driving Footwear Market Size (‘000 Units) (US$ Mn), by Country & Sub-region, 2016 - 2026
20.9.1. China
20.9.2. Japan
20.9.3. India
20.9.4. Rest of Asia Pacific
20.10. Incremental Opportunity Analysis
20.10.1. By Product Type
20.10.2. By Material Type
20.10.3. By Vehicle Type
20.10.4. By Consumer Group
20.10.5. By Distribution Channel
20.10.6. By Country
21. China Driving Footwear Market Analysis and Forecast
21.1. Price Trend Analysis
21.1.1. Price Trend (2016 – 2026)
21.1.2. Price Positioning Matrix
21.2. Driving Footwear Market Size (‘000 Units) (US$ Mn), by Product Type, 2016 - 2026
21.2.1. Boots
21.2.2. Shoes
21.2.3. Others
21.3. Driving Footwear Market Size (‘000 Units) (US$ Mn), by Material Type, 2016 - 2026
21.3.1. Leather
21.3.2. Synthetic
21.3.3. Natural Fibers
21.4. Driving Footwear Market Size (‘000 Units) (US$ Mn), by Vehicle Type, 2016 - 2026
21.4.1. Two Wheelers
21.4.2. Four Wheelers
21.5. Driving Footwear Market Size (‘000 Units) (US$ Mn), by Consumer Group, 2016 - 2026
21.5.1. Men
21.5.2. Women
21.6. Driving Footwear Market Size (‘000 Units) (US$ Mn), by Distribution Channel, 2016 - 2026
21.6.1. Online
21.6.2. Offline
21.7. Incremental Opportunity Analysis
21.7.1. By Product Type
21.7.2. By Material Type
21.7.3. By Vehicle Type
21.7.4. By Consumer Group
21.7.5. By Distribution Channel
22. Japan Driving Footwear Market Analysis and Forecast
22.1. Price Trend Analysis
22.1.1. Price Trend (2016 – 2026)
22.1.2. Price Positioning Matrix
22.2. Driving Footwear Market Size (‘000 Units) (US$ Mn), by Product Type, 2016 - 2026
22.2.1. Boots
22.2.2. Shoes
22.2.3. Others
22.3. Driving Footwear Market Size (‘000 Units) (US$ Mn), by Material Type, 2016 - 2026
22.3.1. Leather
22.3.2. Synthetic
22.3.3. Natural Fibers
22.4. Driving Footwear Market Size (‘000 Units) (US$ Mn), by Vehicle Type, 2016 - 2026
22.4.1. Two Wheelers
22.4.2. Four Wheelers
22.5. Driving Footwear Market Size (‘000 Units) (US$ Mn), by Consumer Group, 2016 - 2026
22.5.1. Men
22.5.2. Women
22.6. Driving Footwear Market Size (‘000 Units) (US$ Mn), by Distribution Channel, 2016 - 2026
22.6.1. Online
22.6.2. Offline
22.7. Incremental Opportunity Analysis
22.7.1. By Product Type
22.7.2. By Material Type
22.7.3. By Vehicle Type
22.7.4. By Consumer Group
22.7.5. By Distribution Channel
23. India Driving Footwear Market Analysis and Forecast
23.1. Price Trend Analysis
23.1.1. Price Trend (2016 – 2026)
23.1.2. Price Positioning Matrix
23.2. Driving Footwear Market Size (‘000 Units) (US$ Mn), by Product Type, 2016 - 2026
23.2.1. Boots
23.2.2. Shoes
23.2.3. Others
23.3. Driving Footwear Market Size (‘000 Units) (US$ Mn), by Material Type, 2016 - 2026
23.3.1. Leather
23.3.2. Synthetic
23.3.3. Natural Fibers
23.4. Driving Footwear Market Size (‘000 Units) (US$ Mn), by Vehicle Type, 2016 - 2026
23.4.1. Two Wheelers
23.4.2. Four Wheelers
23.5. Driving Footwear Market Size (‘000 Units) (US$ Mn), by Consumer Group, 2016 - 2026
23.5.1. Men
23.5.2. Women
23.6. Driving Footwear Market Size (‘000 Units) (US$ Mn), by Distribution Channel, 2016 - 2026
23.6.1. Online
23.6.2. Offline
23.7. Incremental Opportunity Analysis
23.7.1. By Product Type
23.7.2. By Material Type
23.7.3. By Vehicle Type
23.7.4. By Consumer Group
23.7.5. By Distribution Channel
24. Middle East &Africa (MEA) Driving Footwear Market Analysis and Forecast
24.1. Regional Snapshot
24.2. Key Trend Analysis
24.3. Brand Analysis
24.4. Price Trend Analysis
24.4.1. Price Trend (2016 – 2026)
24.4.2. Price Positioning Matrix
24.5. Driving Footwear Market Size (‘000 Units) (US$ Mn), by Product Type, 2016 - 2026
24.5.1. Boots
24.5.2. Shoes
24.5.3. Others
24.6. Driving Footwear Market Size (‘000 Units) (US$ Mn), by Material Type, 2016 - 2026
24.6.1. Leather
24.6.2. Synthetic
24.6.3. Natural Fibers
24.7. Driving Footwear Market Size (‘000 Units) (US$ Mn), by Vehicle Type, 2016 - 2026
4.7.1. Two Wheelers
24.7.2. Four Wheelers
24.8. Driving Footwear Market Size (‘000 Units) (US$ Mn), by Consumer Group, 2016 - 2026
24.8.1. Men
24.8.2. Women
24.9. Driving Footwear Market Size (‘000 Units) (US$ Mn), by Distribution Channel, 2016 - 2026
24.9.1. Online
24.9.2. Offline
24.10. Middle East & Africa Driving Footwear Market Size (‘000 Units) (US$ Mn), by Country& Sub-region, 2016 - 2026
24.10.1. GCC
24.10.2. South Africa
24.10.3. Rest of MEA
24.11. Incremental Opportunity Analysis
24.11.1. By Product Type
24.11.2. By Material Type
24.11.3. By Vehicle Type
24.11.4. By Consumer Group
24.11.5. By Distribution Channel
24.11.6. By Country
25. South America Driving Footwear Market Analysis and Forecast
25.1. Regional Snapshot
25.2. Key Trend Analysis
25.3. Brand Analysis
25.4. Driving Footwear Market Size (‘000 Units) (US$ Mn), by Product Type, 2016 - 2026
25.4.1. Boots
25.4.2. Shoes
25.4.3. Others
25.5. Driving Footwear Market Size (‘000 Units) (US$ Mn), by Material Type, 2016 - 2026
25.5.1. Leather
25.5.2. Synthetic
25.5.3. Natural Fibers
25.6. Driving Footwear Market Size (‘000 Units) (US$ Mn), by Vehicle Type, 2016 - 2026
25.6.1. Two Wheelers
25.6.2. Four Wheelers
25.7. Driving Footwear Market Size (‘000 Units) (US$ Mn), by Consumer Group, 2016 - 2026
25.7.1. Men
25.7.2. Women
25.8. Driving Footwear Market Size (‘000 Units) (US$ Mn), by Distribution Channel, 2016 - 2026
25.8.1. Online
25.8.2. Offline
25.9. South America Driving Footwear Market Size (‘000 Units) (US$ Mn), by Country& Sub-region, 2016 - 2026
25.9.1. Brazil
25.9.2. Rest of South America
25.10. Incremental Opportunity Analysis
25.10.1. By Product Type
25.10.2. By Material Type
25.10.3. By Vehicle Type
25.10.4. By Consumer Group
25.10.5. By Distribution Channel
25.10.6. By Country
26. Brazil America Driving Footwear Market Analysis and Forecast
26.1. Price Trend Analysis
26.1.1. Price Trend (2016 – 2026)
26.1.2. Price Positioning Matrix
26.2. Driving Footwear Market Size (‘000 Units) (US$ Mn), by Product Type, 2016 - 2026
26.2.1. Boots
26.2.2. Shoes
26.2.3. Others
26.3. Driving Footwear Market Size (‘000 Units) (US$ Mn), by Material Type, 2016 - 2026
26.3.1. Leather
26.3.2. Synthetic
26.3.3. Natural Fibers
26.4. Driving Footwear Market Size (‘000 Units) (US$ Mn), by Vehicle Type, 2016 - 2026
26.4.1. Two Wheelers
26.4.2. Four Wheelers
26.5. Driving Footwear Market Size (‘000 Units) (US$ Mn), by Consumer Group, 2016 - 2026
26.5.1. Men
26.5.2. Women
26.6. Driving Footwear Market Size (‘000 Units) (US$ Mn), by Distribution Channel, 2016 - 2026
26.6.1. Online
26.6.2. Offline
26.7. Incremental Opportunity Analysis
26.7.1. By Product Type
26.7.2. By Material Type
26.7.3. By Vehicle Type
26.7.4. By Consumer Group
26.7.5. By Distribution Channel
27. Competition Landscape
27.1. Competition Matrix
27.2. Market Share Analysis
28. Company Profiles
28.1. Puma SE
28.2. Adidas AG
28.3. Alpinestars S.p.A
28.4. Dainese S.p.A
28.5. Fox Head Inc.
28.6. SCOTT Sports SA
28.7. Lemans Corporation
28.8. Gianni Falco Srl
28.9. Sparco S.p.A
28.10. Piloti Inc.
29. Key Takeaways
List of Tables
Table 1: Global Driving Footwear Market Value Size & Forecast, by Product Type, US$ Mn, 2016-2026
Table 2: Global Driving Footwear Market Volume Size & Forecast, by Product Type, ‘000 Units, 2016-2026
Table 3: Global Driving Footwear Market Value Size & Forecast, by Material Type, US$ Mn, 2016-2026
Table 4: Global Driving Footwear Market Volume Size & Forecast, by Material Type, ‘000 Units, 2016-2026
Table 5: Global Driving Footwear Market Value Size & Forecast, by Vehicle Type, US$ Mn, 2016-2026
Table 6: Global Driving Footwear Market Volume Size & Forecast, by Vehicle Type, ‘000 Units, 2016-2026
Table 7: Global Driving Footwear Market Value Size & Forecast, by Consumer Group, US$ Mn, 2016-2026
Table 8: Global Driving Footwear Market Volume Size & Forecast, by Consumer Group, ‘000 Units, 2016-2026
Table 9: Global Driving Footwear Market Value Size & Forecast, by Distribution Channel, US$ Mn, 2016-2026
Table 10: Global Driving Footwear Market Volume Size & Forecast, by Distribution Channel, ‘000 Units, 2016-2026
Table 11: Global Driving Footwear Market Value Size & Forecast, by Region, US$ Mn, 2016-2026
Table 12: Global Driving Footwear Market Volume Size & Forecast, by Region, ‘000 Units, 2016-2026
Table 13: North America Driving Footwear Market Value Size & Forecast, by Product Type, US$ Mn, 2016-2026
Table 14: North America Driving Footwear Market Volume Size & Forecast, by Product Type, ‘000 Units, 2016-2026
Table 15: North America Driving Footwear Market Value Size & Forecast, by Material Type, US$ Mn, 2016-2026
Table 16: North America Driving Footwear Market Volume Size & Forecast, by Material Type, ‘000 Units, 2016-2026
Table 17: North America Driving Footwear Market Value Size & Forecast, by Vehicle Type, US$ Mn, 2016-2026
Table 18: North America Driving Footwear Market Volume Size & Forecast, by Vehicle Type, ‘000 Units, 2016-2026
Table 19: North America Driving Footwear Market Value Size & Forecast, by Consumer Group, US$ Mn, 2016-2026
Table 20: North America Driving Footwear Market Volume Size & Forecast, by Consumer Group, ‘000 Units, 2016-2026
Table 21: North America Driving Footwear Market Value Size & Forecast, by Distribution Channel, US$ Mn, 2016-2026
Table 22: North America Driving Footwear Market Volume Size & Forecast, by Distribution Channel, ‘000 Units, 2016-2026
Table 23: North America Driving Footwear Market Value Size & Forecast, by Country, US$ Mn, 2016-2026
Table 24: North America Driving Footwear Market Volume Size & Forecast, by Country, ‘000 Units, 2016-2026
Table 25: U.S. Driving Footwear Market Value Size & Forecast, by Product Type, US$ Mn, 2016-2026
Table 26: U.S. Driving Footwear Market Volume Size & Forecast, by Product Type, ‘000 Units, 2016-2026
Table 27: U.S. Driving Footwear Market Value Size & Forecast, by Material Type, US$ Mn, 2016-2026
Table 28: U.S. Driving Footwear Market Volume Size & Forecast, by Material Type, ‘000 Units, 2016-2026
Table 29: U.S. Driving Footwear Market Value Size & Forecast, by Vehicle Type, US$ Mn, 2016-2026
Table 30: U.S. Driving Footwear Market Volume Size & Forecast, by Vehicle Type, ‘000 Units, 2016-2026
Table 31: U.S. Driving Footwear Market Value Size & Forecast, by Consumer Group, US$ Mn, 2016-2026
Table 32: U.S. Driving Footwear Market Value Size & Forecast, by Consumer Group, US$ Mn, 2016-2026
Table 33: U.S. Driving Footwear Market Value Size & Forecast, by Distribution Channel, US$ Mn, 2016-2026
Table 34: U.S. Driving Footwear Market Volume Size & Forecast, by Distribution Channel, ‘000 Units, 2016-2026
Table 35: Canada Driving Footwear Market Value Size & Forecast, by Product Type, US$ Mn, 2016-2026
Table 36: Canada Driving Footwear Market Volume Size & Forecast, by Product Type, ‘000 Units, 2016-2026
Table 37: Canada Driving Footwear Market Value Size & Forecast, by Material Type, US$ Mn, 2016-2026
Table 38: Canada Driving Footwear Market Volume Size & Forecast, by Material Type, ‘000 Units, 2016-2026
Table 39: Canada Driving Footwear Market Value Size & Forecast, by Vehicle Type, US$ Mn, 2016-2026
Table 40: Canada Driving Footwear Market Volume Size & Forecast, by Vehicle Type, ‘000 Units, 2016-2026
Table 41: Canada Driving Footwear Market Value Size & Forecast, by Consumer Group, US$ Mn, 2016-2026
Table 42: Canada Driving Footwear Market Value Size & Forecast, by Consumer Group, US$ Mn, 2016-2026
Table 43: Canada Driving Footwear Market Value Size & Forecast, by Distribution Channel, US$ Mn, 2016-2026
Table 44: Canada Driving Footwear Market Volume Size & Forecast, by Distribution Channel, ‘000 Units, 2016-2026
Table 45: Europe Driving Footwear Market Value Size & Forecast, by Product Type, US$ Mn, 2016-2026
Table 46: Europe Driving Footwear Market Volume Size & Forecast, by Product Type, ‘000 Units, 2016-2026
Table 47: Europe Driving Footwear Market Value Size & Forecast, by Material Type, US$ Mn, 2016-2026
Table 48: Europe Driving Footwear Market Volume Size & Forecast, by Material Type, ‘000 Units, 2016-2026
Table 49: Europe Driving Footwear Market Value Size & Forecast, by Vehicle Type, US$ Mn, 2016-2026
Table 50: Europe Driving Footwear Market Volume Size & Forecast, by Vehicle Type, ‘000 Units, 2016-2026
Table 51: Europe Driving Footwear Market Value Size & Forecast, by Consumer Group, US$ Mn, 2016-2026
Table 52: Europe Driving Footwear Market Volume Size & Forecast, by Consumer Group, ‘000 Units, 2016-2026
Table 53: Europe Driving Footwear Market Value Size & Forecast, by Distribution Channel, US$ Mn, 2016-2026
Table 54: Europe Driving Footwear Market Volume Size & Forecast, by Distribution Channel, ‘000 Units, 2016-2026
Table 55: Europe Driving Footwear Market Value Size & Forecast, by Country, US$ Mn, 2016-2026
Table 56: Europe Driving Footwear Market Volume Size & Forecast, by Country, ‘000 Units, 2016-2026
Table 57: U.K. Driving Footwear Market Value Size & Forecast, by Product Type, US$ Mn, 2016-2026
Table 58: U.K. Driving Footwear Market Volume Size & Forecast, by Product Type, ‘000 Units, 2016-2026
Table 59: U.K. Driving Footwear Market Value Size & Forecast, by Material Type, US$ Mn, 2016-2026
Table 60: U.K. Driving Footwear Market Volume Size & Forecast, by Material Type, ‘000 Units, 2016-2026
Table 61: U.K. Driving Footwear Market Value Size & Forecast, by Vehicle Type, US$ Mn, 2016-2026
Table 62: U.K. Driving Footwear Market Volume Size & Forecast, by Vehicle Type, ‘000 Units, 2016-2026
Table 63: U.K. Driving Footwear Market Value Size & Forecast, by Consumer Group, US$ Mn, 2016-2026
Table 64: U.K. Driving Footwear Market Value Size & Forecast, by Consumer Group, US$ Mn, 2016-2026
Table 65: U.K. Driving Footwear Market Value Size & Forecast, by Distribution Channel, US$ Mn, 2016-2026
Table 66: U.K. Driving Footwear Market Volume Size & Forecast, by Distribution Channel, ‘000 Units, 2016-2026
Table 67: Germany Driving Footwear Market Value Size & Forecast, by Product Type, US$ Mn, 2016-2026
Table 68: Germany Driving Footwear Market Volume Size & Forecast, by Product Type, ‘000 Units, 2016-2026
Table 69: Germany Driving Footwear Market Value Size & Forecast, by Material Type, US$ Mn, 2016-2026
Table 70: Germany Driving Footwear Market Volume Size & Forecast, by Material Type, ‘000 Units, 2016-2026
Table 71: Germany Driving Footwear Market Value Size & Forecast, by Vehicle Type, US$ Mn, 2016-2026
Table 72: Germany Driving Footwear Market Volume Size & Forecast, by Vehicle Type, ‘000 Units, 2016-2026
Table 73: Germany Driving Footwear Market Value Size & Forecast, by Consumer Group, US$ Mn, 2016-2026
Table 74: Germany Driving Footwear Market Value Size & Forecast, by Consumer Group, US$ Mn, 2016-2026
Table 75: Germany Driving Footwear Market Value Size & Forecast, by Distribution Channel, US$ Mn, 2016-2026
Table 76: Germany Driving Footwear Market Volume Size & Forecast, by Distribution Channel, ‘000 Units, 2016-2026
Table 77: Italy Driving Footwear Market Value Size & Forecast, by Product Type, US$ Mn, 2016-2026
Table 78: Italy Driving Footwear Market Volume Size & Forecast, by Product Type, ‘000 Units, 2016-2026
Table 79: Italy Driving Footwear Market Value Size & Forecast, by Material Type, US$ Mn, 2016-2026
Table 80: Italy Driving Footwear Market Volume Size & Forecast, by Material Type, ‘000 Units, 2016-2026
Table 81: Italy Driving Footwear Market Value Size & Forecast, by Vehicle Type, US$ Mn, 2016-2026
Table 82: Italy Driving Footwear Market Volume Size & Forecast, by Vehicle Type, ‘000 Units, 2016-2026
Table 83: Italy Driving Footwear Market Value Size & Forecast, by Consumer Group, US$ Mn, 2016-2026
Table 84: Italy Driving Footwear Market Value Size & Forecast, by Consumer Group, US$ Mn, 2016-2026
Table 85: Italy Driving Footwear Market Value Size & Forecast, by Distribution Channel, US$ Mn, 2016-2026
Table 86: Italy Driving Footwear Market Volume Size & Forecast, by Distribution Channel, ‘000 Units, 2016-2026
Table 87: France Driving Footwear Market Value Size & Forecast, by Product Type, US$ Mn, 2016-2026
Table 88: France Driving Footwear Market Volume Size & Forecast, by Product Type, ‘000 Units, 2016-2026
Table 89: France Driving Footwear Market Value Size & Forecast, by Material Type, US$ Mn, 2016-2026
Table 90: France Driving Footwear Market Volume Size & Forecast, by Material Type, ‘000 Units, 2016-2026
Table 91: France Driving Footwear Market Value Size & Forecast, by Vehicle Type, US$ Mn, 2016-2026
Table 92: France Driving Footwear Market Volume Size & Forecast, by Vehicle Type, ‘000 Units, 2016-2026
Table 93: France Driving Footwear Market Value Size & Forecast, by Consumer Group, US$ Mn, 2016-2026
Table 94: France Driving Footwear Market Value Size & Forecast, by Consumer Group, US$ Mn, 2016-2026
Table 95: France Driving Footwear Market Value Size & Forecast, by Distribution Channel, US$ Mn, 2016-2026
Table 96: France Driving Footwear Market Volume Size & Forecast, by Distribution Channel, ‘000 Units, 2016-2026
Table 97: Spain Driving Footwear Market Value Size & Forecast, by Product Type, US$ Mn, 2016-2026
Table 98: Spain Driving Footwear Market Volume Size & Forecast, by Product Type, ‘000 Units, 2016-2026
Table 99: Spain Driving Footwear Market Value Size & Forecast, by Material Type, US$ Mn, 2016-2026
Table 100: Spain Driving Footwear Market Volume Size & Forecast, by Material Type, ‘000 Units, 2016-2026
Table 101: Spain Driving Footwear Market Value Size & Forecast, by Vehicle Type, US$ Mn, 2016-2026
Table 102: Spain Driving Footwear Market Volume Size & Forecast, by Vehicle Type, ‘000 Units, 2016-2026
Table 103: Spain Driving Footwear Market Value Size & Forecast, by Consumer Group, US$ Mn, 2016-2026
Table 104: Spain Driving Footwear Market Value Size & Forecast, by Consumer Group, US$ Mn, 2016-2026
Table 105: Spain Driving Footwear Market Value Size & Forecast, by Distribution Channel, US$ Mn, 2016-2026
Table 106: Spain Driving Footwear Market Volume Size & Forecast, by Distribution Channel, ‘000 Units, 2016-2026
Table 107: Asia Pacific Driving Footwear Market Value Size & Forecast, by Product Type, US$ Mn, 2016-2026
Table 108: Asia Pacific Driving Footwear Market Volume Size & Forecast, by Product Type, ‘000 Units, 2016-2026
Table 109: Asia Pacific Driving Footwear Market Value Size & Forecast, by Material Type, US$ Mn, 2016-2026
Table 110: Asia Pacific Driving Footwear Market Volume Size & Forecast, by Material Type, ‘000 Units, 2016-2026
Table 111: Asia Pacific Driving Footwear Market Value Size & Forecast, by Vehicle Type, US$ Mn, 2016-2026
Table 112: Asia Pacific Driving Footwear Market Volume Size & Forecast, by Vehicle Type, ‘000 Units, 2016-2026
Table 113: Asia Pacific Driving Footwear Market Value Size & Forecast, by Consumer Group, US$ Mn, 2016-2026
Table 114: Asia Pacific Driving Footwear Market Volume Size & Forecast, by Consumer Group, ‘000 Units, 2016-2026
Table 115: Asia Pacific Driving Footwear Market Value Size & Forecast, by Distribution Channel, US$ Mn, 2016-2026
Table 116: Asia Pacific Driving Footwear Market Volume Size & Forecast, by Distribution Channel, ‘000 Units, 2016-2026
Table 117: Asia Pacific Driving Footwear Market Value Size & Forecast, by Country, US$ Mn, 2016-2026
Table 118: Asia Pacific Driving Footwear Market Volume Size & Forecast, by Country, ‘000 Units, 2016-2026
Table 119: China Driving Footwear Market Value Size & Forecast, by Product Type, US$ Mn, 2016-2026
Table 120: China Driving Footwear Market Volume Size & Forecast, by Product Type, ‘000 Units, 2016-2026
Table 121: China Driving Footwear Market Value Size & Forecast, by Material Type, US$ Mn, 2016-2026
Table 122: China Driving Footwear Market Volume Size & Forecast, by Material Type, ‘000 Units, 2016-2026
Table 123: China Driving Footwear Market Value Size & Forecast, by Vehicle Type, US$ Mn, 2016-2026
Table 124: China Driving Footwear Market Volume Size & Forecast, by Vehicle Type, ‘000 Units, 2016-2026
Table 125: China Driving Footwear Market Value Size & Forecast, by Consumer Group, US$ Mn, 2016-2026
Table 126: China Driving Footwear Market Value Size & Forecast, by Consumer Group, US$ Mn, 2016-2026
Table 127: China Driving Footwear Market Value Size & Forecast, by Distribution Channel, US$ Mn, 2016-2026
Table 128: China Driving Footwear Market Volume Size & Forecast, by Distribution Channel, ‘000 Units, 2016-2026
Table 129: Japan Driving Footwear Market Value Size & Forecast, by Product Type, US$ Mn, 2016-2026
Table 130: Japan Driving Footwear Market Volume Size & Forecast, by Product Type, ‘000 Units, 2016-2026
Table 131: Japan Driving Footwear Market Value Size & Forecast, by Material Type, US$ Mn, 2016-2026
Table 132: Japan Driving Footwear Market Volume Size & Forecast, by Material Type, ‘000 Units, 2016-2026
Table 133: Japan Driving Footwear Market Value Size & Forecast, by Vehicle Type, US$ Mn, 2016-2026
Table 134: Japan Driving Footwear Market Volume Size & Forecast, by Vehicle Type, ‘000 Units, 2016-2026
Table 135: Japan Driving Footwear Market Value Size & Forecast, by Consumer Group, US$ Mn, 2016-2026
Table 136: Japan Driving Footwear Market Value Size & Forecast, by Consumer Group, US$ Mn, 2016-2026
Table 137: Japan Driving Footwear Market Value Size & Forecast, by Distribution Channel, US$ Mn, 2016-2026
Table 138: Japan Driving Footwear Market Volume Size & Forecast, by Distribution Channel, ‘000 Units, 2016-2026
Table 139: India Driving Footwear Market Value Size & Forecast, by Product Type, US$ Mn, 2016-2026
Table 140: India Driving Footwear Market Volume Size & Forecast, by Product Type, ‘000 Units, 2016-2026
Table 141: India Driving Footwear Market Value Size & Forecast, by Material Type, US$ Mn, 2016-2026
Table 142: India Driving Footwear Market Volume Size & Forecast, by Material Type, ‘000 Units, 2016-2026
Table 143: India Driving Footwear Market Value Size & Forecast, by Vehicle Type, US$ Mn, 2016-2026
Table 144: India Driving Footwear Market Volume Size & Forecast, by Vehicle Type, ‘000 Units, 2016-2026
Table 145: India Driving Footwear Market Value Size & Forecast, by Consumer Group, US$ Mn, 2016-2026
Table 146: India Driving Footwear Market Value Size & Forecast, by Consumer Group, US$ Mn, 2016-2026
Table 147: India Driving Footwear Market Value Size & Forecast, by Distribution Channel, US$ Mn, 2016-2026
Table 148: India Driving Footwear Market Volume Size & Forecast, by Distribution Channel, ‘000 Units, 2016-2026
Table 149: MEA Driving Footwear Market Value Size & Forecast, by Product Type, US$ Mn, 2016-2026
Table 150: MEA Driving Footwear Market Volume Size & Forecast, by Product Type, ‘000 Units, 2016-2026
Table 151: MEA Driving Footwear Market Value Size & Forecast, by Material Type, US$ Mn, 2016-2026
Table 152: MEA Driving Footwear Market Volume Size & Forecast, by Material Type, ‘000 Units, 2016-2026
Table 153: MEA Driving Footwear Market Value Size & Forecast, by Vehicle Type, US$ Mn, 2016-2026
Table 154: MEA Driving Footwear Market Volume Size & Forecast, by Vehicle Type, ‘000 Units, 2016-2026
Table 155: MEA Driving Footwear Market Value Size & Forecast, by Consumer Group, US$ Mn, 2016-2026
Table 156: MEA Driving Footwear Market Volume Size & Forecast, by Consumer Group, ‘000 Units, 2016-2026
Table 157: MEA Driving Footwear Market Value Size & Forecast, by Distribution Channel, US$ Mn, 2016-2026
Table 158: MEA Driving Footwear Market Volume Size & Forecast, by Distribution Channel, ‘000 Units, 2016-2026
Table 159: MEA Driving Footwear Market Value Size & Forecast, by Country, US$ Mn, 2016-2026
Table 160: MEA Driving Footwear Market Volume Size & Forecast, by Country, ‘000 Units, 2016-2026
Table 161: South America Driving Footwear Market Value Size & Forecast, by Product Type, US$ Mn, 2016-2026
Table 162: South America Driving Footwear Market Volume Size & Forecast, by Product Type, ‘000 Units, 2016-2026
Table 163: South America Driving Footwear Market Value Size & Forecast, by Material Type, US$ Mn, 2016-2026
Table 164: South America Driving Footwear Market Volume Size & Forecast, by Material Type, ‘000 Units, 2016-2026
Table 165: South America Driving Footwear Market Value Size & Forecast, by Vehicle Type, US$ Mn, 2016-2026
Table 166: South America Driving Footwear Market Volume Size & Forecast, by Vehicle Type, ‘000 Units, 2016-2026
Table 167: South America Driving Footwear Market Value Size & Forecast, by Consumer Group, US$ Mn, 2016-2026
Table 168: South America Driving Footwear Market Volume Size & Forecast, by Consumer Group, ‘000 Units, 2016-2026
Table 169: South America Driving Footwear Market Value Size & Forecast, by Distribution Channel, US$ Mn, 2016-2026
Table 170: South America Driving Footwear Market Volume Size & Forecast, by Distribution Channel, ‘000 Units, 2016-2026
Table 171: South America Driving Footwear Market Value Size & Forecast, by Country, US$ Mn, 2016-2026
Table 172: South America Driving Footwear Market Volume Size & Forecast, by Country, ‘000 Units, 2016-2026
Table 173: Brazil Driving Footwear Market Value Size & Forecast, by Product Type, US$ Mn, 2016-2026
Table 174: Brazil Driving Footwear Market Volume Size & Forecast, by Product Type, ‘000 Units, 2016-2026
Table 175: Brazil Driving Footwear Market Value Size & Forecast, by Material Type, US$ Mn, 2016-2026
Table 176: Brazil Driving Footwear Market Volume Size & Forecast, by Material Type, ‘000 Units, 2016-2026
Table 177: Brazil Driving Footwear Market Value Size & Forecast, by Vehicle Type, US$ Mn, 2016-2026
Table 178: Brazil Driving Footwear Market Volume Size & Forecast, by Vehicle Type, ‘000 Units, 2016-2026
Table 179: Brazil Driving Footwear Market Value Size & Forecast, by Consumer Group, US$ Mn, 2016-2026
Table 180: Brazil Driving Footwear Market Value Size & Forecast, by Consumer Group, US$ Mn, 2016-2026
Table 181: Brazil Driving Footwear Market Value Size & Forecast, by Distribution Channel, US$ Mn, 2016-2026
Table 182: Brazil Driving Footwear Market Volume Size & Forecast, by Distribution Channel, ‘000 Units, 2016-2026
List of Figures
Figure 1: Global Driving Footwear Market Value Share (Value %) by Product Type, 2017
Figure 2: Global Driving Footwear Market Value Share (Value %) by Material Type, 2017
Figure 3: Global Driving Footwear Market Value Share (Value %) by Vehicle Type, 2017
Figure 4: Global Driving Footwear Market Value Share (Value %) by Consumer Group, 2017
Figure 5: Global Driving Footwear Market Value Share (Value %) by Distribution Channel, 2017
Figure 6: Global Driving Footwear Market Volume Share (%), by Product Type, 2016-2026
Figure 7: Global Driving Footwear Market, by Product Type, Incremental Opportunity Analysis, US$ Mn
Figure 8: Global Driving Footwear Market Value Share (%), by Product Type, 2016-2026
Figure 9: Global Driving Footwear Market Volume Share (%), by Material Type, 2016-2026
Figure 10: Global Driving Footwear Market, by Material Type, Incremental Opportunity Analysis, US$ Mn
Figure 11: Global Driving Footwear Market Value Share (%), by Material Type, 2016-2026
Figure 12: Global Driving Footwear Market Volume Share (%), by Vehicle Type, 2016-2026
Figure 13: Global Driving Footwear Market, by Vehicle Type, Incremental Opportunity Analysis, US$ Mn
Figure 14: Global Driving Footwear Market Value Share (%), by Vehicle Type, 2016-2026
Figure 15: Global Driving Footwear Market Volume Share (%), by Consumer Group, 2016-2026
Figure 16: Global Driving Footwear Market, by Consumer Group, Incremental Opportunity Analysis, US$ Mn
Figure 17: Global Driving Footwear Market Value Share (%), by Consumer Group, 2016-2026
Figure 18: Global Driving Footwear Market Volume Share (%), by Distribution Channel, 2016-2026
Figure 19: Global Driving Footwear Market, by Distribution Channel, Incremental Opportunity Analysis, US$ Mn
Figure 20: Global Driving Footwear Market Value Share (%), by Distribution Channel, 2016-2026
Figure 21: Global Driving Footwear Market Volume Share (%), by Region, 2016-2026
Figure 22: Global Driving Footwear Market, by Region, Incremental Opportunity Analysis, US$ Mn
Figure 23: Global Driving Footwear Market Value Share (%), by Region, 2016-2026
Figure 24: North America Driving Footwear Market Volume Share (%), by Product Type, 2016-2026
Figure 25: North America Driving Footwear Market, by Product Type, Incremental Opportunity Analysis, US$ Mn
Figure 26: North America Driving Footwear Market Value Share (%), by Product Type, 2016-2026
Figure 27: North America Driving Footwear Market Volume Share (%), by Material Type, 2016-2026
Figure 28: North America Driving Footwear Market, by Material Type, Incremental Opportunity Analysis, US$ Mn
Figure 29: North America Driving Footwear Market Value Share (%), by Material Type, 2016-2026
Figure 30: North America Driving Footwear Market Volume Share (%), by Vehicle Type, 2016-2026
Figure 31: North America Driving Footwear Market, by Vehicle Type, Incremental Opportunity Analysis, US$ Mn
Figure 32: North America Driving Footwear Market Value Share (%), by Vehicle Type, 2016-2026
Figure 33: North America Driving Footwear Market Volume Share (%), by Consumer Group, 2016-2026
Figure 34: North America Driving Footwear Market, by Consumer Group, Incremental Opportunity Analysis, US$ Mn
Figure 35: North America Driving Footwear Market Value Share (%), by Consumer Group, 2016-2026
Figure 36: North America Driving Footwear Market Volume Share (%), by Distribution Channel, 2016-2026
Figure 37: North America Driving Footwear Market, by Distribution Channel, Incremental Opportunity Analysis, US$ Mn
Figure 38: North America Driving Footwear Market Value Share (%), by Distribution Channel, 2016-2026
Figure 39: North America Driving Footwear Market Volume Share (%), by Country, 2016-2026
Figure 40: North America Driving Footwear Market, by Country, Incremental Opportunity Analysis, US$ Mn
Figure 41: North America Driving Footwear Market Value Share (%), by Country, 2016-2026
Figure 42: U.S. Driving Footwear Market Volume Share (%), by Product Type, 2016-2026
Figure 43: U.S. Driving Footwear Market, by Product Type, Incremental Opportunity Analysis, US$ Mn
Figure 44: U.S. Driving Footwear Market Value Share (%), by Product Type, 2016-2026
Figure 45: U.S. Driving Footwear Market Volume Share (%), by Material Type, 2016-2026
Figure 46: U.S. Driving Footwear Market, by Material Type, Incremental Opportunity Analysis, US$ Mn
Figure 47: U.S. Driving Footwear Market Value Share (%), by Material Type, 2016-2026
Figure 48: U.S. Driving Footwear Market Volume Share (%), by Vehicle Type, 2016-2026
Figure 49: U.S. Driving Footwear Market, by Vehicle Type, Incremental Opportunity Analysis, US$ Mn
Figure 50: U.S. Driving Footwear Market Value Share (%), by Vehicle Type, 2016-2026
Figure 51: U.S. Driving Footwear Market Volume Share (%), by Consumer Group, 2016-2026
Figure 52: U.S. Driving Footwear Market, by Consumer Group, Incremental Opportunity Analysis, US$ Mn
Figure 53: U.S. Driving Footwear Market Value Share (%), by Consumer Group, 2016-2026
Figure 54: U.S. Driving Footwear Market Volume Share (%), by Distribution Channel, 2016-2026
Figure 55: U.S. Driving Footwear Market, by Distribution Channel, Incremental Opportunity Analysis, US$ Mn
Figure 56: U.S. Driving Footwear Market Value Share (%), by Distribution Channel, 2016-2026
Figure 57: Canada Driving Footwear Market Volume Share (%), by Product Type, 2016-2026
Figure 58: Canada Driving Footwear Market, by Product Type, Incremental Opportunity Analysis, US$ Mn
Figure 59: Canada Driving Footwear Market Value Share (%), by Product Type, 2016-2026
Figure 60: Canada Driving Footwear Market Volume Share (%), by Material Type, 2016-2026
Figure 61: Canada Driving Footwear Market, by Material Type, Incremental Opportunity Analysis, US$ Mn
Figure 62: Canada Driving Footwear Market Value Share (%), by Material Type, 2016-2026
Figure 63: Canada Driving Footwear Market Volume Share (%), by Vehicle Type, 2016-2026
Figure 64: Canada Driving Footwear Market, by Vehicle Type, Incremental Opportunity Analysis, US$ Mn
Figure 65: Canada Driving Footwear Market Value Share (%), by Vehicle Type, 2016-2026
Figure 66: Canada Driving Footwear Market Volume Share (%), by Consumer Group, 2016-2026
Figure 67: Canada Driving Footwear Market, by Consumer Group, Incremental Opportunity Analysis, US$ Mn
Figure 68: Canada Driving Footwear Market Value Share (%), by Consumer Group, 2016-2026
Figure 69: Canada Driving Footwear Market Volume Share (%), by Distribution Channel, 2016-2026
Figure 70: Canada Driving Footwear Market, by Distribution Channel, Incremental Opportunity Analysis, US$ Mn
Figure 71: Canada Driving Footwear Market Value Share (%), by Distribution Channel, 2016-2026
Figure 72: Europe Driving Footwear Market Volume Share (%), by Product Type, 2016-2026
Figure 73: Europe Driving Footwear Market, by Product Type, Incremental Opportunity Analysis, US$ Mn
Figure 74: Europe Driving Footwear Market Value Share (%), by Product Type, 2016-2026
Figure 75: Europe Driving Footwear Market Volume Share (%), by Material Type, 2016-2026
Figure 76: Europe Driving Footwear Market, by Material Type, Incremental Opportunity Analysis, US$ Mn
Figure 77: Europe Driving Footwear Market Value Share (%), by Material Type, 2016-2026
Figure 78: Europe Driving Footwear Market Volume Share (%), by Vehicle Type, 2016-2026
Figure 79: Europe Driving Footwear Market, by Vehicle Type, Incremental Opportunity Analysis, US$ Mn
Figure 80: Europe Driving Footwear Market Value Share (%), by Vehicle Type, 2016-2026
Figure 81: Europe Driving Footwear Market Volume Share (%), by Consumer Group, 2016-2026
Figure 82: Europe Driving Footwear Market, by Consumer Group, Incremental Opportunity Analysis, US$ Mn
Figure 83: Europe Driving Footwear Market Value Share (%), by Consumer Group, 2016-2026
Figure 84: Europe Driving Footwear Market Volume Share (%), by Distribution Channel, 2016-2026
Figure 85: Europe Driving Footwear Market, by Distribution Channel, Incremental Opportunity Analysis, US$ Mn
Figure 86: Europe Driving Footwear Market Value Share (%), by Distribution Channel, 2016-2026
Figure 87: Europe Driving Footwear Market Volume Share (%), by Country, 2016-2026
Figure 88: Europe Driving Footwear Market, by Country, Incremental Opportunity Analysis, US$ Mn
Figure 89: Europe Driving Footwear Market Value Share (%), by Country, 2016-2026
Figure 90: U.K. Driving Footwear Market Volume Share (%), by Product Type, 2016-2026
Figure 91: U.K. Driving Footwear Market, by Product Type, Incremental Opportunity Analysis, US$ Mn
Figure 92: U.K. Driving Footwear Market Value Share (%), by Product Type, 2016-2026
Figure 93: U.K. Driving Footwear Market Volume Share (%), by Material Type, 2016-2026
Figure 94: U.K. Driving Footwear Market, by Material Type, Incremental Opportunity Analysis, US$ Mn
Figure 95: U.K. Driving Footwear Market Value Share (%), by Material Type, 2016-2026
Figure 96: U.K. Driving Footwear Market Volume Share (%), by Vehicle Type, 2016-2026
Figure 97: U.K. Driving Footwear Market, by Vehicle Type, Incremental Opportunity Analysis, US$ Mn
Figure 98: U.K. Driving Footwear Market Value Share (%), by Vehicle Type, 2016-2026
Figure 99: U.K. Driving Footwear Market Volume Share (%), by Consumer Group, 2016-2026
Figure 100: U.K. Driving Footwear Market, by Consumer Group, Incremental Opportunity Analysis, US$ Mn
Figure 101: U.K. Driving Footwear Market Value Share (%), by Consumer Group, 2016-2026
Figure 102: U.K. Driving Footwear Market Volume Share (%), by Distribution Channel, 2016-2026
Figure 103: U.K. Driving Footwear Market, by Distribution Channel, Incremental Opportunity Analysis, US$ Mn
Figure 104: U.K. Driving Footwear Market Value Share (%), by Distribution Channel, 2016-2026
Figure 105: Germany Driving Footwear Market Volume Share (%), by Product Type, 2016-2026
Figure 106: Germany Driving Footwear Market, by Product Type, Incremental Opportunity Analysis, US$ Mn
Figure 107: Germany Driving Footwear Market Value Share (%), by Product Type, 2016-2026
Figure 108: Germany Driving Footwear Market Volume Share (%), by Material Type, 2016-2026
Figure 109: Germany Driving Footwear Market, by Material Type, Incremental Opportunity Analysis, US$ Mn
Figure 110: Germany Driving Footwear Market Value Share (%), by Material Type, 2016-2026
Figure 111: Germany Driving Footwear Market Volume Share (%), by Vehicle Type, 2016-2026
Figure 112: Germany Driving Footwear Market, by Vehicle Type, Incremental Opportunity Analysis, US$ Mn
Figure 113: Germany Driving Footwear Market Value Share (%), by Vehicle Type, 2016-2026
Figure 114: Germany Driving Footwear Market Volume Share (%), by Consumer Group, 2016-2026
Figure 115: Germany Driving Footwear Market, by Consumer Group, Incremental Opportunity Analysis, US$ Mn
Figure 116: Germany Driving Footwear Market Value Share (%), by Consumer Group, 2016-2026
Figure 117: Germany Driving Footwear Market Volume Share (%), by Distribution Channel, 2016-2026
Figure 118: Germany Driving Footwear Market, by Distribution Channel, Incremental Opportunity Analysis, US$ Mn
Figure 119: Germany Driving Footwear Market Value Share (%), by Distribution Channel, 2016-2026
Figure 120: Italy Driving Footwear Market Volume Share (%), by Product Type, 2016-2026
Figure 121: Italy Driving Footwear Market, by Product Type, Incremental Opportunity Analysis, US$ Mn
Figure 122: Italy Driving Footwear Market Value Share (%), by Product Type, 2016-2026
Figure 123: Italy Driving Footwear Market Volume Share (%), by Material Type, 2016-2026
Figure 124: Italy Driving Footwear Market, by Material Type, Incremental Opportunity Analysis, US$ Mn
Figure 125: Italy Driving Footwear Market Value Share (%), by Material Type, 2016-2026
Figure 126: Italy Driving Footwear Market Volume Share (%), by Vehicle Type, 2016-2026
Figure 127: Italy Driving Footwear Market, by Vehicle Type, Incremental Opportunity Analysis, US$ Mn
Figure 128: Italy Driving Footwear Market Value Share (%), by Vehicle Type, 2016-2026
Figure 129: Italy Driving Footwear Market Volume Share (%), by Consumer Group, 2016-2026
Figure 130: Italy Driving Footwear Market, by Consumer Group, Incremental Opportunity Analysis, US$ Mn
Figure 131: Italy Driving Footwear Market Value Share (%), by Consumer Group, 2016-2026
Figure 132: Italy Driving Footwear Market Volume Share (%), by Distribution Channel, 2016-2026
Figure 133: Italy Driving Footwear Market, by Distribution Channel, Incremental Opportunity Analysis, US$ Mn
Figure 134: Italy Driving Footwear Market Value Share (%), by Distribution Channel, 2016-2026
Figure 135: France Driving Footwear Market Volume Share (%), by Product Type, 2016-2026
Figure 136: France Driving Footwear Market, by Product Type, Incremental Opportunity Analysis, US$ Mn
Figure 137: France Driving Footwear Market Value Share (%), by Product Type, 2016-2026
Figure 138: France Driving Footwear Market Volume Share (%), by Material Type, 2016-2026
Figure 139: France Driving Footwear Market, by Material Type, Incremental Opportunity Analysis, US$ Mn
Figure 140: France Driving Footwear Market Value Share (%), by Material Type, 2016-2026
Figure 141: France Driving Footwear Market Volume Share (%), by Vehicle Type, 2016-2026
Figure 142: France Driving Footwear Market, by Vehicle Type, Incremental Opportunity Analysis, US$ Mn
Figure 143: France Driving Footwear Market Value Share (%), by Vehicle Type, 2016-2026
Figure 144: France Driving Footwear Market Volume Share (%), by Consumer Group, 2016-2026
Figure 145: France Driving Footwear Market, by Consumer Group, Incremental Opportunity Analysis, US$ Mn
Figure 146: France Driving Footwear Market Value Share (%), by Consumer Group, 2016-2026
Figure 147: France Driving Footwear Market Volume Share (%), by Distribution Channel, 2016-2026
Figure 148: France Driving Footwear Market, by Distribution Channel, Incremental Opportunity Analysis, US$ Mn
Figure 149: France Driving Footwear Market Value Share (%), by Distribution Channel, 2016-2026
Figure 150: Spain Driving Footwear Market Volume Share (%), by Product Type, 2016-2026
Figure 151: Spain Driving Footwear Market, by Product Type, Incremental Opportunity Analysis, US$ Mn
Figure 152: Spain Driving Footwear Market Value Share (%), by Product Type, 2016-2026
Figure 153: Spain Driving Footwear Market Volume Share (%), by Material Type, 2016-2026
Figure 154: Spain Driving Footwear Market, by Material Type, Incremental Opportunity Analysis, US$ Mn
Figure 155: Spain Driving Footwear Market Value Share (%), by Material Type, 2016-2026
Figure 156: Spain Driving Footwear Market Volume Share (%), by Vehicle Type, 2016-2026
Figure 157: Spain Driving Footwear Market, by Vehicle Type, Incremental Opportunity Analysis, US$ Mn
Figure 158: Spain Driving Footwear Market Value Share (%), by Vehicle Type, 2016-2026
Figure 159: Spain Driving Footwear Market Volume Share (%), by Consumer Group, 2016-2026
Figure 160: Spain Driving Footwear Market, by Consumer Group, Incremental Opportunity Analysis, US$ Mn
Figure 161: Spain Driving Footwear Market Value Share (%), by Consumer Group, 2016-2026
Figure 162: Spain Driving Footwear Market Volume Share (%), by Distribution Channel, 2016-2026
Figure 163: Spain Driving Footwear Market, by Distribution Channel, Incremental Opportunity Analysis, US$ Mn
Figure 164: Spain Driving Footwear Market Value Share (%), by Distribution Channel, 2016-2026
Figure 165: Asia Pacific Driving Footwear Market Volume Share (%), by Product Type, 2016-2026
Figure 166: Asia Pacific Driving Footwear Market, by Product Type, Incremental Opportunity Analysis, US$ Mn
Figure 167: Asia Pacific Driving Footwear Market Value Share (%), by Product Type, 2016-2026
Figure 168: Asia Pacific Driving Footwear Market Volume Share (%), by Material Type, 2016-2026
Figure 169: Asia Pacific Driving Footwear Market, by Material Type, Incremental Opportunity Analysis, US$ Mn
Figure 170: Asia Pacific Driving Footwear Market Value Share (%), by Material Type, 2016-2026
Figure 171: Asia Pacific Driving Footwear Market Volume Share (%), by Vehicle Type, 2016-2026
Figure 172: Asia Pacific Driving Footwear Market, by Vehicle Type, Incremental Opportunity Analysis, US$ Mn
Figure 173: Asia Pacific Driving Footwear Market Value Share (%), by Vehicle Type, 2016-2026
Figure 174: Asia Pacific Driving Footwear Market Volume Share (%), by Consumer Group, 2016-2026
Figure 175: Asia Pacific Driving Footwear Market, by Consumer Group, Incremental Opportunity Analysis, US$ Mn
Figure 176: Asia Pacific Driving Footwear Market Value Share (%), by Consumer Group, 2016-2026
Figure 177: Asia Pacific Driving Footwear Market Volume Share (%), by Distribution Channel, 2016-2026
Figure 178: Asia Pacific Driving Footwear Market, by Distribution Channel, Incremental Opportunity Analysis, US$ Mn
Figure 179: Asia Pacific Driving Footwear Market Value Share (%), by Distribution Channel, 2016-2026
Figure 180: Asia Pacific Driving Footwear Market Volume Share (%), by Country, 2016-2026
Figure 181: Asia Pacific Driving Footwear Market, by Country, Incremental Opportunity Analysis, US$ Mn
Figure 182: Asia Pacific Driving Footwear Market Value Share (%), by Country, 2016-2026
Figure 183: China Driving Footwear Market Volume Share (%), by Product Type, 2016-2026
Figure 184: China Driving Footwear Market, by Product Type, Incremental Opportunity Analysis, US$ Mn
Figure 185: China Driving Footwear Market Value Share (%), by Product Type, 2016-2026
Figure 186: China Driving Footwear Market Volume Share (%), by Material Type, 2016-2026
Figure 187: China Driving Footwear Market, by Material Type, Incremental Opportunity Analysis, US$ Mn
Figure 188: China Driving Footwear Market Value Share (%), by Material Type, 2016-2026
Figure 189: China Driving Footwear Market Volume Share (%), by Vehicle Type, 2016-2026
Figure 190: China Driving Footwear Market, by Vehicle Type, Incremental Opportunity Analysis, US$ Mn
Figure 191: China Driving Footwear Market Value Share (%), by Vehicle Type, 2016-2026
Figure 192: China Driving Footwear Market Volume Share (%), by Consumer Group, 2016-2026
Figure 193: China Driving Footwear Market, by Consumer Group, Incremental Opportunity Analysis, US$ Mn
Figure 194: China Driving Footwear Market Value Share (%), by Consumer Group, 2016-2026
Figure 195: China Driving Footwear Market Volume Share (%), by Distribution Channel, 2016-2026
Figure 196: China Driving Footwear Market, by Distribution Channel, Incremental Opportunity Analysis, US$ Mn
Figure 197: China Driving Footwear Market Value Share (%), by Distribution Channel, 2016-2026
Figure 198: Japan Driving Footwear Market Volume Share (%), by Product Type, 2016-2026
Figure 199: Japan Driving Footwear Market, by Product Type, Incremental Opportunity Analysis, US$ Mn
Figure 200: Japan Driving Footwear Market Value Share (%), by Product Type, 2016-2026
Figure 201: Japan Driving Footwear Market Volume Share (%), by Material Type, 2016-2026
Figure 202: Japan Driving Footwear Market, by Material Type, Incremental Opportunity Analysis, US$ Mn
Figure 203: Japan Driving Footwear Market Value Share (%), by Material Type, 2016-2026
Figure 204: Japan Driving Footwear Market Volume Share (%), by Vehicle Type, 2016-2026
Figure 205: Japan Driving Footwear Market, by Vehicle Type, Incremental Opportunity Analysis, US$ Mn
Figure 206: Japan Driving Footwear Market Value Share (%), by Vehicle Type, 2016-2026
Figure 207: Japan Driving Footwear Market Volume Share (%), by Consumer Group, 2016-2026
Figure 208: Japan Driving Footwear Market, by Consumer Group, Incremental Opportunity Analysis, US$ Mn
Figure 209: Japan Driving Footwear Market Value Share (%), by Consumer Group, 2016-2026
Figure 210: Japan Driving Footwear Market Volume Share (%), by Distribution Channel, 2016-2026
Figure 211: Japan Driving Footwear Market, by Distribution Channel, Incremental Opportunity Analysis, US$ Mn
Figure 212: Japan Driving Footwear Market Value Share (%), by Distribution Channel, 2016-2026
Figure 213: India Driving Footwear Market Volume Share (%), by Product Type, 2016-2026
Figure 214: India Driving Footwear Market, by Product Type, Incremental Opportunity Analysis, US$ Mn
Figure 215: India Driving Footwear Market Value Share (%), by Product Type, 2016-2026
Figure 216: India Driving Footwear Market Volume Share (%), by Material Type, 2016-2026
Figure 217: India Driving Footwear Market, by Material Type, Incremental Opportunity Analysis, US$ Mn
Figure 218: India Driving Footwear Market Value Share (%), by Material Type, 2016-2026
Figure 219: India Driving Footwear Market Volume Share (%), by Vehicle Type, 2016-2026
Figure 220: India Driving Footwear Market, by Vehicle Type, Incremental Opportunity Analysis, US$ Mn
Figure 221: India Driving Footwear Market Value Share (%), by Vehicle Type, 2016-2026
Figure 222: India Driving Footwear Market Volume Share (%), by Consumer Group, 2016-2026
Figure 223: India Driving Footwear Market, by Consumer Group, Incremental Opportunity Analysis, US$ Mn
Figure 224: India Driving Footwear Market Value Share (%), by Consumer Group, 2016-2026
Figure 225: India Driving Footwear Market Volume Share (%), by Distribution Channel, 2016-2026
Figure 226: India Driving Footwear Market, by Distribution Channel, Incremental Opportunity Analysis, US$ Mn
Figure 227: India Driving Footwear Market Value Share (%), by Distribution Channel, 2016-2026
Figure 228: MEA Driving Footwear Market Volume Share (%), by Product Type, 2016-2026
Figure 229: MEA Driving Footwear Market, by Product Type, Incremental Opportunity Analysis, US$ Mn
Figure 230: MEA Driving Footwear Market Value Share (%), by Product Type, 2016-2026
Figure 231: MEA Driving Footwear Market Volume Share (%), by Material Type, 2016-2026
Figure 232: MEA Driving Footwear Market, by Material Type, Incremental Opportunity Analysis, US$ Mn
Figure 233: MEA Driving Footwear Market Value Share (%), by Material Type, 2016-2026
Figure 234: MEA Driving Footwear Market Volume Share (%), by Vehicle Type, 2016-2026
Figure 235: MEA Driving Footwear Market, by Vehicle Type, Incremental Opportunity Analysis, US$ Mn
Figure 236: MEA Driving Footwear Market Value Share (%), by Vehicle Type, 2016-2026
Figure 237: MEA Driving Footwear Market Volume Share (%), by Consumer Group, 2016-2026
Figure 238: MEA Driving Footwear Market, by Consumer Group, Incremental Opportunity Analysis, US$ Mn
Figure 239: MEA Driving Footwear Market Value Share (%), by Consumer Group, 2016-2026
Figure 240: MEA Driving Footwear Market Volume Share (%), by Distribution Channel, 2016-2026
Figure 241: MEA Driving Footwear Market, by Distribution Channel, Incremental Opportunity Analysis, US$ Mn
Figure 242: MEA Driving Footwear Market Value Share (%), by Distribution Channel, 2016-2026
Figure 243: MEA Driving Footwear Market Volume Share (%), by Country, 2016-2026
Figure 244: MEA Driving Footwear Market, by Country, Incremental Opportunity Analysis, US$ Mn
Figure 245: MEA Driving Footwear Market Value Share (%), by Country, 2016-2026
Figure 246: South America Driving Footwear Market Volume Share (%), by Product Type, 2016-2026
Figure 247: South America Driving Footwear Market, by Product Type, Incremental Opportunity Analysis, US$ Mn
Figure 248: South America Driving Footwear Market Value Share (%), by Product Type, 2016-2026
Figure 249: South America Driving Footwear Market Volume Share (%), by Material Type, 2016-2026
Figure 250: South America Driving Footwear Market, by Material Type, Incremental Opportunity Analysis, US$ Mn
Figure 251: South America Driving Footwear Market Value Share (%), by Material Type, 2016-2026
Figure 252: South America Driving Footwear Market Volume Share (%), by Vehicle Type, 2016-2026
Figure 253: South America Driving Footwear Market, by Vehicle Type, Incremental Opportunity Analysis, US$ Mn
Figure 254: South America Driving Footwear Market Value Share (%), by Vehicle Type, 2016-2026
Figure 255: South America Driving Footwear Market Volume Share (%), by Consumer Group, 2016-2026
Figure 256: South America Driving Footwear Market, by Consumer Group, Incremental Opportunity Analysis, US$ Mn
Figure 257: South America Driving Footwear Market Value Share (%), by Consumer Group, 2016-2026
Figure 258: South America Driving Footwear Market Volume Share (%), by Distribution Channel, 2016-2026
Figure 259: South America Driving Footwear Market, by Distribution Channel, Incremental Opportunity Analysis, US$ Mn
Figure 260: South America Driving Footwear Market Value Share (%), by Distribution Channel, 2016-2026
Figure 261: South America Driving Footwear Market Volume Share (%), by Country, 2016-2026
Figure 262: South America Driving Footwear Market, by Country, Incremental Opportunity Analysis, US$ Mn
Figure 263: South America Driving Footwear Market Value Share (%), by Country, 2016-2026
Figure 264: Brazil Driving Footwear Market Volume Share (%), by Product Type, 2016-2026
Figure 265: Brazil Driving Footwear Market, by Product Type, Incremental Opportunity Analysis, US$ Mn
Figure 266: Brazil Driving Footwear Market Value Share (%), by Product Type, 2016-2026
Figure 267: Brazil Driving Footwear Market Volume Share (%), by Material Type, 2016-2026
Figure 268: Brazil Driving Footwear Market, by Material Type, Incremental Opportunity Analysis, US$ Mn
Figure 269: Brazil Driving Footwear Market Value Share (%), by Material Type, 2016-2026
Figure 270: Brazil Driving Footwear Market Volume Share (%), by Vehicle Type, 2016-2026
Figure 271: Brazil Driving Footwear Market, by Vehicle Type, Incremental Opportunity Analysis, US$ Mn
Figure 272: Brazil Driving Footwear Market Value Share (%), by Vehicle Type, 2016-2026
Figure 273: Brazil Driving Footwear Market Volume Share (%), by Consumer Group, 2016-2026
Figure 274: Brazil Driving Footwear Market, by Consumer Group, Incremental Opportunity Analysis, US$ Mn
Figure 275: Brazil Driving Footwear Market Value Share (%), by Consumer Group, 2016-2026
Figure 276: Brazil Driving Footwear Market Volume Share (%), by Distribution Channel, 2016-2026
Figure 277: Brazil Driving Footwear Market, by Distribution Channel, Incremental Opportunity Analysis, US$ Mn
Figure 278: Brazil Driving Footwear Market Value Share (%), by Distribution Channel, 2016-2026
Copyright © Transparency Market Research, Inc. All Rights reserved
Trust Online

Driving Footwear Market