
Reports
Reports
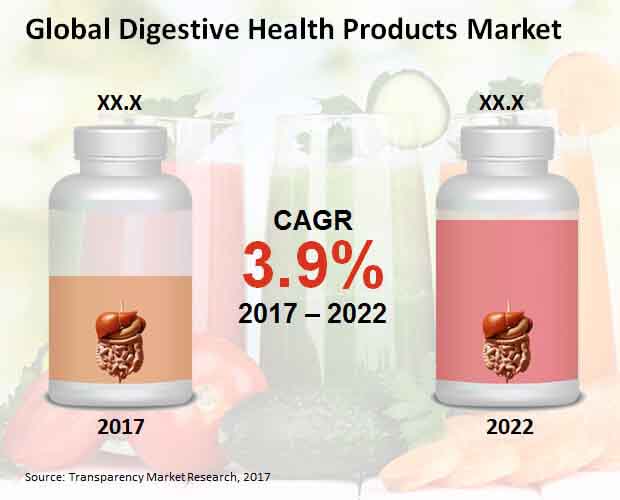
Digestive Health Products Market: Snapshot
Digestive health products are turning into an inexorably imperative piece of the healthcare situation in various districts because of the expanding mindfulness about the significance of digestive healthcare and the commitment given by digestive health products in keeping up the general health of a person. Digestive health products help keep up a healthy dimension of gastric acids and gut vegetation to empower complete absorption of different supplements and a healthy digestive tract. Health of the digestive tract is a fundamental marker of the person's general prosperity, because of the extensive effect it has on different other frameworks working in the body.
The development of a well-educated and prosperous shopper statistic in created locales has been a key driver for the global digestive health products market as of late. Endeavors by healthcare offices to expand mindfulness about digestive health have additionally helped the global digestive health products market, particularly in created nations. Urban territories are probably going to remain the key interest places for the digestive health products market in the coming a very long time because of the higher extra cash of the developing urban working class, making this a key driver for the global digestive health products market.
The global digestive health products market collected revenue of US$1,130.4 mn in 2014 and is expected to attain a value of US$3,381.8 mn by the 2023-end. The market is swelling is expected to expand at a CAGR of 13.0% over the forecast period from 2015 to 2023. The global polylactic acid market collected revenue of US$400.1 mn in 2014 and is expected to reach a value of US$1,358.1 mn by 2023-end. The market is expected to expand at a CAGR of 14.6% over the forecast period.
Biodegradable Plastics to be Largest Segment in the digestive health products Market
Based on the end use, the digestive health products market is segmented into food and beverage, personal care, pharmaceutical, biodegradable plastics, and others (including detergents). Of these, the biodegradable plastics segment accounted for the leading share with more than 35% in the overall market in 2014. The market is expected to expand with a CAGR of 13.5% over the forecast period from 2015 to 2023. Lactic acid is extensively used in personal care products and in the food & beverages industry.
Based on the end use, the digestive health products market is segmented into packaging, textile, electronics, automotive, biomedical, and others (including printing). Among these, the packaging segment procured leading share in an end-use segment by holding more than 45% share in the revenue of the global polylactic acid market in 2014. This is attributable to the growing demand from electronics, biomedical, textiles, and automotive end-use segments.
North America to be Leading Region in digestive health products Market
On the geographical front, the digestive health products market are segmented into North America, Latin America, Europe, Asia Pacific, And the Middle East & Africa. Of these, North America held the dominant share of the global lactic acid market in 2014. This growth of the digestive health products market in the region is attributable to the extensive demand for bioplastics. However, the Asia Pacific dominated the digestive health products market and is expected to witness lucrative opportunities for growth of the market in the coming years.
High Demand for Nutritional Additives to Boost Digestive Health Products Market
One of the main factors likely to drive growth of the global digestive health products market is the rising demand for fortifying and nutritional additives. Growing public understanding about probiotics' beneficial effects is anticipated to boost demand for digestive health products in the years to come. Intestinal flora is believed to be regulated by yoghurt as well as other probiotics. Cardiovascular diseases are thought to be cured by products high in Omega-3 and some other fatty acids. Carotenoids, like beta-carotene, are thought to have anti-carcinogenic qualities that assist in the mitigation of oxidative stress-related diseases like cancer.
Digestive health products comprise a wide range of items designed to enhance the function of the human digestive tract. As a consequence of their delicate nature, different components of the digestive tract require daily maintenance, and preserving their wellbeing by the inclusion of digestive health products has emerged as a major wellness trend in many parts of the world. Digestive health products are mainly intended to maintain a healthy amount of stomach acid and refill healthy gut bacteria, which play an important role in the digestion and absorption of all nutrients found in food. Such benefits are expected to foster growth of the global digestive health products market in the near future.
Increasing Concern for Health to Pave Way for Rapid Growth of the Market
By enhancing gut health, digestive health products contribute to the battle against bad bacteria and betters immunity. Probiotic yoghurts are one of the few commonly consumed probiotic items that claim to help with digestion. Rising consumer perception of its health benefits is likely to fuel expansion of the global digestive health products market, as people are prepared to pay more for healthier lifestyle and improved health. Developing countries such, as India, Russia, Brazil, and China have seen major increases in spending. As a result, rapidly increasing disposable income levels of consumers, combined with increased understanding of probiotics' immune system benefits, are believed to foster growth of the market in the years to come. Evolving eating habits and increasing intake of high-sodium food items are likely to result in an uptick in the occurrence of gastrointestinal disorders in both developing and developed countries, which is estimated to bolster growth of the global digestive health supplements market. Together with benefits associated with digestive health products, these items now also assert immune support, health benefits of women, enhancement of nutrient absorption, and even cardiovascular and brain health supplements.
1. Global Digestive Health Products Market - Executive Summary
2. Global Digestive Health Products Market Overview
2.1. Introduction
2.1.1. Global Digestive Health Products Market Taxonomy
2.1.2. Global Digestive Health Products Market Definition
2.2. Global Digestive Health Products Market Size (US$ Mn) and Forecast, 2012-2022
2.2.1. Global Digestive Health Products Market Y-o-Y Growth
2.3. Global Digestive Health Products Market Dynamics
2.3.1. Drivers
2.3.2. Restraints
2.3.3. Trends
2.4. Supply Chain
2.5. Cost Structure
2.6. Pricing Analysis
2.7. Raw Material Sourcing Strategy and Analysis
2.8. List of Distributors
2.9. Key Participants Market Presence (Intensity Map) By Region
3. Global Digestive Health Products Market Analysis and Forecast By Product Type
3.1. Global Digestive Health Products Market Size and Forecast By Product Type, 2012-2022
3.1.1. Dairy Products Digestive Health Products Market Size and Forecast, 2012-2022
3.1.1.1. Revenue (US$ Mn) Comparison, By Region
3.1.1.2. Market Share Comparison, By Region
3.1.1.3. Y-o-Y growth Comparison, By Region
3.1.2. Bakery and cereals Digestive Health Products Market Size and Forecast, 2012-2022
3.1.2.1. Revenue (US$ Mn) Comparison, By Region
3.1.2.2. Market Share Comparison, By Region
3.1.2.3. Y-o-Y growth Comparison, By Region
3.1.3. Non-Alcoholic Beverages Digestive Health Products Market Size and Forecast, 2012-2022
3.1.3.1. Revenue (US$ Mn) Comparison, By Region
3.1.3.2. Market Share Comparison, By Region
3.1.3.3. Y-o-Y growth Comparison, By Region
3.1.4. Others Digestive Health Products Market Size and Forecast, 2012-2022
3.1.4.1. Revenue (US$ Mn) Comparison, By Region
3.1.4.2. Market Share Comparison, By Region
3.1.4.3. Y-o-Y growth Comparison, By Region
4. Global Digestive Health Products Market Analysis and Forecast By Ingredient
4.1. Global Digestive Health Products Market Size and Forecast By Ingredient, 2012-2022
4.1.1. Probiotic Digestive Health Products Market Size and Forecast, 2012-2022
4.1.1.1. Revenue (US$ Mn) Comparison, By Region
4.1.1.2. Market Share Comparison, By Region
4.1.1.3. Y-o-Y growth Comparison, By Region
4.1.2. Prebiotic Digestive Health Products Market Size and Forecast, 2012-2022
4.1.2.1. Revenue (US$ Mn) Comparison, By Region
4.1.2.2. Market Share Comparison, By Region
4.1.2.3. Y-o-Y growth Comparison, By Region
4.1.3. Food Enzymes Digestive Health Products Market Size and Forecast, 2012-2022
4.1.3.1. Revenue (US$ Mn) Comparison, By Region
4.1.3.2. Market Share Comparison, By Region
4.1.3.3. Y-o-Y growth Comparison, By Region
5. Global Digestive Health Products Market Analysis and Forecast By Sales Channel
5.1. Global Digestive Health Products Market Size and Forecast By Sales Channel, 2012-2022
5.1.1. Modern Trade Digestive Health Products Market Size and Forecast, 2012-2022
5.1.1.1. Revenue (US$ Mn) Comparison, By Region
5.1.1.2. Market Share Comparison, By Region
5.1.1.3. Y-o-Y growth Comparison, By Region
5.1.2. Convenience Store Digestive Health Products Market Size and Forecast, 2012-2022
5.1.2.1. Revenue (US$ Mn) Comparison, By Region
5.1.2.2. Market Share Comparison, By Region
5.1.2.3. Y-o-Y growth Comparison, By Region
5.1.3. Online Retailers Digestive Health Products Market Size and Forecast, 2012-2022
5.1.3.1. Revenue (US$ Mn) Comparison, By Region
5.1.3.2. Market Share Comparison, By Region
5.1.3.3. Y-o-Y growth Comparison, By Region
5.1.4. Other Sales Channel Digestive Health Products Market Size and Forecast, 2012-2022
5.1.4.1. Revenue (US$ Mn) Comparison, By Region
5.1.4.2. Market Share Comparison, By Region
5.1.4.3. Y-o-Y growth Comparison, By Region
6. Global Digestive Health Products Market Analysis and Forecast By Region
6.1. Global Digestive Health Products Market Size and Forecast, 2012-2022
6.1.1. North America Digestive Health Products Market Size and Forecast, 2012-2022
6.1.1.1. Revenue (US$ Mn) Comparison, By Product Type
6.1.1.2. Revenue (US$ Mn) Comparison, By Ingredient
6.1.1.3. Revenue (US$ Mn) Comparison, By Sales Channel
6.1.2. Latin America Digestive Health Products Market Size and Forecast, 2012-2022
6.1.2.1. Revenue (US$ Mn) Comparison, By Product Type
6.1.2.2. Revenue (US$ Mn) Comparison, By Ingredient
6.1.2.3. Revenue (US$ Mn) Comparison, By Sales Channel
6.1.3. Europe Digestive Health Products Market Size and Forecast, 2012-2022
6.1.3.1. Revenue (US$ Mn) Comparison, By Product Type
6.1.3.2. Revenue (US$ Mn) Comparison, By Ingredient
6.1.3.3. Revenue (US$ Mn) Comparison, By Sales Channel
6.1.4. Japan Digestive Health Products Market Size and Forecast, 2012-2022
6.1.4.1. Revenue (US$ Mn) Comparison, By Product Type
6.1.4.2. Revenue (US$ Mn) Comparison, By Ingredient
6.1.4.3. Revenue (US$ Mn) Comparison, By Sales Channel
6.1.5. APEJ Digestive Health Products Market Size and Forecast, 2012-2022
6.1.5.1. Revenue (US$ Mn) Comparison, By Product Type
6.1.5.2. Revenue (US$ Mn) Comparison, By Ingredient
6.1.5.3. Revenue (US$ Mn) Comparison, By Sales Channel
6.1.6. MEA Digestive Health Products Market Size and Forecast, 2012-2022
6.1.6.1. Revenue (US$ Mn) Comparison, By Product Type
6.1.6.2. Revenue (US$ Mn) Comparison, By Ingredient
6.1.6.3. Revenue (US$ Mn) Comparison, By Sales Channel
7. North America Digestive Health Products Market Analysis and Forecast, By Country, 2012-2022
7.1. US Digestive Health Products Market Size and Forecast, 2012-2022
7.1.1. Revenue (US$ Mn) Comparison, By Product Type
7.1.2. Revenue (US$ Mn) Comparison, By Ingredient
7.1.3. Revenue (US$ Mn) Comparison, By Sales Channel
7.2. Canada Digestive Health Products Market Size and Forecast, 2012-2022
7.2.1. Revenue (US$ Mn) Comparison, By Product Type
7.2.2. Revenue (US$ Mn) Comparison, By Ingredient
7.2.3. Revenue (US$ Mn) Comparison, By Sales Channel
8. Latin America Digestive Health Products Market Analysis and Forecast, By Country, 2012-2022
8.1. Brazil Digestive Health Products Market Size and Forecast, 2012-2022
8.1.1. Revenue (US$ Mn) Comparison, By Product Type
8.1.2. Revenue (US$ Mn) Comparison, By Ingredient
8.1.3. Revenue (US$ Mn) Comparison, By Sales Channel
8.2. Mexico Digestive Health Products Market Size and Forecast, 2012-2022
8.2.1. Revenue (US$ Mn) Comparison, By Product Type
8.2.2. Revenue (US$ Mn) Comparison, By Ingredient
8.2.3. Revenue (US$ Mn) Comparison, By Sales Channel
8.3. Argentina Digestive Health Products Market Size and Forecast, 2012-2022
8.3.1. Revenue (US$ Mn) Comparison, By Product Type
8.3.2. Revenue (US$ Mn) Comparison, By Ingredient
8.3.3. Revenue (US$ Mn) Comparison, By Sales Channel
9. Europe Digestive Health Products Market Analysis and Forecast, By Country, 2012-2022
9.1. Germany Digestive Health Products Market Size and Forecast, 2012-2022
9.1.1. Revenue (US$ Mn) Comparison, By Product Type
9.1.2. Revenue (US$ Mn) Comparison, By Ingredient
9.1.3. Revenue (US$ Mn) Comparison, By Sales Channel
9.2. UK Digestive Health Products Market Size and Forecast, 2012-2022
9.2.1. Revenue (US$ Mn) Comparison, By Product Type
9.2.2. Revenue (US$ Mn) Comparison, By Ingredient
9.2.3. Revenue (US$ Mn) Comparison, By Sales Channel
9.3. France Digestive Health Products Market Size and Forecast, 2012-2022
9.3.1. Revenue (US$ Mn) Comparison, By Product Type
9.3.2. Revenue (US$ Mn) Comparison, By Ingredient
9.3.3. Revenue (US$ Mn) Comparison, By Sales Channel
9.4. Spain Digestive Health Products Market Size and Forecast, 2012-2022
9.4.1. Revenue (US$ Mn) Comparison, By Product Type
9.4.2. Revenue (US$ Mn) Comparison, By Ingredient
9.4.3. Revenue (US$ Mn) Comparison, By Sales Channel
9.5. Italy Digestive Health Products Market Size and Forecast, 2012-2022
9.5.1. Revenue (US$ Mn) Comparison, By Product Type
9.5.2. Revenue (US$ Mn) Comparison, By Ingredient
9.5.3. Revenue (US$ Mn) Comparison, By Sales Channel
9.6. Nordic Digestive Health Products Market Size and Forecast, 2012-2022
9.6.1. Revenue (US$ Mn) Comparison, By Product Type
9.6.2. Revenue (US$ Mn) Comparison, By Ingredient
9.6.3. Revenue (US$ Mn) Comparison, By Sales Channel
10. Japan Digestive Health Products Market Analysis and Forecast, By Country, 2012-2022
10.1. Japan Digestive Health Products Market Size and Forecast, 2012-2022
10.1.1. Revenue (US$ Mn) Comparison, By Product Type
10.1.2. Revenue (US$ Mn) Comparison, By Ingredient
10.1.3. Revenue (US$ Mn) Comparison, By Sales Channel
11. APEJ Digestive Health Products Market Analysis and Forecast, By Country, 2012-2022
11.1. China Digestive Health Products Market Size and Forecast, 2012-2022
11.1.1. Revenue (US$ Mn) Comparison, By Product Type
11.1.2. Revenue (US$ Mn) Comparison, By Ingredient
11.1.3. Revenue (US$ Mn) Comparison, By Sales Channel
11.2. India Digestive Health Products Market Size and Forecast, 2012-2022
11.2.1. Revenue (US$ Mn) Comparison, By Product Type
11.2.2. Revenue (US$ Mn) Comparison, By Ingredient
11.2.3. Revenue (US$ Mn) Comparison, By Sales Channel
11.3. Malaysia Digestive Health Products Market Size and Forecast, 2012-2022
11.3.1. Revenue (US$ Mn) Comparison, By Product Type
11.3.2. Revenue (US$ Mn) Comparison, By Ingredient
11.3.3. Revenue (US$ Mn) Comparison, By Sales Channel
11.4. Thailand Digestive Health Products Market Size and Forecast, 2012-2022
11.4.1. Revenue (US$ Mn) Comparison, By Product Type
11.4.2. Revenue (US$ Mn) Comparison, By Ingredient
11.4.3. Revenue (US$ Mn) Comparison, By Sales Channel
11.5. Singapore Digestive Health Products Market Size and Forecast, 2012-2022
11.5.1. Revenue (US$ Mn) Comparison, By Product Type
11.5.2. Revenue (US$ Mn) Comparison, By Ingredient
11.5.3. Revenue (US$ Mn) Comparison, By Sales Channel
11.6. Australia Digestive Health Products Market Size and Forecast, 2012-2022
11.6.1. Revenue (US$ Mn) Comparison, By Product Type
11.6.2. Revenue (US$ Mn) Comparison, By Ingredient
11.6.3. Revenue (US$ Mn) Comparison, By Sales Channel
12. MEA Digestive Health Products Market Analysis and Forecast, By Country, 2012-2022
12.1. GCC Countries Digestive Health Products Market Size and Forecast, 2012-2022
12.1.1. Revenue (US$ Mn) Comparison, By Product Type
12.1.2. Revenue (US$ Mn) Comparison, By Ingredient
12.1.3. Revenue (US$ Mn) Comparison, By Sales Channel
12.2. South Africa Digestive Health Products Market Size and Forecast, 2012-2022
12.2.1. Revenue (US$ Mn) Comparison, By Product Type
12.2.2. Revenue (US$ Mn) Comparison, By Ingredient
12.2.3. Revenue (US$ Mn) Comparison, By Sales Channel
12.3. Nigeria Digestive Health Products Market Size and Forecast, 2012-2022
12.3.1. Revenue (US$ Mn) Comparison, By Product Type
12.3.2. Revenue (US$ Mn) Comparison, By Ingredient
12.3.3. Revenue (US$ Mn) Comparison, By Sales Channel
12.4. Israel Digestive Health Products Market Size and Forecast, 2012-2022
12.4.1. Revenue (US$ Mn) Comparison, By Product Type
12.4.2. Revenue (US$ Mn) Comparison, By Ingredient
12.4.3. Revenue (US$ Mn) Comparison, By Sales Channel
13. Global Digestive Health Products Market Competition Landscape and Company Profile
13.1. Company Share Analysis By Region
13.2. E. I. Du Pont Nemours and Company
13.2.1. Company Overview
13.2.2. Digestive Health Products Market Product Type list
13.2.3. Digestive Health Products Market Product Type Sales Data and Key Financials
13.2.4. Key Developments
13.2.5. SWOT Analysis
13.3. Yakult Honsha Co Ltd
13.3.1. Company Overview
13.3.2. Digestive Health Products Market Product Type list
13.3.3. Digestive Health Products Market Product Type Sales Data and Key Financials
13.3.4. Key Developments
13.3.5. SWOT Analysis
13.4. Danone S.A.
13.4.1. Company Overview
13.4.2. Digestive Health Products Market Product Type list
13.4.3. Digestive Health Products Market Product Type Sales Data and Key Financials
13.4.4. Key Developments
13.4.5. SWOT Analysis
13.5. Nestle S.A.
13.5.1. Company Overview
13.5.2. Digestive Health Products Market Product Type list
13.5.3. Digestive Health Products Market Product Type Sales Data and Key Financials
13.5.4. Key Developments
13.5.5. SWOT Analysis
13.6. Arla Foods Inc.
13.6.1. Company Overview
13.6.2. Digestive Health Products Market Product Type list
13.6.3. Digestive Health Products Market Product Type Sales Data and Key Financials
13.6.4. Key Developments
13.6.5. SWOT Analysis
13.7. Chr. Hansen holding
13.7.1. Company Overview
13.7.2. Digestive Health Products Market Product Type list
13.7.3. Digestive Health Products Market Product Type Sales Data and Key Financials
13.7.4. Key Developments
13.7.5. SWOT Analysis
13.8. Cargill Incorporated
13.8.1. Company Overview
13.8.2. Digestive Health Products Market Product Type list
13.8.3. Digestive Health Products Market Product Type Sales Data and Key Financials
13.8.4. Key Developments
13.8.5. SWOT Analysis
13.9. PepsiCo Inc
13.9.1. Company Overview
13.9.2. Digestive Health Products Market Product Type list
13.9.3. Digestive Health Products Market Product Type Sales Data and Key Financials
13.9.4. Key Developments
13.9.5. SWOT Analysis
13.10. Mondelez International Inc
13.10.1. Company Overview
13.10.2. Digestive Health Products Market Product Type list
13.10.3. Digestive Health Products Market Product Type Sales Data and Key Financials
13.10.4. Key Developments
13.10.5. SWOT Analysis
13.11. General Mills
13.11.1. Company Overview
13.11.2. Digestive Health Products Market Product Type list
13.11.3. Digestive Health Products Market Product Type Sales Data and Key Financials
13.11.4. Key Developments
13.11.5. SWOT Analysis
List of Tables
TABLE 1 Global Digestive Health Products Market Value (US$ Mn), 2012-2016
TABLE 2 Global Digestive Health Products Market Value (US$ Mn), 2017-2022
TABLE 3 Global Digestive Health Products Market Value (US$ Mn) and Y-o-Y, 2015-2022
TABLE 4 Global Dairy Products Segment Value (US$ Mn), By Region 2012-2016
TABLE 5 Global Dairy Products Segment Value (US$ Mn), By Region 2017-2022
TABLE 6 Global Dairy Products Segment Market Share, By Region 2012-2016
TABLE 7 Global Dairy Products Segment Market Share, By Region 2017-2022
TABLE 8 Global Dairy Products Segment Y-o-Y, By Region 2015-2022
TABLE 9 Global Bakery and cereals Segment Value (US$ Mn), By Region 2012-2016
TABLE 10 Global Bakery and cereals Segment Value (US$ Mn), By Region 2017-2022
TABLE 11 Global Bakery and cereals Segment Market Share, By Region 2012-2016
TABLE 12 Global Bakery and cereals Segment Market Share, By Region 2017-2022
TABLE 13 Global Bakery and cereals Segment Y-o-Y, By Region 2015-2022
TABLE 14 Global Non-Alcoholic Beverages Segment Value (US$ Mn), By Region 2012-2016
TABLE 15 Global Non-Alcoholic Beverages Segment Value (US$ Mn), By Region 2017-2022
TABLE 16 Global Non-Alcoholic Beverages Segment Market Share, By Region 2012-2016
TABLE 17 Global Non-Alcoholic Beverages Segment Market Share, By Region 2017-2022
TABLE 18 Global Non-Alcoholic Beverages Segment Y-o-Y, By Region 2015-2022
TABLE 19 Global Others Segment Value (US$ Mn), By Region 2012-2016
TABLE 20 Global Others Segment Value (US$ Mn), By Region 2017-2022
TABLE 21 Global Others Segment Market Share, By Region 2012-2016
TABLE 22 Global Others Segment Market Share, By Region 2017-2022
TABLE 23 Global Others Segment Y-o-Y, By Region 2015-2022
TABLE 24 Global Probiotic Segment Value (US$ Mn), By Region 2012-2016
TABLE 25 Global Probiotic Segment Value (US$ Mn), By Region 2017-2022
TABLE 26 Global Probiotic Segment Market Share, By Region 2012-2016
TABLE 27 Global Probiotic Segment Market Share, By Region 2017-2022
TABLE 28 Global Probiotic Segment Y-o-Y, By Region 2015-2022
TABLE 29 Global Prebiotic Segment Value (US$ Mn), By Region 2012-2016
TABLE 30 Global Prebiotic Segment Value (US$ Mn), By Region 2017-2022
TABLE 31 Global Prebiotic Segment Market Share, By Region 2012-2016
TABLE 32 Global Prebiotic Segment Market Share, By Region 2017-2022
TABLE 33 Global Prebiotic Segment Y-o-Y, By Region 2015-2022
TABLE 34 Global Food Enzymes Segment Value (US$ Mn), By Region 2012-2016
TABLE 35 Global Food Enzymes Segment Value (US$ Mn), By Region 2017-2022
TABLE 36 Global Food Enzymes Segment Market Share, By Region 2012-2016
TABLE 37 Global Food Enzymes Segment Market Share, By Region 2017-2022
TABLE 38 Global Food Enzymes Segment Y-o-Y, By Region 2015-2022
TABLE 39 Global Modern Trade Segment Value (US$ Mn), By Region 2012-2016
TABLE 40 Global Modern Trade Segment Value (US$ Mn), By Region 2017-2022
TABLE 41 Global Modern Trade Segment Market Share, By Region 2012-2016
TABLE 42 Global Modern Trade Segment Market Share, By Region 2017-2022
TABLE 43 Global Modern Trade Segment Y-o-Y, By Region 2015-2022
TABLE 44 Global Convenience Store Segment Value (US$ Mn), By Region 2012-2016
TABLE 45 Global Convenience Store Segment Value (US$ Mn), By Region 2017-2022
TABLE 46 Global Convenience Store Segment Market Share, By Region 2012-2016
TABLE 47 Global Convenience Store Segment Market Share, By Region 2017-2022
TABLE 48 Global Convenience Store Segment Y-o-Y, By Region 2015-2022
TABLE 49 Global Online Retailers Segment Value (US$ Mn), By Region 2012-2016
TABLE 50 Global Online Retailers Segment Value (US$ Mn), By Region 2017-2022
TABLE 51 Global Online Retailers Segment Market Share, By Region 2012-2016
TABLE 52 Global Online Retailers Segment Market Share, By Region 2017-2022
TABLE 53 Global Online Retailers Segment Y-o-Y, By Region 2015-2022
TABLE 54 Global Other Sales Channel Segment Value (US$ Mn), By Region 2012-2016
TABLE 55 Global Other Sales Channel Segment Value (US$ Mn), By Region 2017-2022
TABLE 56 Global Other Sales Channel Segment Market Share, By Region 2012-2016
TABLE 57 Global Other Sales Channel Segment Market Share, By Region 2017-2022
TABLE 58 Global Other Sales Channel Segment Y-o-Y, By Region 2015-2022
TABLE 59 North America Digestive Health Products Market Value (US$ Mn), By Product Type 2012-2016
TABLE 60 North America Digestive Health Products Market Value (US$ Mn), By Product Type 2017-2022
TABLE 61 North America Digestive Health Products Market Value (US$ Mn), By Ingredient 2012-2016
TABLE 62 North America Digestive Health Products Market Value (US$ Mn), By Ingredient 2017-2022
TABLE 63 North America Digestive Health Products Market Value (US$ Mn), By Sales Channel 2012-2016
TABLE 64 North America Digestive Health Products Market Value (US$ Mn), By Sales Channel 2017-2022
TABLE 65 Latin America Digestive Health Products Market Value (US$ Mn), By Product Type 2012-2016
TABLE 66 Latin America Digestive Health Products Market Value (US$ Mn), By Product Type 2017-2022
TABLE 67 Latin America Digestive Health Products Market Value (US$ Mn), By Ingredient 2012-2016
TABLE 68 Latin America Digestive Health Products Market Value (US$ Mn), By Ingredient 2017-2022
TABLE 69 Latin America Digestive Health Products Market Value (US$ Mn), By Sales Channel 2012-2016
TABLE 70 Latin America Digestive Health Products Market Value (US$ Mn), By Sales Channel 2017-2022
TABLE 71 Europe Digestive Health Products Market Value (US$ Mn), By Product Type 2012-2016
TABLE 72 Europe Digestive Health Products Market Value (US$ Mn), By Product Type 2017-2022
TABLE 73 Europe Digestive Health Products Market Value (US$ Mn), By Ingredient 2012-2016
TABLE 74 Europe Digestive Health Products Market Value (US$ Mn), By Ingredient 2017-2022
TABLE 75 Europe Digestive Health Products Market Value (US$ Mn), By Sales Channel 2012-2016
TABLE 76 Europe Digestive Health Products Market Value (US$ Mn), By Sales Channel 2017-2022
TABLE 77 Japan Digestive Health Products Market Value (US$ Mn), By Product Type 2012-2016
TABLE 78 Japan Digestive Health Products Market Value (US$ Mn), By Product Type 2017-2022
TABLE 79 Japan Digestive Health Products Market Value (US$ Mn), By Ingredient 2012-2016
TABLE 80 Japan Digestive Health Products Market Value (US$ Mn), By Ingredient 2017-2022
TABLE 81 Japan Digestive Health Products Market Value (US$ Mn), By Sales Channel 2012-2016
TABLE 82 Japan Digestive Health Products Market Value (US$ Mn), By Sales Channel 2017-2022
TABLE 83 APEJ Digestive Health Products Market Value (US$ Mn), By Product Type 2012-2016
TABLE 84 APEJ Digestive Health Products Market Value (US$ Mn), By Product Type 2017-2022
TABLE 85 APEJ Digestive Health Products Market Value (US$ Mn), By Ingredient 2012-2016
TABLE 86 APEJ Digestive Health Products Market Value (US$ Mn), By Ingredient 2017-2022
TABLE 87 APEJ Digestive Health Products Market Value (US$ Mn), By Sales Channel 2012-2016
TABLE 88 APEJ Digestive Health Products Market Value (US$ Mn), By Sales Channel 2017-2022
TABLE 89 MEA Digestive Health Products Market Value (US$ Mn), By Product Type 2012-2016
TABLE 90 MEA Digestive Health Products Market Value (US$ Mn), By Product Type 2017-2022
TABLE 91 MEA Digestive Health Products Market Value (US$ Mn), By Ingredient 2012-2016
TABLE 92 MEA Digestive Health Products Market Value (US$ Mn), By Ingredient 2017-2022
TABLE 93 MEA Digestive Health Products Market Value (US$ Mn), By Sales Channel 2012-2016
TABLE 94 MEA Digestive Health Products Market Value (US$ Mn), By Sales Channel 2017-2022
TABLE 95 US Digestive Health Products Market Value (US$ Mn), By Product Type 2012-2016
TABLE 96 US Digestive Health Products Market Value (US$ Mn), By Product Type 2017-2022
TABLE 97 US Digestive Health Products Market Value (US$ Mn), By Ingredient 2012-2016
TABLE 98 US Digestive Health Products Market Value (US$ Mn), By Ingredient 2017-2022
TABLE 99 US Digestive Health Products Market Value (US$ Mn), By Sales Channel 2012-2016
TABLE 100 US Digestive Health Products Market Value (US$ Mn), By Sales Channel 2017-2022
TABLE 101 Canada Digestive Health Products Market Value (US$ Mn), By Product Type 2012-2016
TABLE 102 Canada Digestive Health Products Market Value (US$ Mn), By Product Type 2017-2022
TABLE 103 Canada Digestive Health Products Market Value (US$ Mn), By Ingredient 2012-2016
TABLE 104 Canada Digestive Health Products Market Value (US$ Mn), By Ingredient 2017-2022
TABLE 105 Canada Digestive Health Products Market Value (US$ Mn), By Sales Channel 2012-2016
TABLE 106 Canada Digestive Health Products Market Value (US$ Mn), By Sales Channel 2017-2022
TABLE 107 Brazil Digestive Health Products Market Value (US$ Mn), By Product Type 2012-2016
TABLE 108 Brazil Digestive Health Products Market Value (US$ Mn), By Product Type 2017-2022
TABLE 109 Brazil Digestive Health Products Market Value (US$ Mn), By Ingredient 2012-2016
TABLE 110 Brazil Digestive Health Products Market Value (US$ Mn), By Ingredient 2017-2022
TABLE 111 Brazil Digestive Health Products Market Value (US$ Mn), By Sales Channel 2012-2016
TABLE 112 Brazil Digestive Health Products Market Value (US$ Mn), By Sales Channel 2017-2022
TABLE 113 Mexico Digestive Health Products Market Value (US$ Mn), By Product Type 2012-2016
TABLE 114 Mexico Digestive Health Products Market Value (US$ Mn), By Product Type 2017-2022
TABLE 115 Mexico Digestive Health Products Market Value (US$ Mn), By Ingredient 2012-2016
TABLE 116 Mexico Digestive Health Products Market Value (US$ Mn), By Ingredient 2017-2022
TABLE 117 Mexico Digestive Health Products Market Value (US$ Mn), By Sales Channel 2012-2016
TABLE 118 Mexico Digestive Health Products Market Value (US$ Mn), By Sales Channel 2017-2022
TABLE 119 Argentina Digestive Health Products Market Value (US$ Mn), By Product Type 2012-2016
TABLE 120 Argentina Digestive Health Products Market Value (US$ Mn), By Product Type 2017-2022
TABLE 121 Argentina Digestive Health Products Market Value (US$ Mn), By Ingredient 2012-2016
TABLE 122 Argentina Digestive Health Products Market Value (US$ Mn), By Ingredient 2017-2022
TABLE 123 Argentina Digestive Health Products Market Value (US$ Mn), By Sales Channel 2012-2016
TABLE 124 Argentina Digestive Health Products Market Value (US$ Mn), By Sales Channel 2017-2022
TABLE 125 Germany Digestive Health Products Market Value (US$ Mn), By Product Type 2012-2016
TABLE 126 Germany Digestive Health Products Market Value (US$ Mn), By Product Type 2017-2022
TABLE 127 Germany Digestive Health Products Market Value (US$ Mn), By Ingredient 2012-2016
TABLE 128 Germany Digestive Health Products Market Value (US$ Mn), By Ingredient 2017-2022
TABLE 129 Germany Digestive Health Products Market Value (US$ Mn), By Sales Channel 2012-2016
TABLE 130 Germany Digestive Health Products Market Value (US$ Mn), By Sales Channel 2017-2022
TABLE 131 UK Digestive Health Products Market Value (US$ Mn), By Product Type 2012-2016
TABLE 132 UK Digestive Health Products Market Value (US$ Mn), By Product Type 2017-2022
TABLE 133 UK Digestive Health Products Market Value (US$ Mn), By Ingredient 2012-2016
TABLE 134 UK Digestive Health Products Market Value (US$ Mn), By Ingredient 2017-2022
TABLE 135 UK Digestive Health Products Market Value (US$ Mn), By Sales Channel 2012-2016
TABLE 136 UK Digestive Health Products Market Value (US$ Mn), By Sales Channel 2017-2022
TABLE 137 France Digestive Health Products Market Value (US$ Mn), By Product Type 2012-2016
TABLE 138 France Digestive Health Products Market Value (US$ Mn), By Product Type 2017-2022
TABLE 139 France Digestive Health Products Market Value (US$ Mn), By Ingredient 2012-2016
TABLE 140 France Digestive Health Products Market Value (US$ Mn), By Ingredient 2017-2022
TABLE 141 France Digestive Health Products Market Value (US$ Mn), By Sales Channel 2012-2016
TABLE 142 France Digestive Health Products Market Value (US$ Mn), By Sales Channel 2017-2022
TABLE 143 Spain Digestive Health Products Market Value (US$ Mn), By Product Type 2012-2016
TABLE 144 Spain Digestive Health Products Market Value (US$ Mn), By Product Type 2017-2022
TABLE 145 Spain Digestive Health Products Market Value (US$ Mn), By Ingredient 2012-2016
TABLE 146 Spain Digestive Health Products Market Value (US$ Mn), By Ingredient 2017-2022
TABLE 147 Spain Digestive Health Products Market Value (US$ Mn), By Sales Channel 2012-2016
TABLE 148 Spain Digestive Health Products Market Value (US$ Mn), By Sales Channel 2017-2022
TABLE 149 Italy Digestive Health Products Market Value (US$ Mn), By Product Type 2012-2016
TABLE 150 Italy Digestive Health Products Market Value (US$ Mn), By Product Type 2017-2022
TABLE 151 Italy Digestive Health Products Market Value (US$ Mn), By Ingredient 2012-2016
TABLE 152 Italy Digestive Health Products Market Value (US$ Mn), By Ingredient 2017-2022
TABLE 153 Italy Digestive Health Products Market Value (US$ Mn), By Sales Channel 2012-2016
TABLE 154 Italy Digestive Health Products Market Value (US$ Mn), By Sales Channel 2017-2022
TABLE 155 Nordic Digestive Health Products Market Value (US$ Mn), By Product Type 2012-2016
TABLE 156 Nordic Digestive Health Products Market Value (US$ Mn), By Product Type 2017-2022
TABLE 157 Nordic Digestive Health Products Market Value (US$ Mn), By Ingredient 2012-2016
TABLE 158 Nordic Digestive Health Products Market Value (US$ Mn), By Ingredient 2017-2022
TABLE 159 Nordic Digestive Health Products Market Value (US$ Mn), By Sales Channel 2012-2016
TABLE 160 Nordic Digestive Health Products Market Value (US$ Mn), By Sales Channel 2017-2022
TABLE 161 Japan Digestive Health Products Market Value (US$ Mn), By Product Type 2012-2016
TABLE 162 Japan Digestive Health Products Market Value (US$ Mn), By Product Type 2017-2022
TABLE 163 Japan Digestive Health Products Market Value (US$ Mn), By Ingredient 2012-2016
TABLE 164 Japan Digestive Health Products Market Value (US$ Mn), By Ingredient 2017-2022
TABLE 165 Japan Digestive Health Products Market Value (US$ Mn), By Sales Channel 2012-2016
TABLE 166 Japan Digestive Health Products Market Value (US$ Mn), By Sales Channel 2017-2022
TABLE 167 China Digestive Health Products Market Value (US$ Mn), By Product Type 2012-2016
TABLE 168 China Digestive Health Products Market Value (US$ Mn), By Product Type 2017-2022
TABLE 169 China Digestive Health Products Market Value (US$ Mn), By Ingredient 2012-2016
TABLE 170 China Digestive Health Products Market Value (US$ Mn), By Ingredient 2017-2022
TABLE 171 China Digestive Health Products Market Value (US$ Mn), By Sales Channel 2012-2016
TABLE 172 China Digestive Health Products Market Value (US$ Mn), By Sales Channel 2017-2022
TABLE 173 India Digestive Health Products Market Value (US$ Mn), By Product Type 2012-2016
TABLE 174 India Digestive Health Products Market Value (US$ Mn), By Product Type 2017-2022
TABLE 175 India Digestive Health Products Market Value (US$ Mn), By Ingredient 2012-2016
TABLE 176 India Digestive Health Products Market Value (US$ Mn), By Ingredient 2017-2022
TABLE 177 India Digestive Health Products Market Value (US$ Mn), By Sales Channel 2012-2016
TABLE 178 India Digestive Health Products Market Value (US$ Mn), By Sales Channel 2017-2022
TABLE 179 Malaysia Digestive Health Products Market Value (US$ Mn), By Product Type 2012-2016
TABLE 180 Malaysia Digestive Health Products Market Value (US$ Mn), By Product Type 2017-2022
TABLE 181 Malaysia Digestive Health Products Market Value (US$ Mn), By Ingredient 2012-2016
TABLE 182 Malaysia Digestive Health Products Market Value (US$ Mn), By Ingredient 2017-2022
TABLE 183 Malaysia Digestive Health Products Market Value (US$ Mn), By Sales Channel 2012-2016
TABLE 184 Malaysia Digestive Health Products Market Value (US$ Mn), By Sales Channel 2017-2022
TABLE 185 Thailand Digestive Health Products Market Value (US$ Mn), By Product Type 2012-2016
TABLE 186 Thailand Digestive Health Products Market Value (US$ Mn), By Product Type 2017-2022
TABLE 187 Thailand Digestive Health Products Market Value (US$ Mn), By Ingredient 2012-2016
TABLE 188 Thailand Digestive Health Products Market Value (US$ Mn), By Ingredient 2017-2022
TABLE 189 Thailand Digestive Health Products Market Value (US$ Mn), By Sales Channel 2012-2016
TABLE 190 Thailand Digestive Health Products Market Value (US$ Mn), By Sales Channel 2017-2022
TABLE 191 Singapore Digestive Health Products Market Value (US$ Mn), By Product Type 2012-2016
TABLE 192 Singapore Digestive Health Products Market Value (US$ Mn), By Product Type 2017-2022
TABLE 193 Singapore Digestive Health Products Market Value (US$ Mn), By Ingredient 2012-2016
TABLE 194 Singapore Digestive Health Products Market Value (US$ Mn), By Ingredient 2017-2022
TABLE 195 Singapore Digestive Health Products Market Value (US$ Mn), By Sales Channel 2012-2016
TABLE 196 Singapore Digestive Health Products Market Value (US$ Mn), By Sales Channel 2017-2022
TABLE 197 Australia Digestive Health Products Market Value (US$ Mn), By Product Type 2012-2016
TABLE 198 Australia Digestive Health Products Market Value (US$ Mn), By Product Type 2017-2022
TABLE 199 Australia Digestive Health Products Market Value (US$ Mn), By Ingredient 2012-2016
TABLE 200 Australia Digestive Health Products Market Value (US$ Mn), By Ingredient 2017-2022
TABLE 201 Australia Digestive Health Products Market Value (US$ Mn), By Sales Channel 2012-2016
TABLE 202 Australia Digestive Health Products Market Value (US$ Mn), By Sales Channel 2017-2022
TABLE 203 GCC Countries Digestive Health Products Market Value (US$ Mn), By Product Type 2012-2016
TABLE 204 GCC Countries Digestive Health Products Market Value (US$ Mn), By Product Type 2017-2022
TABLE 205 GCC Countries Digestive Health Products Market Value (US$ Mn), By Ingredient 2012-2016
TABLE 206 GCC Countries Digestive Health Products Market Value (US$ Mn), By Ingredient 2017-2022
TABLE 207 GCC Countries Digestive Health Products Market Value (US$ Mn), By Sales Channel 2012-2016
TABLE 208 GCC Countries Digestive Health Products Market Value (US$ Mn), By Sales Channel 2017-2022
TABLE 209 South Africa Digestive Health Products Market Value (US$ Mn), By Product Type 2012-2016
TABLE 210 South Africa Digestive Health Products Market Value (US$ Mn), By Product Type 2017-2022
TABLE 211 South Africa Digestive Health Products Market Value (US$ Mn), By Ingredient 2012-2016
TABLE 212 South Africa Digestive Health Products Market Value (US$ Mn), By Ingredient 2017-2022
TABLE 213 South Africa Digestive Health Products Market Value (US$ Mn), By Sales Channel 2012-2016
TABLE 214 South Africa Digestive Health Products Market Value (US$ Mn), By Sales Channel 2017-2022
TABLE 215 Nigeria Digestive Health Products Market Value (US$ Mn), By Product Type 2012-2016
TABLE 216 Nigeria Digestive Health Products Market Value (US$ Mn), By Product Type 2017-2022
TABLE 217 Nigeria Digestive Health Products Market Value (US$ Mn), By Ingredient 2012-2016
TABLE 218 Nigeria Digestive Health Products Market Value (US$ Mn), By Ingredient 2017-2022
TABLE 219 Nigeria Digestive Health Products Market Value (US$ Mn), By Sales Channel 2012-2016
TABLE 220 Nigeria Digestive Health Products Market Value (US$ Mn), By Sales Channel 2017-2022
TABLE 221 Israel Digestive Health Products Market Value (US$ Mn), By Product Type 2012-2016
TABLE 222 Israel Digestive Health Products Market Value (US$ Mn), By Product Type 2017-2022
TABLE 223 Israel Digestive Health Products Market Value (US$ Mn), By Ingredient 2012-2016
TABLE 224 Israel Digestive Health Products Market Value (US$ Mn), By Ingredient 2017-2022
TABLE 225 Israel Digestive Health Products Market Value (US$ Mn), By Sales Channel 2012-2016
TABLE 226 Israel Digestive Health Products Market Value (US$ Mn), By Sales Channel 2017-2022
List of Figures
FIG. 1 Global Digestive Health Products Market Value (US$ Mn), 2012-2016
FIG. 2 Global Digestive Health Products Market Value (US$ Mn) Forecast, 2017-2022
FIG. 3 Global Digestive Health Products Market Value (US$ Mn) and Y-o-Y, 2015-2022
FIG. 4 Global Dairy Products Segment Market Value (US$ Mn) By Region, 2012-2016
FIG. 5 Global Dairy Products Segment Market Value (US$ Mn) By Region, 2017-2022
FIG. 6 Global Dairy Products Segment Y-o-Y Growth Rate, By Region, 2015-2022
FIG. 7 Global Bakery and cereals Segment Market Value (US$ Mn) By Region, 2012-2016
FIG. 8 Global Bakery and cereals Segment Market Value (US$ Mn) By Region, 2017-2022
FIG. 9 Global Bakery and cereals Segment Y-o-Y Growth Rate, By Region, 2015-2022
FIG. 10 Global Non-Alcoholic Beverages Segment Market Value (US$ Mn) By Region, 2012-2016
FIG. 11 Global Non-Alcoholic Beverages Segment Market Value (US$ Mn) By Region, 2017-2022
FIG. 12 Global Non-Alcoholic Beverages Segment Y-o-Y Growth Rate, By Region, 2015-2022
FIG. 13 Global Others Segment Market Value (US$ Mn) By Region, 2012-2016
FIG. 14 Global Others Segment Market Value (US$ Mn) By Region, 2017-2022
FIG. 15 Global Others Segment Y-o-Y Growth Rate, By Region, 2015-2022
FIG. 16 Global Probiotic Segment Market Value (US$ Mn) By Region, 2012-2016
FIG. 17 Global Probiotic Segment Market Value (US$ Mn) By Region, 2017-2022
FIG. 18 Global Probiotic Segment Y-o-Y Growth Rate, By Region, 2015-2022
FIG. 19 Global Prebiotic Segment Market Value (US$ Mn) By Region, 2012-2016
FIG. 20 Global Prebiotic Segment Market Value (US$ Mn) By Region, 2017-2022
FIG. 21 Global Prebiotic Segment Y-o-Y Growth Rate, By Region, 2015-2022
FIG. 22 Global Food Enzymes Segment Market Value (US$ Mn) By Region, 2012-2016
FIG. 23 Global Food Enzymes Segment Market Value (US$ Mn) By Region, 2017-2022
FIG. 24 Global Food Enzymes Segment Y-o-Y Growth Rate, By Region, 2015-2022
FIG. 25 Global Modern Trade Segment Market Value (US$ Mn) By Region, 2012-2016
FIG. 26 Global Modern Trade Segment Market Value (US$ Mn) By Region, 2017-2022
FIG. 27 Global Modern Trade Segment Y-o-Y Growth Rate, By Region, 2015-2022
FIG. 28 Global Convenience Store Segment Market Value (US$ Mn) By Region, 2012-2016
FIG. 29 Global Convenience Store Segment Market Value (US$ Mn) By Region, 2017-2022
FIG. 30 Global Convenience Store Segment Y-o-Y Growth Rate, By Region, 2015-2022
FIG. 31 Global Online Retailers Segment Market Value (US$ Mn) By Region, 2012-2016
FIG. 32 Global Online Retailers Segment Market Value (US$ Mn) By Region, 2017-2022
FIG. 33 Global Online Retailers Segment Y-o-Y Growth Rate, By Region, 2015-2022
FIG. 34 Global Other Sales Channel Segment Market Value (US$ Mn) By Region, 2012-2016
FIG. 35 Global Other Sales Channel Segment Market Value (US$ Mn) By Region, 2017-2022
FIG. 36 Global Other Sales Channel Segment Y-o-Y Growth Rate, By Region, 2015-2022
FIG. 37 North America Digestive Health Products Market Value (US$ Mn), By Product Type 2012-2016
FIG. 38 North America Digestive Health Products Market Value (US$ Mn), By Product Type 2017-2022
FIG. 39 North America Digestive Health Products Market Value (US$ Mn), By Ingredient 2012-2016
FIG. 40 North America Digestive Health Products Market Value (US$ Mn), By Ingredient 2017-2022
FIG. 41 North America Digestive Health Products Market Value (US$ Mn), By Sales Channel 2012-2016
FIG. 42 North America Digestive Health Products Market Value (US$ Mn), By Sales Channel 2017-2022
FIG. 43 Latin America Digestive Health Products Market Value (US$ Mn), By Product Type 2012-2016
FIG. 44 Latin America Digestive Health Products Market Value (US$ Mn), By Product Type 2017-2022
FIG. 45 Latin America Digestive Health Products Market Value (US$ Mn), By Ingredient 2012-2016
FIG. 46 Latin America Digestive Health Products Market Value (US$ Mn), By Ingredient 2017-2022
FIG. 47 Latin America Digestive Health Products Market Value (US$ Mn), By Sales Channel 2012-2016
FIG. 48 Latin America Digestive Health Products Market Value (US$ Mn), By Sales Channel 2017-2022
FIG. 49 Europe Digestive Health Products Market Value (US$ Mn), By Product Type 2012-2016
FIG. 50 Europe Digestive Health Products Market Value (US$ Mn), By Product Type 2017-2022
FIG. 51 Europe Digestive Health Products Market Value (US$ Mn), By Ingredient 2012-2016
FIG. 52 Europe Digestive Health Products Market Value (US$ Mn), By Ingredient 2017-2022
FIG. 53 Europe Digestive Health Products Market Value (US$ Mn), By Sales Channel 2012-2016
FIG. 54 Europe Digestive Health Products Market Value (US$ Mn), By Sales Channel 2017-2022
FIG. 55 Japan Digestive Health Products Market Value (US$ Mn), By Product Type 2012-2016
FIG. 56 Japan Digestive Health Products Market Value (US$ Mn), By Product Type 2017-2022
FIG. 57 Japan Digestive Health Products Market Value (US$ Mn), By Ingredient 2012-2016
FIG. 58 Japan Digestive Health Products Market Value (US$ Mn), By Ingredient 2017-2022
FIG. 59 Japan Digestive Health Products Market Value (US$ Mn), By Sales Channel 2012-2016
FIG. 60 Japan Digestive Health Products Market Value (US$ Mn), By Sales Channel 2017-2022
FIG. 61 APEJ Digestive Health Products Market Value (US$ Mn), By Product Type 2012-2016
FIG. 62 APEJ Digestive Health Products Market Value (US$ Mn), By Product Type 2017-2022
FIG. 63 APEJ Digestive Health Products Market Value (US$ Mn), By Ingredient 2012-2016
FIG. 64 APEJ Digestive Health Products Market Value (US$ Mn), By Ingredient 2017-2022
FIG. 65 APEJ Digestive Health Products Market Value (US$ Mn), By Sales Channel 2012-2016
FIG. 66 APEJ Digestive Health Products Market Value (US$ Mn), By Sales Channel 2017-2022
FIG. 67 MEA Digestive Health Products Market Value (US$ Mn), By Product Type 2012-2016
FIG. 68 MEA Digestive Health Products Market Value (US$ Mn), By Product Type 2017-2022
FIG. 69 MEA Digestive Health Products Market Value (US$ Mn), By Ingredient 2012-2016
FIG. 70 MEA Digestive Health Products Market Value (US$ Mn), By Ingredient 2017-2022
FIG. 71 MEA Digestive Health Products Market Value (US$ Mn), By Sales Channel 2012-2016
FIG. 72 MEA Digestive Health Products Market Value (US$ Mn), By Sales Channel 2017-2022
Copyright © Transparency Market Research, Inc. All Rights reserved
Trust Online

Digestive Health Products Market