
Reports
Reports
Analysts’ Viewpoint on Diagnostic Imaging Services Market Scenario
Rise in adoption of diagnostic imaging is driving the global diagnostic imaging services market. CT scan is a commonly used technology for the diagnosis of various chronic diseases. Integration of advanced technologies in medical imaging is significantly boosting the efficiency of diagnosis. Major technologies include Artificial Intelligence (AI), 3D imaging, diagnostic wearables, and remote reading solutions. AI in diagnostic imaging helps achieve quicker scans, and provides life-changing insights regarding various diseases. The combined capabilities of hardware miniaturization, AI, and computer vision have allowed diagnostic imaging to be mobile. Companies operating in the global diagnostic imaging services market are focusing on reducing the cost of diagnosis to increase their market share.
Diagnostic imaging services are used to monitor and diagnose any medical condition. Different types of diagnostic imaging services include X-ray imaging procedures, MRI scans, CT scans, ultrasounds, and nuclear imaging. Diagnostic radiology and digital mammography are used in diagnostic imaging centers for cancer diagnostics.
Diagnostic radiology is employed to capture pictures of bones and anatomy within the body during diagnosis. X-rays, ultrasound, CT and MRI scans, and nuclear medicine scans are some examples of diagnostic radiology. Digital mammography records the radiographic image electronically in a digital format using computer-based electronic conductors. It is used in the early screening and diagnosing of breast diseases.
Medical imaging plays a critical role in identification of chronic disorders. Sedentary lifestyle and aging population have resulted in various chronic diseases such as cancer, cardiovascular disease, obesity, and diabetes. Significant decline in fertility and improving longevity are prominent factors that lead to an aging population. According to the United Nations’ 2017 report, the geriatric population is expected to reach 2.1 billion by 2050 from 962 million in 2017. Similarly, the number of elderly people in the U.S. is estimated to increase by 6.3% between 2017 and 2050 to reach 108.4 million by 2050. Furthermore, the population of baby boomers is rising significantly. This age group is susceptible to a wide range of chronic disorders such as cancer, kidney diseases, spinal disorders, and cardiovascular diseases. Demand for diagnostic imaging increases as a person ages. According to the National Institutes of Health, patients above 65 years undergo diagnostic imaging two or more times the rate of younger people. This is boosting the demand for diagnostic imaging services.
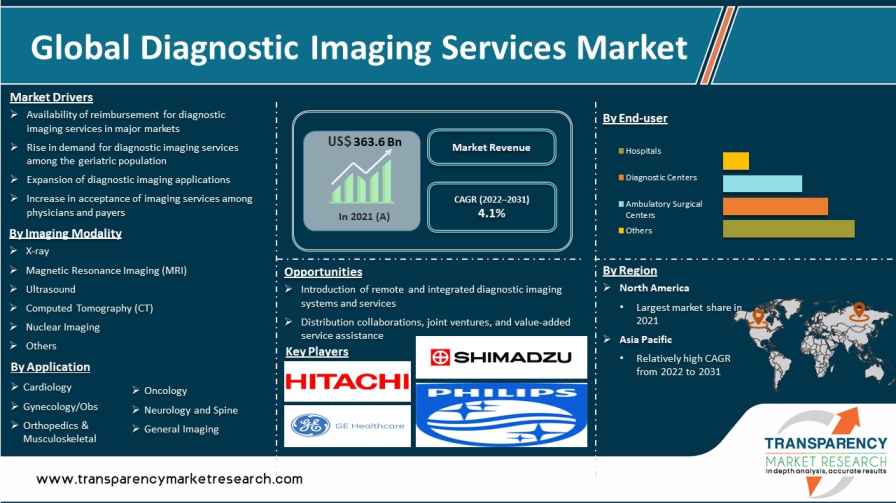
Diagnostic imaging performs a key role in the prevention and early diagnosis/treatment of diseases. Governments across the globe allocate substantial annual budgets for reimbursement of these services. Reimbursement for diagnostic imaging services is available in major markets such as the U.S., Western Europe, Japan, Australia, and China. Reimbursement for diagnostic imaging services varies across regions. The Centers for Medicare & Medicaid Services (CMS) covers radiology and other diagnostic services in the U.S., which are billed under Medicare Part B to Medicare carriers. More than 400 million imaging services are provided to Medicare beneficiaries annually in the U.S. According to CMS regulatory update 2019, interventional radiology services are likely to witness a 2% increase in payment by Medicare under the Medicare Physician Fee Schedule (MPFS). Similarly, the Government of China has taken initiatives to provide some form of insurance to nearly 95% of the population in the country. Thus, favorable reimbursement conditions are expected to fuel the global diagnostic imaging services market size during the forecast period.
In terms of imaging modality, the global diagnostic imaging services market has been segmented into X-ray, Magnetic Resonance Imaging (MRI), ultrasound, Computed Tomography (CT), nuclear imaging, and others. The Computed Tomography (CT) segment is anticipated to grow at a rapid pace during the forecast period due to technological advancements and rise in clinical applications across the globe. CT is a technique that employs computerized X-ray imaging to produce cross-sectional images of the body, providing doctors with a highly detailed view of different parts of the body. Technologically-advanced scanners with multi-slice capabilities of 80, 128, 256, 320, and 640-slice systems and higher speeds have been introduced in the market.
Based on application, the oncology segment dominated the diagnostic imaging services market in 2021. This trend is likely to continue during the forecast period. Growth of the segment can be ascribed to the increase in prevalence of cancer and the subsequent high adoption of diagnostic imaging procedures for the detection of various types of cancers, identification of the stage of cancer, assessment of the effectiveness of the treatment, and identification of the spread of the disease to other organs. Diagnostic imaging procedures, primarily CT scan procedures, are used to detect abnormal cell growth, identify various stages of cancer, and plan the treatment. According to the World Health Organization (WHO), cancer is one of the leading causes of morbidity and mortality across the world. Cancer rates are likely to increase by 50% to 15 million new cases by 2020. Approximately 70% of deaths due to cancer occur in low- and middle-income countries.
Based on end-user, the global diagnostic imaging services market has been classified into hospitals, ambulatory surgical centers, diagnostic centers, and others. Hospitals are the leading end-users of diagnostic imaging services, making them a vital prospect for service providers. Hospitals have a diverse range of diagnostic imaging equipment for patients; therefore, they witness a significant inflow of patients. The hospitals segment held the largest share of the market in 2021 due to the increase in recommendation of diagnostic imaging tests for quick and accurate diagnosis of medical issues in patients.
The diagnostic centers segment is expected to grow significantly during the forecast period. Market players are focusing on adopting various strategies such as joint ventures and acquisitions to increase the number of diagnostic centers that offer one-stop-shop services under one roof for all imaging needs.
According to the diagnostic imaging services market analysis, North America is a lucrative market, wherein the U.S. showcases dominance owing to the increase in technological advancements, growth in prevalence of chronic diseases, and surge in adoption of diagnostic imaging services in the medical industry in the country. North America accounted for the largest share of around 40% of the market in terms of revenue in 2021. Growth of the market in the region can be ascribed to the rise in adoption of low-dose automated CT scanners. The U.S. is expected to dominate the market in North America in the near future due to the high prevalence of chronic diseases in the country. According to a recent research by the Centers for Disease Control and Prevention, more than 80% of older individuals in the U.S. suffer from at least one chronic condition.
Europe held around 26% share of the global market in 2021. The market in the region is expected to grow at a CAGR of 4.2% during the forecast period. Asia Pacific is the fastest-growing region of the global diagnostic imaging services market. Japan, India, and China account for significant market share in the region. Expansion of manufacturing plants for diagnostic imaging tools and equipment, significant growth in healthcare and medical tourism industries, and increase in adoption of new diagnostic imaging services are fueling the diagnostic imaging services market in Asia Pacific.
The global diagnostic imaging services market is consolidated, with the presence of a limited number of service providers. Key players are establishing newer diagnostic centers with high-end diagnostic imaging modalities to meet the rising demand. New entrants must focus on collaborations and service agreements with hospitals to gain initial business growth. Players operating in the market include RadNet, Inc., Center for Diagnostic Imaging (CDI), MedQuest Associates, Inc., Siemens Healthineers, Hitachi, Ltd., Carestream Health, Koninklijke Philips N.V., GE Healthcare, Shimadzu Corporation, and Dignity Health (CommonSpirit Health).
Companies providing diagnostic imaging services are focusing on facility acquisition and formation of joint ventures to increase their geographic presence, particularly in North America. Partnerships and joint ventures allow service providers to collaborate with exceptional radiologists who have been providing patient-centered care in specific regions, enabling them to serve a larger volume of patients. In February 2019, RadNet Inc. signed a definitive agreement to acquire the outpatient radiology practice of Kern Radiology Medical Group, Inc. The firm owns five imaging centers based in California, providing multimodal offerings including MRI, CT, nuclear medicine, ultrasound and bone density, and interventional procedures. The strategy enabled the company to expand its presence in the existing market and broaden its customer base in the U.S.
Each of these players has been profiled in the diagnostic imaging services market report based on parameters such as company overview, financial overview, business strategies, product portfolio, business segments, and recent developments.
|
Attribute |
Detail |
|
Market Size Value in 2021 |
US$ 363.6 Bn |
|
Market Forecast Value in 2031 |
US$ 544.7 Bn |
|
Growth Rate (CAGR) for 2022-2031 |
4.1% |
|
Forecast Period |
2022–2031 |
|
Historical Data Available for |
2017–2020 |
|
Quantitative Units |
US$ Bn |
|
Market Analysis |
It includes segment analysis at global as well as regional level. Moreover, qualitative analysis includes drivers, restraints, opportunities, key trends, and parent industry overview. |
|
Competition Landscape |
|
|
Format |
Electronic (PDF) + Excel |
|
Market Segmentation |
|
|
Regions Covered |
|
|
Countries Covered |
|
|
Companies Profiled |
|
|
Customization Scope |
Available upon request |
|
Pricing |
Available upon request |
The global diagnostic imaging services market was valued at US$ 363.6 Bn in 2021.
The global market is projected to reach more than US$ 544.7 Bn by 2031.
The global diagnostic imaging services market is anticipated to grow at a CAGR of 4.1% from 2022 to 2031.
Increase in demand for diagnostic imaging services among the geriatric population is a key trend that affects market growth.
RadNet, Inc., Center for Diagnostic Imaging (CDI), MedQuest Associates, Inc., Siemens Healthineers, Hitachi, Ltd., Carestream Health, Koninklijke Philips N.V., GE Healthcare, Shimadzu Corporation, and Dignity Health (CommonSpirit Health).
1. Preface
1.1. Market Definition and Scope
1.2. Market Segmentation
1.3. Key Research Objectives
1.4. Research Highlights
2. Assumptions and Research Methodology
3. Executive Summary: Global Diagnostic Imaging Services Market
4. Market Overview
4.1. Introduction
4.1.1. Imaging Modality Definition
4.2. Overview
4.3. Market Dynamics
4.3.1. Drivers
4.3.2. Restraints
4.3.3. Opportunities
4.4. Global Diagnostic Imaging Services Market Analysis and Forecast, 2017 - 2031
4.4.1. Market Revenue Projections (US$ Mn)
5. Key Insights
5.1. Key Industry Developments
5.2. Installed Base Scenario
5.3. Reimbursement Scenario Assessment
5.4. Regulatory Scenario Assessment
5.5. Key Disease Prevalence Statistics
5.6. List of Private Diagnostic Centers
5.7. Covid-19 Impact Analysis
6. Global Diagnostic Imaging Services Market Analysis and Forecast, By Imaging Modality
6.1. Introduction & Definition
6.2. Key Findings / Developments
6.3. Market Value Forecast By Imaging Modality, 2017 - 2031
6.3.1. X-ray
6.3.2. Magnetic Resonance Imaging (MRI)
6.3.3. Ultrasound
6.3.4. Computed Tomography (CT)
6.3.5. Nuclear Imaging
6.3.6. Others
6.4. Market Attractiveness By Imaging Modality
7. Global Diagnostic Imaging Services Market Analysis and Forecast, By Application
7.1. Introduction & Definition
7.2. Key Findings / Developments
7.3. Market Value Forecast By Application, 2017 - 2031
7.3.1. Cardiology
7.3.2. Gynecology/Obs
7.3.3. Oncology
7.3.4. Orthopedics & Musculoskeletal
7.3.5. Neurology & Spine
7.3.6. General Imaging
7.4. Market Attractiveness By Application
8. Global Diagnostic Imaging Services Market Analysis and Forecast, By End-user
8.1. Introduction & Definition
8.2. Key Findings / Developments
8.3. Market Value Forecast By End-user, 2017 - 2031
8.3.1. Hospitals
8.3.2. Ambulatory Surgical Centers
8.3.3. Diagnostic Centers
8.3.4. Others
8.4. Market Attractiveness By End-user
9. Global Diagnostic Imaging Services Market Analysis and Forecast, By Region
9.1. Key Findings
9.2. Market Value Forecast By Region
9.2.1. North America
9.2.2. Europe
9.2.3. Asia Pacific
9.2.4. Latin America
9.2.5. Middle East & Africa
9.3. Market Attractiveness By Country/Region
10. North America Diagnostic Imaging Services Market Analysis and Forecast
10.1. Introduction
10.1.1. Key Findings
10.2. Market Value Forecast By Imaging Modality, 2017 - 2031
10.2.1. X-ray
10.2.2. Magnetic Resonance Imaging (MRI)
10.2.3. Ultrasound
10.2.4. Computed Tomography (CT)
10.2.5. Nuclear Imaging
10.2.6. Others
10.3. Market Value Forecast By Application, 2017 - 2031
10.3.1. Cardiology
10.3.2. Gynecology/Obs
10.3.3. Oncology
10.3.4. Orthopedics & Musculoskeletal
10.3.5. Neurology & Spine
10.3.6. General Imaging
10.4. Market Value Forecast By End-user, 2017 - 2031
10.4.1. Hospitals
10.4.2. Ambulatory Surgical Centers
10.4.3. Diagnostic Centers
10.4.4. Others
10.5. Market Value Forecast By Country, 2017 - 2031
10.5.1. U.S.
10.5.2. Canada
10.6. Market Attractiveness Analysis
10.6.1. By Imaging Modality
10.6.2. By Application
10.6.3. By End-user
10.6.4. By Country
11. Europe Diagnostic Imaging Services Market Analysis and Forecast
11.1. Introduction
11.1.1. Key Findings
11.2. Market Value Forecast By Imaging Modality, 2017 - 2031
11.2.1. X-ray
11.2.2. Magnetic Resonance Imaging (MRI)
11.2.3. Ultrasound
11.2.4. Computed Tomography (CT)
11.2.5. Nuclear Imaging
11.2.6. Others
11.3. Market Value Forecast By Application, 2017 - 2031
11.3.1. Cardiology
11.3.2. Gynecology/Obs
11.3.3. Oncology
11.3.4. Orthopedics & Musculoskeletal
11.3.5. Neurology & Spine
11.3.6. General Imaging
11.4. Market Value Forecast By End-user, 2017 - 2031
11.4.1. Hospitals
11.4.2. Ambulatory Surgical Centers
11.4.3. Diagnostic Centers
11.4.4. Others
11.5. Market Value Forecast By Country, 2017 - 2031
11.5.1. Germany
11.5.2. U.K.
11.5.3. France
11.5.4. Spain
11.5.5. Italy
11.5.6. Rest of Europe
11.6. Market Attractiveness Analysis
11.6.1. By Imaging Modality
11.6.2. By Application
11.6.3. By End-user
11.6.4. By Country
12. Asia Pacific Diagnostic Imaging Services Market Analysis and Forecast
12.1. Introduction
12.1.1. Key Findings
12.2. Market Value Forecast By Imaging Modality, 2017 - 2031
12.2.1. X-ray
12.2.2. Magnetic Resonance Imaging (MRI)
12.2.3. Ultrasound
12.2.4. Computed Tomography (CT)
12.2.5. Nuclear Imaging
12.2.6. Others
12.3. Market Value Forecast By Application, 2017 - 2031
12.3.1. Cardiology
12.3.2. Gynecology/Obs
12.3.3. Oncology
12.3.4. Orthopedics & Musculoskeletal
12.3.5. Neurology & Spine
12.3.6. General Imaging
12.4. Market Value Forecast By End-user, 2017 - 2031
12.4.1. Hospitals
12.4.2. Ambulatory Surgical Centers
12.4.3. Diagnostic Centers
12.4.4. Others
12.5. Market Value Forecast By Country, 2017 - 2031
12.5.1. China
12.5.2. Japan
12.5.3. India
12.5.4. Australia & New Zealand
12.5.5. Rest of Asia Pacific
12.6. Market Attractiveness Analysis
12.6.1. By Imaging Modality
12.6.2. By Application
12.6.3. By End-user
12.6.4. By Country
13. Latin America Diagnostic Imaging Services Market Analysis and Forecast
13.1. Introduction
13.1.1. Key Findings
13.2. Market Value Forecast By Imaging Modality, 2017 - 2031
13.2.1. X-ray
13.2.2. Magnetic Resonance Imaging (MRI)
13.2.3. Ultrasound
13.2.4. Computed Tomography (CT)
13.2.5. Nuclear Imaging
13.2.6. Others
13.3. Market Value Forecast By Application, 2017 - 2031
13.3.1. Cardiology
13.3.2. Gynecology/Obs
13.3.3. Oncology
13.3.4. Orthopedics & Musculoskeletal
13.3.5. Neurology & Spine
13.3.6. General Imaging
13.4. Market Value Forecast By End-user, 2017 - 2031
13.4.1. Hospitals
13.4.2. Ambulatory Surgical Centers
13.4.3. Diagnostic Centers
13.4.4. Others
13.5. Market Value Forecast By Country, 2017 - 2031
13.5.1. Brazil
13.5.2. Mexico
13.5.3. Rest of Latin America
13.6. Market Attractiveness Analysis
13.6.1. By Imaging Modality
13.6.2. By Application
13.6.3. By End-user
13.6.4. By Country
14. Middle East & Africa Diagnostic Imaging Services Market Analysis and Forecast
14.1. Introduction
14.1.1. Key Findings
14.2. Market Value Forecast By Imaging Modality, 2017 - 2031
14.2.1. X-ray
14.2.2. Magnetic Resonance Imaging (MRI)
14.2.3. Ultrasound
14.2.4. Computed Tomography (CT)
14.2.5. Nuclear Imaging
14.2.6. Others
14.3. Market Value Forecast By Application, 2017 - 2031
14.3.1. Cardiology
14.3.2. Gynecology/Obs
14.3.3. Oncology
14.3.4. Orthopedics & Musculoskeletal
14.3.5. Neurology & Spine
14.3.6. General Imaging
14.4. Market Value Forecast By End-user, 2017 - 2031
14.4.1. Hospitals
14.4.2. Ambulatory Surgical Centers
14.4.3. Diagnostic Centers
14.4.4. Others
14.5. Market Value Forecast By Country, 2017 - 2031
14.5.1. GCC Countries
14.5.2. South Africa
14.5.3. Rest of Middle East & Africa
14.6. Market Attractiveness Analysis
14.6.1. By Imaging Modality
14.6.2. By Application
14.6.3. By End-user
14.6.4. By Country
15. Competition Landscape
15.1. Market Player – Competition Matrix (By Tier and Size of companies)
15.2. Market Share Analysis By Company (2021)
15.3. Company Profiles
15.3.1. RadNet, Inc.
15.3.1.1. Company Overview (HQ, Business Segments, Employee Strength)
15.3.1.2. Financial Analysis
15.3.1.3. Growth Strategies
15.3.1.4. SWOT Analysis
15.3.2. Center for Diagnostic Imaging (CDI)
15.3.2.1. Company Overview (HQ, Business Segments, Employee Strength)
15.3.2.2. Financial Analysis
15.3.2.3. Growth Strategies
15.3.2.4. SWOT Analysis
15.3.3. MedQuest Associates, Inc.
15.3.3.1. Company Overview (HQ, Business Segments, Employee Strength)
15.3.3.2. Financial Analysis
15.3.3.3. Growth Strategies
15.3.3.4. SWOT Analysis
15.3.4. Siemens Healthineers
15.3.4.1. Company Overview (HQ, Business Segments, Employee Strength)
15.3.4.2. Financial Analysis
15.3.4.3. Growth Strategies
15.3.4.4. SWOT Analysis
15.3.5. Hitachi, Ltd.
15.3.5.1. Company Overview (HQ, Business Segments, Employee Strength)
15.3.5.2. Financial Analysis
15.3.5.3. Growth Strategies
15.3.5.4. SWOT Analysis
15.3.6. Carestream Health
15.3.6.1. Company Overview (HQ, Business Segments, Employee Strength)
15.3.6.2. Financial Analysis
15.3.6.3. Growth Strategies
15.3.6.4. SWOT Analysis
15.3.7. Koninklijke Philips N.V.
15.3.7.1. Company Overview (HQ, Business Segments, Employee Strength)
15.3.7.2. Financial Analysis
15.3.7.3. Growth Strategies
15.3.7.4. SWOT Analysis
15.3.8. GE Healthcare
15.3.8.1. Company Overview (HQ, Business Segments, Employee Strength)
15.3.8.2. Financial Analysis
15.3.8.3. Growth Strategies
15.3.8.4. SWOT Analysis
15.3.9. Shimadzu Corporation
15.3.9.1. Company Overview (HQ, Business Segments, Employee Strength)
15.3.9.2. Financial Analysis
15.3.9.3. Growth Strategies
15.3.9.4. SWOT Analysis
15.3.10. Dignity Health (CommonSpirit Health)
15.3.10.1. Company Overview (HQ, Business Segments, Employee Strength)
15.3.10.2. Financial Analysis
15.3.10.3. Growth Strategies
15.3.10.4. SWOT Analysis
List of Tables
Table 01: CPT Codes- Diagnostic Imaging Procedures (Snapshot)
Table 02: CPT Codes- Diagnostic Imaging Procedures (Snapshot)
Table 03: List of Private Diagnostic Centers – North America
Table 04: List of Private Diagnostic Centers – Europe
Table 05: List of Private Diagnostic Centers – Europe
Table 06: List of Private Diagnostic Centers – Asia Pacific
Table 07: List of Private Diagnostic Centers – Australia & Brazil
Table 08: List of Private Diagnostic Centers – Dubai
Table 09: Global Diagnostic Imaging Services Market Value (US$ Bn) Forecast, by Imaging Modality, 2017–2031
Table 10: Global Diagnostic Imaging Services Market Value (US$ Bn) Forecast, by Application, 2017–2031
Table 11: Global Diagnostic Imaging Services Market Value (US$ Bn) Forecast, by End-user, 2017–2031
Table 12: Global Diagnostic Imaging Services Market Size (US$ Bn) Forecast, by Region, 2017–2031
Table 13: North America Diagnostic Imaging Services Market Value (US$ Bn) Forecast, by Country, 2017–2031
Table 14: North America Diagnostic Imaging Services Market Value (US$ Bn) Forecast, by Imaging Modality, 2017–2031
Table 15: North America Diagnostic Imaging Services Market Value (US$ Bn) Forecast, by Application, 2017‒2027
Table 17: Europe Diagnostic Imaging Services Market Value (US$ Bn) Forecast, by Country, 2017–2031
Table 18: Europe Diagnostic Imaging Services Market Value (US$ Bn) Forecast, by Imaging Modality, 2017–2031
Table 19: Europe Diagnostic Imaging Services Market Value (US$ Bn) Forecast, by Application, 2017‒2027
Table 20: Europe Diagnostic Imaging Services Market Value (US$ Bn) Forecast, by End-user, 2017‒2027
Table 21: Asia Pacific Diagnostic Imaging Services Market Value (US$ Bn) Forecast, by Country/Sub-region, 2017–2031
Table 22: Asia Pacific Diagnostic Imaging Services Market Value (US$ Bn) Forecast, by Imaging Modality, 2017–2031
Table 23: Asia Pacific Diagnostic Imaging Services Market Value (US$ Bn) Forecast, by Application, 2017‒2027
Table 24: Asia Pacific Diagnostic Imaging Services Market Value (US$ Bn) Forecast, by End-user, 2017‒2027
Table 25: Latin America Diagnostic Imaging Services Market Value (US$ Bn) Forecast, by Country/Sub-region, 2017–2031
Table 26: Latin America Diagnostic Imaging Services Market Value (US$ Bn) Forecast, by Imaging Modality, 2017–2031
Table 27: Latin America Diagnostic Imaging Services Market Value (US$ Bn) Forecast, by Application, 2017‒2027
Table 28: Latin America Diagnostic Imaging Services Market Value (US$ Bn) Forecast, by End-user, 2017‒2027
Table 29: Middle East & Africa Diagnostic Imaging Services Market Value (US$ Bn) Forecast, by Country/Sub-region, 2017–2031
Table 30: Middle East & Africa Diagnostic Imaging Services Market Value (US$ Bn) Forecast, by Imaging Modality, 2017–2031
Table 31: Middle East & Africa Diagnostic Imaging Services Market Value (US$ Bn) Forecast, by Application, 2017‒2027
Table 32: Middle East & Africa Diagnostic Imaging Services Market Value (US$ Bn) Forecast, by End-user, 2017‒2027
List of Figures
Figure 01: Global Diagnostic Imaging Services Market Snapshot
Figure 02: Global Diagnostic Imaging Services Market Value (US$ Bn) and Distribution (%), by Region, 2021 and 2031
Figure 03: Global Diagnostic Imaging Services Market Value (US$ Bn) Forecast, 2017–2031
Figure 04: Global Diagnostic Imaging Services Market Value Share (%), by Imaging Modality, 2021
Figure 05: Global Diagnostic Imaging Services Market Value Share (%), by Application, 2021
Figure 06: Global Diagnostic Imaging Services Market Value Share (%), by End-user, 2021
Figure 07: Global Diagnostic Imaging Services Market Value Share (%), by Region, 2021
Figure 08: Diagnostic Imaging Services Market – Key Mergers and Acquisitions
Figure 09: Diagnostic Imaging Services Market – Joint Ventures and Partnerships
Figure 10: Installed Base – CT Scanners
Figure 11: Installed Base – Magnetic Resonance Imaging Units
Figure 12: Installed Base – PET Scanners
Figure 13: MIS Standards - India
Figure 14: Global Prevalence of Cancer, Age-standardized Number of Cases, per 100,000 population
Figure 15: Global Cancer Estimations (Number of people), by New Cases & Deaths
Figure 16: U.S. Cancer Prevalence (%), By Type of Cancer
Figure 17: Global Prevalence of CVD, Number of Deaths, per 100,000
Figure 18: U.S. Prevalence of CVD (%), by Age
Figure 19: Global Diagnostic Imaging Services Market Value Share Analysis, by Imaging Modality, 2021 and 2031
Figure 20: Global Diagnostic Imaging Services Market Value (US$ Bn) and Y-o-Y Growth (%) Forecast, by X-ray, 2017–2031
Figure 21: Global Diagnostic Imaging Services Market Value (US$ Bn) and Y-o-Y Growth (%) Forecast, by Magnetic Resonance Imaging, 2017–2031
Figure 22: Global Diagnostic Imaging Services Market Value (US$ Bn) and Y-o-Y Growth (%) Forecast, by Ultrasound, 2017–2031
Figure 23: Global Diagnostic Imaging Services Market Value (US$ Bn) and Y-o-Y Growth (%) Forecast, by Computed Tomography (CT), 2017–2031
Figure 24: Global Diagnostic Imaging Services Market Value (US$ Bn) and Y-o-Y Growth (%) Forecast, by Nuclear Imaging, 2017–2031
Figure 25: Global Diagnostic Imaging Services Market Value (US$ Bn) and Y-o-Y Growth (%) Forecast, by Others, 2017–2031
Figure 26: Global Diagnostic Imaging Services Market Attractiveness, by Imaging Modality, 2022‒2031
Figure 27: Global Diagnostic Imaging Services Market - Imaging Modality Trends
Figure 28: Global Diagnostic Imaging Services Market Value Share Analysis, by Application, 2021 and 2031
Figure 29: Global Diagnostic Imaging Services Market Value (US$ Bn) and Y-o-Y Growth (%) Forecast, by Cardiology, 2017–2031
Figure 30: Global Diagnostic Imaging Services Market Value (US$ Bn) and Y-o-Y Growth (%) Forecast, by Gynecology/Obs, 2017–2031
Figure 31: Global Diagnostic Imaging Services Market Value (US$ Bn) and Y-o-Y Growth (%) Forecast, by Orthopedics & Musculoskeletal, 2017–2031
Figure 32: Global Diagnostic Imaging Services Market Value (US$ Bn) and Y-o-Y Growth (%) Forecast, by Oncology, 2017–2031
Figure 33: Global Diagnostic Imaging Services Market Value (US$ Bn) and Y-o-Y Growth (%) Forecast, by Neurology & Spine, 2017–2031
Figure 34: Global Diagnostic Imaging Services Market Value (US$ Bn) and Y-o-Y Growth (%) Forecast, by General Imaging, 2017–2031
Figure 35: Global Diagnostic Imaging Services Market Attractiveness, by Application, 2022‒2031
Figure 36: Global Diagnostic Imaging Services Market - Application Trends
Figure 37: Global Diagnostic Imaging Services Market Value Share Analysis, by End-user, 2021 and 2027
Figure 38: Global Diagnostic Imaging Services Market Value (US$ Bn) and Y-o-Y Growth (%) Forecast, by Hospitals, 2017–2031
Figure 39: Global Diagnostic Imaging Services Market Value (US$ Bn) and Y-o-Y Growth (%) Forecast, by Diagnostic Imaging Centers, 2017–2031
Figure 40: Global Diagnostic Imaging Services Market Value (US$ Bn) and Y-o-Y Growth (%) Forecast, by Ambulatory Surgical Centers, 2017–2031
Figure 41: Global Diagnostic Imaging Services Market Value (US$ Bn) and Y-o-Y Growth (%) Forecast, by Others, 2017–2031
Figure 42: Global Diagnostic Imaging Services Market Attractiveness, by End-user, 2022‒2031
Figure 43: Global Diagnostic Imaging Services Market - End-user Trends
Figure 44: Global Diagnostic Imaging Services Treatment Market Value Share Analysis, by Region, 2021 and 2031
Figure 45: Global Diagnostic Imaging Services Market Attractiveness, by Region, 2022–2031
Figure 46: North America Diagnostic Imaging Services Market Value (US$ Bn) and Y-o-Y Growth (%) Forecast, 2017–2031
Figure 47: North America Diagnostic Imaging Services Market Value Share Analysis, by Country, 2021 and 2031
Figure 48: North America Diagnostic Imaging Services Market Attractiveness Analysis, by Country, 2022–2031
Figure 49: North America Diagnostic Imaging Services Market Value Share (%), by Imaging Modality, 2021 and 2031
Figure 50: North America Diagnostic Imaging Services Market Attractiveness, by Imaging Modality, 2022–2031
Figure 51: North America Diagnostic Imaging Services Market Value Share (%), by Application, 2021 and 2031
Figure 52: North America Diagnostic Imaging Services Market Attractiveness, by Application, 2022–2031
Figure 53: North America Diagnostic Imaging Services Market Value Share (%), by End-user, 2021 and 2031
Figure 54: North America Diagnostic Imaging Services Market Attractiveness, by End-user, 2022–2031
Figure 55: Europe Diagnostic Imaging Services Market Value (US$ Bn) and Y-o-Y Growth (%) Forecast, 2017–2031
Figure 56: Europe Diagnostic Imaging Services Market Value Share Analysis, by Country/Sub-region, 2021 and 2031
Figure 57: Europe Diagnostic Imaging Services Market Attractiveness Analysis, by Country/Sub-region, 2022–2031
Figure 58: Europe Diagnostic Imaging Services Market Value Share (%), by Imaging Modality, 2021 and 2031
Figure 59: Europe Diagnostic Imaging Services Market Attractiveness, by Imaging Modality, 2022–2031
Figure 60: Europe Diagnostic Imaging Services Market Value Share (%), by Application, 2021 and 2031
Figure 61: Europe Diagnostic Imaging Services Market Attractiveness, by Application, 2022–2031
Figure 62: Europe Diagnostic Imaging Services Market Value Share (%), by End-user, 2021 and 2031
Figure 63: Europe Diagnostic Imaging Services Market Attractiveness, by End-user, 2022–2031
Figure 64: Asia Pacific Diagnostic Imaging Services Market Value (US$ Bn) and Y-o-Y Growth (%) Forecast, 2017–2031
Figure 64: Asia Pacific Diagnostic Imaging Services Market Value Share Analysis, by Country/Sub-region, 2021 and 2031
Figure 65: Asia Pacific Diagnostic Imaging Services Market Attractiveness Analysis, by Country/Sub-region, 2022–2031
Figure 66: Asia Pacific Diagnostic Imaging Services Market Value Share (%), by Imaging Modality, 2021 and 2031
Figure 67: Asia Pacific Diagnostic Imaging Services Market Attractiveness, by Imaging Modality, 2022–2031
Figure 68: Asia Pacific Diagnostic Imaging Services Market Value Share (%), by Application, 2021 and 2031
Figure 69: Asia Pacific Diagnostic Imaging Services Market Attractiveness, by Application, 2022–2031
Figure 70: Asia Pacific Diagnostic Imaging Services Market Value Share (%), by End-user, 2021 and 2031
Figure 71: Asia Pacific Diagnostic Imaging Services Market Attractiveness, by End-user, 2022–2031
Figure 72: Latin America Diagnostic Imaging Services Market Value (US$ Bn) and Y-o-Y Growth (%) Forecast, 2017–2031
Figure 73: Latin America Diagnostic Imaging Services Market Value Share Analysis, by Country/Sub-region, 2021 and 2031
Figure 74: Latin America Diagnostic Imaging Services Market Attractiveness Analysis, by Country/Sub-region, 2022–2031
Figure 75: Latin America Diagnostic Imaging Services Market Value Share (%), by Imaging Modality, 2021 and 2031
Figure 76: Latin America Diagnostic Imaging Services Market Attractiveness, by Imaging Modality, 2022–2031
Figure 77: Latin America Diagnostic Imaging Services Market Value Share (%), by Application, 2021 and 2031
Figure 78: Latin America Diagnostic Imaging Services Market Attractiveness, by Application, 2022–2031
Figure 79: Latin America Diagnostic Imaging Services Market Value Share (%), by End-user, 2021 and 2031
Figure 80: Latin America Diagnostic Imaging Services Market Attractiveness, by End-user, 2022–2031
Figure 81: Middle East & Africa Diagnostic Imaging Services Market Value (US$ Bn) and Y-o-Y Growth (%) Forecast, 2017–2031
Figure 82: Middle East & Africa Diagnostic Imaging Services Market Value Share Analysis, by Country/Sub-region, 2021 and 2031
Figure 83: Middle East & Africa Diagnostic Imaging Services Market Attractiveness Analysis, by Country/Sub-region, 2022–2031
Figure 84: Middle East & Africa Diagnostic Imaging Services Market Value Share (%), by Imaging Modality, 2021 and 2031
Figure 85: Middle East & Africa Diagnostic Imaging Services Market Attractiveness, by Imaging Modality, 2022–2031
Figure 86: Middle East & Africa Diagnostic Imaging Services Market Value Share (%), by Application, 2021 and 2031
Figure 87: Middle East & Africa Diagnostic Imaging Services Market Attractiveness, by Application, 2022–2031
Figure 88: Middle East & Africa Diagnostic Imaging Services Market Value Share (%), by End-user, 2021 and 2031
Figure 89: Middle East & Africa Diagnostic Imaging Services Market Attractiveness, by End-user, 2022–2031
Copyright © Transparency Market Research, Inc. All Rights reserved
Trust Online

Diagnostic Imaging Services Market