
Reports
Reports
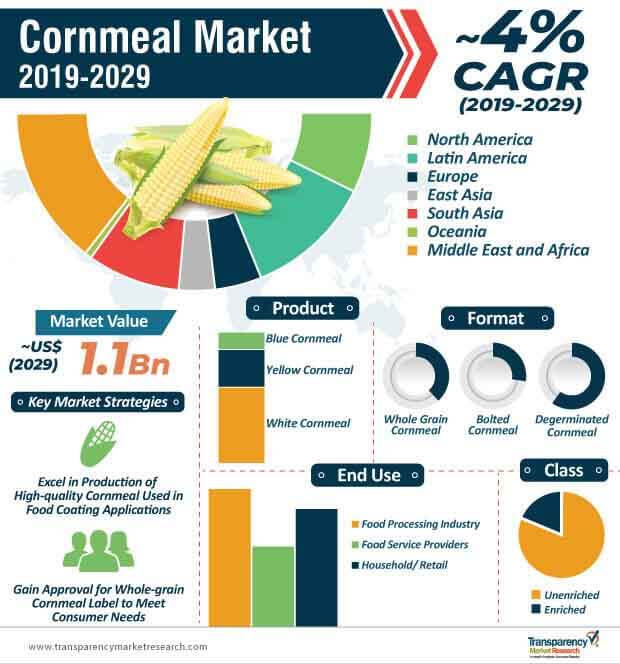
Cornmeal has been witnessing growing demand in several bakery applications. It also serves as a key ingredient in polenta, tortillas, and cornbread. As such, cornbread is largely popular in the U.S. This trend is anticipated to surge during the forecast period, and is estimated to contribute to the large market value share of the North America cornmeal market. There is growing demand for cornmeal with high fiber content in the U.S. Hence, companies in the cornmeal market are increasing the production of stone ground cornmeal that adds more flavor, is grainier, and is also more nutritious than cornmeal produced by steel milling.
Household / retail accounts for the highest production amongst all end uses in the cornmeal market, with an estimated output of ~986,700 metric tons by the end of 2029. Individuals in households and restaurants are using cornmeal for innovative food coating systems. Breadings and batters are commonly referred to as coatings that add value to products offered by hoteliers, since cornmeal provides the additional sensory dimension to meat cuisines through color, flavor, and texture. Coating serves as a cost-efficient technique, increasingly used by processors to produce emulsified products. To serve the needs of health-conscious consumers, hoteliers are using grain-based mixtures of cornmeal to boost nutrition in meals. Coatings also help serve other value-add functions, such as retaining moisture to produce more succulent-finished food products.
Growing awareness about gluten free products has intensified the demand for cornmeal. The high presence of gluten-intolerant individuals has triggered the demand for foods with cornmeal. Thus, companies in the cornmeal market are capitalizing on this trend of gluten-free products and are expanding their portfolios in cereals, chips, grain alcohol, and breading for frying products. The gluten-free aspect is creating a ripple effect in the domain of grain-based flours. The surging demand for gluten-free grain-based flours has catalyzed the demand for oats, millets, and cornmeal.
The rapidly growing baking industry is also adding to the growth of gluten-free cornmeal-based grain flours. Companies in the cornmeal market are increasing their scope for incremental opportunities through excessive sales of bakery products such as breads, cookies, and pastries. There is growing demand for cornmeal-based grain flours in the U.S., Latin America, and South Asia. The trend of gourmet food has been encircling many African-American kitchens lately. The culinary foothold of grits in Southern cuisines of African-American individuals is very prominent. Thus, the whole-grain and gluten-free trend has spurred the exploration of corn-based products such as stone-ground grits.
Consumers are becoming increasingly aware about the health benefits of cornmeal. However, certain dietary disadvantages of cornmeal have led to resistance for its consumption from consumers, as they look for substitutes.
For instance, corn is found to have too many carbohydrates. It has also been found that corn is difficult to digest, and is high in sugar and fat. Due to this, manufacturers in the cornmeal market are observing a shift in consumer preferences. Consumers are consciously looking for cornmeal substitutes, such as breadcrumbs, in various food processing applications.
Dietary disadvantages of corn explain the modest growth of the cornmeal market, which is projected to account for a CAGR of ~4% throughout the forecast period. However, the cornmeal market is highly fragmented; ~89% of unorganized players who currently dominate the global landscape, with a revenue ballpark of ~US$ 660 million in the year 2018. Manufacturers are catering to the needs of consumers who are recommended to incorporate cornmeal into their diets. For instance, manufacturers are increasing focus on whole grain cereals that are highly recommended for atherosclerosis patients. Cornmeal comes under the category of nutrient-dense foods that are necessary to fulfill the dietary requirements of atherosclerosis patients. Manufacturers are capitalizing on the growing demand for cornmeal from elderly individuals suffering from osteoporosis.
Analysts’ Viewpoint
Organic grain farmers are introducing grain share programs that educate consumers about the alternatives to mainstream products. Through these programs, consumers are becoming increasingly aware about heritage red cornmeal used to prepare cornbread. However, the ongoing debate about GMO corn being unhealthy has created an ambiguous perception amongst many consumers. Hence, companies in the cornmeal market are increasing their efforts to gain approval for clean labels, such as 'whole-grain cornmeal', to serve the needs of consumers. Companies should increase their capabilities to better the quality of cornmeal used in baking applications. They should also increase their production capacities in whole grain and gluten-free products.
Cornmeal Market: Overview
Latin America and Africa to Remain Lucrative Cornmeal Markets
Millennials to Account for Increased Demand for Whole Corn Cornmeal
Innovative Taste Profiles of Cornmeal to Bolster Market Growth
Nutrition Benefits of Cornmeal to Increase Usage by Food Industry
Cornmeal Market: Competitive Landscape
Cornmeal Market: Key Developments
Some of the key developments seen in the cornmeal market during the past few years are as follows:
1. Global Cornmeal Market - Executive Summary
1.1. Global Cornmeal Market Country Analysis
1.2. Application - Product Mapping
1.3. Competition Blueprint
1.4. Technology Time Line Mapping
1.5. TMR Analysis and Recommendations
2. Market Introduction
2.1. Market Definition
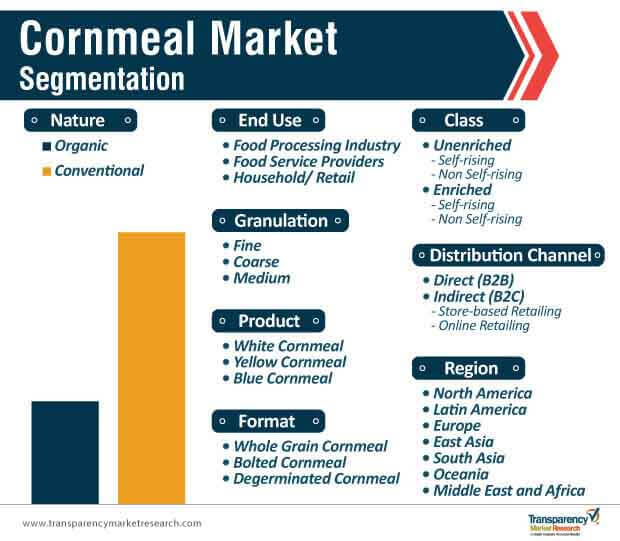
2.2. Market Taxonomy
3. Market Dynamics
3.1. Macro-economic Factors
3.2. Overview for Corn Products
3.3. Cornmeal in Food Processing Industry
3.4. Cornmeal Alternatives
3.5. Drivers
3.5.1. Economic Drivers
3.5.2. Supply Side Drivers
3.5.3. Demand Side Drivers
3.6. Market Restraints
3.7. Market Opportunities
3.8. Forecast Factors – Relevance and Impact
3.9. Key Regulations and Claims
4. Global Corn Market- Trade Analysis
4.1. Corn- Exports to the World
4.2. Corn- Imports to the World
5. Global Pre-Cooked Cornmeal Market Analysis and Forecast
5.1. Market Size Analysis (2014-2018) and Forecast (2019-2029)
5.1.1. Market Value (US$ Mn) and Volume (Tons) and Y-o-Y Growth
5.1.2. Absolute $ Opportunity
5.2. Global Pre-Cooked Cornmeal Market Scenario Forecast (Optimistic, Likely and Conservative Market Conditions)
5.2.1. Forecast Factors and Relevance of Impact
5.3. Key Manufactures Operating in Pre-Cooked Cornmeal Market
5.4. Brand Analysis for Pre-Cooked Cornmeal
5.5. Unique Selling Point for Pre-Cooked Cornmeal
6. Key Market Trends
6.1. Key Trends Impacting the Market
6.2. Product Innovation / Development Trends
6.3. Deciphering Consumer Buying Pattern
7. Sentiment Analysis
7.1. Consumer Sentiment Analysis
7.2. Social Media Sentiment Analysis
8. Supply Chain Analysis
8.1. Profitability and Gross Margin Analysis By Competition
8.2. List of Active Participants- By Region
8.2.1. Raw Material Suppliers
8.2.2. Key Manufacturers
8.2.3. Key Distributor/Retailers
8.2.4. Operating Margins
9. Global Cornmeal Market Pricing Analysis
9.1. Price Point Assessment by Region
9.1.1. Manufacturer Level Pricing
9.1.2. Distributor Level Pricing
9.1.3. Retailer Level Pricing
9.2. Price Point Assessment by Product Type
9.3. Price Forecast till 2029
10. Global Cornmeal Market Analysis and Forecast
10.1. Market Size Analysis (2014-2018) and Forecast (2019-2029)
10.1.1. Market Value (US$ Mn) and Volume (Tons) and Y-o-Y Growth
10.1.2. Absolute $ Opportunity
10.2. Global Cornmeal Market Scenario Forecast (Optimistic, Likely and Conservative Market Conditions)
10.2.1. Forecast Factors and Relevance of Impact
10.2.2. Regional Cornmeal Market Business Performance Summary
11. Global Cornmeal Market Analysis By Format
11.1. Introduction
11.1.1. Y-o-Y Growth Comparison By Format
11.1.2. Basis Point Share (BPS) Analysis By Format
11.2. Cornmeal Market Size (US$ Mn) and Volume (MT) Analysis (2014-2018) & Forecast (2019-2029) By Format
11.2.1. Whole Grain Corn
11.2.2. Bolted
11.2.3. Degerminated
11.3. Market Attractiveness Analysis By Format
12. Global Cornmeal Market Analysis By Nature
12.1. Introduction
12.1.1. Y-o-Y Growth Comparison By Nature
12.1.2. Basis Point Share (BPS) Analysis By Nature
12.2. Cornmeal Market Size (US$ Mn) and Volume (MT) Analysis (2014-2018) & Forecast (2019-2029) By Nature
12.2.1. Organic
12.2.2. Conventional
12.3. Market Attractiveness Analysis By Nature
13. Global Cornmeal Market Analysis By Product Type
13.1. Introduction
13.1.1. Y-o-Y Growth Comparison By Product Type
13.1.2. Basis Point Share (BPS) Analysis By Product Type
13.2. Cornmeal Market Size (US$ Mn) and Volume (MT) Analysis (2014-2018) & Forecast (2019-2029) By Product Type
13.2.1. White Cornmeal
13.2.2. Yellow Cornmeal
13.2.3. Blue Cornmeal
13.3. Market Attractiveness Analysis By Product Type
14. Global Cornmeal Market Analysis By Granulation
14.1. Introduction
14.1.1. Y-o-Y Growth Comparison By Granulation
14.1.2. Basis Point Share (BPS) Analysis By Granulation
14.2. Cornmeal Market Size (US$ Mn) and Volume (MT) Analysis (2014-2018) & Forecast (2019-2029) By Granulation
14.2.1. Fine
14.2.2. Coarse
14.2.3. Medium
14.3. Market Attractiveness Analysis By Granulation
15. Global Cornmeal Market Analysis By End Use
15.1. Introduction
15.1.1. Y-o-Y Growth Comparison By End Use
15.1.2. Basis Point Share (BPS) Analysis By End Use
15.2. Cornmeal Market Size (US$ Mn) and Volume (MT) Analysis (2014-2018) & Forecast (2019-2029) By End Use
15.2.1. Food Processing
15.2.2. Food Service Provider
15.2.3. Retail/ Household
15.3. Market Attractiveness Analysis By End Use
16. Global Cornmeal Market Analysis By Class
16.1. Introduction
16.1.1. Y-o-Y Growth Comparison By Class
16.1.2. Basis Point Share (BPS) Analysis By Class
16.2. Cornmeal Market Size (US$ Mn) and Volume (MT) Analysis (2014-2018) & Forecast (2019-2029) By Class
16.2.1. Unenriched
16.2.1.1. Self-rising
16.2.1.2. Non-self-rising
16.2.2. Enriched
16.2.2.1. Self-rising
16.2.2.2. Non-self-rising
16.3. Market Attractiveness Analysis By Class
17. Global Cornmeal Market Analysis By Distribution Channel
17.1. Introduction
17.1.1. Y-o-Y Growth Comparison By Distribution Channel
17.1.2. Basis Point Share (BPS) Analysis By Distribution Channel
17.2. Cornmeal Market Size (US$ Mn) and Volume (MT) Analysis (2014-2018) & Forecast (2019-2029) By Distribution Channel
17.2.1. B2B
17.2.2. B2C
17.2.2.1. Store based Retailing
17.2.2.1.1. Hypermarket/ Supermarkets
17.2.2.1.2. Convenience Stores
17.2.2.1.3. Specialty Stores
17.2.2.1.4. Independent Groceries
17.2.2.2. Online Retailing
17.3. Market Attractiveness Analysis By Distribution Channel
18. Global Cornmeal Market Analysis and Forecast, By Region
18.1. Introduction
18.1.1. Basis Point Share (BPS) Analysis By Region
18.1.2. Y-o-Y Growth Projections By Region
18.2. Cornmeal Market Size (US$ Mn) and Volume (MT) & Forecast (2019-2029) Analysis By Region
18.2.1. North America
18.2.2. Latin America
18.2.3. Europe
18.2.4. East Asia
18.2.5. South Asia
18.2.6. Oceania
18.2.7. Middle East and Africa
18.3. Market Attractiveness Analysis By Region
19. North America Cornmeal Market Analysis and Forecast
19.1. Introduction
19.1.1. Basis Point Share (BPS) Analysis By Country
19.1.2. Y-o-Y Growth Projections By Country
19.2. Cornmeal Market Size (Value (US$) and Volume (MT) Analysis (2014-2018) and Forecast (2019-2029)
19.2.1. Market Attractiveness By Country
19.2.1.1. U.S.
19.2.1.2. Canada
19.2.2. By Format
19.2.3. By Nature
19.2.4. By Product Type
19.2.5. By Granulation
19.2.6. By End Use
19.2.7. By Class
19.2.8. By Distribution Channel
19.3. Market Attractiveness Analysis
19.3.1. By Country
19.3.2. By Format
19.3.3. By Nature
19.3.4. By Product Type
19.3.5. By Granulation
19.3.6. By End Use
19.3.7. By Class
19.3.8. By Distribution Channel
19.4. Drivers and Restraints: Impact Analysis
19.5. Heat Map Analysis
19.6. Market Trends
20. Latin America Cornmeal Market Analysis and Forecast
20.1. Introduction
20.1.1. Basis Point Share (BPS) Analysis By Country
20.1.2. Y-o-Y Growth Projections By Country
20.1.3. Key Regulations
20.2. Cornmeal Market Size (Value (US$) and Volume (MT) Analysis (2014-2018) and Forecast (2019-2029)
20.2.1. By Country
20.2.1.1. Brazil
20.2.1.2. Mexico
20.2.1.3. Chile
20.2.1.4. Peru
20.2.1.5. Argentina
20.2.1.6. Rest of Latin America
20.2.2. By Format
20.2.3. By Nature
20.2.4. By Product Type
20.2.5. By Granulation
20.2.6. By End Use
20.2.7. By Class
20.2.8. By Distribution Channel
20.3. Market Attractiveness Analysis
20.3.1. By Country
20.3.2. By Format
20.3.3. By Nature
20.3.4. By Product Type
20.3.5. By Granulation
20.3.6. By End Use
20.3.7. By Class
20.3.8. By Distribution Channel
20.4. Drivers and Restraints: Impact Analysis
20.5. Heat Map Analysis
20.6. Market Trends
21. Europe Cornmeal Market Analysis and Forecast
21.1. Introduction
21.1.1. Basis Point Share (BPS) Analysis By Country
21.1.2. Y-o-Y Growth Projections By Country
21.1.3. Key Regulations
21.2. Cornmeal Market Size (Value (US$) and Volume (MT) Analysis (2014-2018) and Forecast (2019-2029)
21.2.1. By Country
21.2.1.1. EU-4 (Germany, France, Italy, Spain)
21.2.1.2. U.K.
21.2.1.3. BENELUX
21.2.1.4. Nordic
21.2.1.5. Russia
21.2.1.6. Poland
21.2.1.7. Rest of Europe
21.2.2. By Format
21.2.3. By Nature
21.2.4. By Product Type
21.2.5. By Granulation
21.2.6. By End Use
21.2.7. By Class
21.2.8. By Distribution Channel
21.3. Market Attractiveness Analysis
21.3.1. By Country
21.3.2. By Format
21.3.3. By Nature
21.3.4. By Product Type
21.3.5. By Granulation
21.3.6. By End Use
21.3.7. By Class
21.3.8. By Distribution Channel
21.4. Drivers and Restraints: Impact Analysis
21.5. Heat Map Analysis
21.6. Market Trends
22. East Asia Cornmeal Market Analysis and Forecast
22.1. Introduction
22.1.1. Basis Point Share (BPS) Analysis By Country
22.1.2. Y-o-Y Growth Projections By Country
22.1.3. Key Regulations
22.2. Cornmeal Market Size (Value (US$) and Volume (MT) Analysis (2014-2018) and Forecast (2019-2029)
22.2.1. By Country
22.2.1.1. China
22.2.1.2. Japan
22.2.1.3. South Korea
22.2.2. By Format
22.2.3. By Nature
22.2.4. By Product Type
22.2.5. By Granulation
22.2.6. By End Use
22.2.7. By Class
22.2.8. By Distribution Channel
22.3. Market Attractiveness Analysis
22.3.1. By Country
22.3.2. By Format
22.3.3. By Nature
22.3.4. By Product Type
22.3.5. By Granulation
22.3.6. By End Use
22.3.7. By Class
22.3.8. By Distribution Channel
22.4. Drivers and Restraints: Impact Analysis
22.5. Heat Map Analysis
22.6. Market Trends
23. South Asia Cornmeal Market Analysis and Forecast
23.1. Introduction
23.1.1. Basis Point Share (BPS) Analysis By Country
23.1.2. Y-o-Y Growth Projections By Country
23.1.3. Key Regulations
23.2. Cornmeal Market Size (Value (US$) and Volume (MT) Analysis (2014-2018) and Forecast (2019-2029)
23.2.1. By Country
23.2.1.1. India
23.2.1.2. Pakistan
23.2.1.3. Indonesia
23.2.1.4. Thailand
23.2.1.5. Singapore
23.2.1.6. Rest of South Asia
23.2.2. By Format
23.2.3. By Nature
23.2.4. By Product Type
23.2.5. By Granulation
23.2.6. By End Use
23.2.7. By Class
23.2.8. By Distribution Channel
23.3. Market Attractiveness Analysis
23.3.1. By Country
23.3.2. By Format
23.3.3. By Nature
23.3.4. By Product Type
23.3.5. By Granulation
23.3.6. By End Use
23.3.7. By Class
23.3.8. By Distribution Channel
23.4. Drivers and Restraints: Impact Analysis
23.5. Heat Map Analysis
23.6. Market Trends
24. Oceania Cornmeal Market Analysis and Forecast
24.1. Introduction
24.1.1. Basis Point Share (BPS) Analysis By Country
24.1.2. Y-o-Y Growth Projections By Country
24.1.3. Key Regulations
24.2. Cornmeal Market Size (Value (US$) and Volume (MT) Analysis (2014-2018) and Forecast (2019-2029)
24.2.1. By Country
24.2.1.1. Australia
24.2.1.2. New Zealand
24.2.2. By Format
24.2.3. By Nature
24.2.4. By Product Type
24.2.5. By Granulation
24.2.6. By End Use
24.2.7. By Class
24.2.8. By Distribution Channel
24.3. Market Attractiveness Analysis
24.3.1. By Country
24.3.2. By Format
24.3.3. By Nature
24.3.4. By Product Type
24.3.5. By Granulation
24.3.6. By End Use
24.3.7. By Class
24.3.8. By Distribution Channel
24.4. Drivers and Restraints: Impact Analysis
24.5. Heat Map Analysis
24.6. Market Trends
25. Middle East and Africa (MEA) Cornmeal Market Analysis and Forecast
25.1. Introduction
25.1.1. Basis Point Share (BPS) Analysis By Country
25.1.2. Y-o-Y Growth Projections By Country
25.1.3. Key Regulations
25.2. Cornmeal Market Size (Value (US$) and Volume (MT) Analysis (2014-2018) and Forecast (2019-2029)
25.2.1. By Country
25.2.1.1. GCC Countries
25.2.1.2. South Africa
25.2.1.3. North Africa
25.2.1.4. Rest of MEA
25.2.2. By Format
25.2.3. By Nature
25.2.4. By Product Type
25.2.5. By Granulation
25.2.6. By End Use
25.2.7. By Class
25.2.8. By Distribution Channel
25.3. Market Attractiveness Analysis
25.3.1. By Country
25.3.2. By Format
25.3.3. By Nature
25.3.4. By Product Type
25.3.5. By Granulation
25.3.6. By End Use
25.3.7. By Class
25.3.8. By Distribution Channel
25.4. Drivers and Restraints: Impact Analysis
25.5. Heat Map Analysis
25.6. Market Trends
26. Competition Assessment
26.1. Global Cornmeal Market Competition - a Dashboard View
26.2. Global Cornmeal Market Structure Analysis
26.3. Global Cornmeal Market Company Share Analysis
26.4. Key Participants Market Presence (Intensity Mapping) by Region
27. Competition Deep-dive (Manufacturers/Suppliers)
27.1. Archer-Daniels-Midland Co
27.1.1. Overview
27.1.2. Product Portfolio
27.1.3. Sales Footprint
27.1.4. Channel Footprint
27.1.4.1. Distributors List
27.1.4.2. Sales Channel (Clients)
27.1.5. Strategy Overview
27.1.5.1. Marketing Strategy
27.1.5.2. Culture Strategy
27.1.5.3. Channel Strategy
27.1.6. SWOT Analysis
27.1.7. Financial Analysis
27.1.8. Revenue Share
27.1.9. Key Clients
27.1.10. Analyst Comments
27.2. General Mills, Inc.
27.2.1. Overview
27.2.2. Product Portfolio
27.2.3. Sales Footprint
27.2.4. Channel Footprint
27.2.4.1. Distributors List
27.2.4.2. Sales Channel (Clients)
27.2.5. Strategy Overview
27.2.5.1. Marketing Strategy
27.2.5.2. Culture Strategy
27.2.5.3. Channel Strategy
27.2.6. SWOT Analysis
27.2.7. Financial Analysis
27.2.8. Revenue Share
27.2.9. Key Clients
27.2.10. Analyst Comments
27.3. Cargill Incorporated
27.3.1. Overview
27.3.2. Product Portfolio
27.3.3. Sales Footprint
27.3.4. Channel Footprint
27.3.4.1. Distributors List
27.3.4.2. Sales Channel (Clients)
27.3.5. Strategy Overview
27.3.5.1. Marketing Strategy
27.3.5.2. Culture Strategy
27.3.5.3. Channel Strategy
27.3.6. SWOT Analysis
27.3.7. Financial Analysis
27.3.8. Revenue Share
27.3.9. Key Clients
27.3.10. Analyst Comments
27.4. Grain Millers, Inc.
27.4.1. Overview
27.4.2. Product Portfolio
27.4.3. Sales Footprint
27.4.4. Channel Footprint
27.4.4.1. Distributors List
27.4.4.2. Sales Channel (Clients)
27.4.5. Strategy Overview
27.4.5.1. Marketing Strategy
27.4.5.2. Culture Strategy
27.4.5.3. Channel Strategy
27.4.6. SWOT Analysis
27.4.7. Financial Analysis
27.4.8. Revenue Share
27.4.9. Key Clients
27.4.10. Analyst Comments
27.5. Weisenberger Mills Inc.
27.5.1. Overview
27.5.2. Product Portfolio
27.5.3. Sales Footprint
27.5.4. Channel Footprint
27.5.4.1. Distributors List
27.5.4.2. Sales Channel (Clients)
27.5.5. Strategy Overview
27.5.5.1. Marketing Strategy
27.5.5.2. Culture Strategy
27.5.5.3. Channel Strategy
27.5.6. SWOT Analysis
27.5.7. Financial Analysis
27.5.8. Revenue Share
27.5.9. Key Clients
27.5.10. Analyst Comments
27.6. Bunge Ltd.
27.6.1. Overview
27.6.2. Product Portfolio
27.6.3. Sales Footprint
27.6.4. Channel Footprint
27.6.4.1. Distributors List
27.6.4.2. Sales Channel (Clients)
27.6.5. Strategy Overview
27.6.5.1. Marketing Strategy
27.6.5.2. Culture Strategy
27.6.5.3. Channel Strategy
27.6.6. SWOT Analysis
27.6.7. Financial Analysis
27.6.8. Revenue Share
27.6.9. Key Clients
27.6.10. Analyst Comments
27.7. Anson Mills Ltd.
27.7.1. Overview
27.7.2. Product Portfolio
27.7.3. Sales Footprint
27.7.4. Channel Footprint
27.7.4.1. Distributors List
27.7.4.2. Sales Channel (Clients)
27.7.5. Strategy Overview
27.7.5.1. Marketing Strategy
27.7.5.2. Culture Strategy
27.7.5.3. Channel Strategy
27.7.6. SWOT Analysis
27.7.7. Financial Analysis
27.7.8. Revenue Share
27.7.9. Key Clients
27.7.10. Analyst Comments
27.8. Goya Foods, Inc.
27.8.1. Overview
27.8.2. Product Portfolio
27.8.3. Sales Footprint
27.8.4. Channel Footprint
27.8.4.1. Distributors List
27.8.4.2. Sales Channel (Clients)
27.8.5. Strategy Overview
27.8.5.1. Marketing Strategy
27.8.5.2. Culture Strategy
27.8.5.3. Channel Strategy
27.8.6. SWOT Analysis
27.8.7. Financial Analysis
27.8.8. Revenue Share
27.8.9. Key Clients
27.8.10. Analyst Comments
27.9. The Quaker Oats Company
27.9.1. Overview
27.9.2. Product Portfolio
27.9.3. Sales Footprint
27.9.4. Channel Footprint
27.9.4.1. Distributors List
27.9.4.2. Sales Channel (Clients)
27.9.5. Strategy Overview
27.9.5.1. Marketing Strategy
27.9.5.2. Culture Strategy
27.9.5.3. Channel Strategy
27.9.6. SWOT Analysis
27.9.7. Financial Analysis
27.9.8. Revenue Share
27.9.9. Key Clients
27.9.10. Analyst Comments
27.10. Bob’s Red Mill Natural Foods
27.10.1. Overview
27.10.2. Product Portfolio
27.10.3. Sales Footprint
27.10.4. Channel Footprint
27.10.4.1. Distributors List
27.10.4.2. Sales Channel (Clients)
27.10.5. Strategy Overview
27.10.5.1. Marketing Strategy
27.10.5.2. Culture Strategy
27.10.5.3. Channel Strategy
27.10.6. SWOT Analysis
27.10.7. Financial Analysis
27.10.8. Revenue Share
27.10.9. Key Clients
27.10.10. Analyst Comments
27.11. Adluh - Allen Bros. Milling Company
27.11.1. Overview
27.11.2. Product Portfolio
27.11.3. Sales Footprint
27.11.4. Channel Footprint
27.11.4.1. Distributors List
27.11.4.2. Sales Channel (Clients)
27.11.5. Strategy Overview
27.11.5.1. Marketing Strategy
27.11.5.2. Culture Strategy
27.11.5.3. Channel Strategy
27.11.6. SWOT Analysis
27.11.7. Financial Analysis
27.11.8. Revenue Share
27.11.9. Key Clients
27.11.10. Analyst Comments
27.12. Dover Corn Products Ltd.
27.12.1. Overview
27.12.2. Product Portfolio
27.12.3. Sales Footprint
27.12.4. Channel Footprint
27.12.4.1. Distributors List
27.12.4.2. Sales Channel (Clients)
27.12.5. Strategy Overview
27.12.5.1. Marketing Strategy
27.12.5.2. Culture Strategy
27.12.5.3. Channel Strategy
27.12.6. SWOT Analysis
27.12.7. Financial Analysis
27.12.8. Revenue Share
27.12.9. Key Clients
27.12.10. Analyst Comments
27.13. Hometown Food Company
27.13.1. Overview
27.13.2. Product Portfolio
27.13.3. Sales Footprint
27.13.4. Channel Footprint
27.13.4.1. Distributors List
27.13.4.2. Sales Channel (Clients)
27.13.5. Strategy Overview
27.13.5.1. Marketing Strategy
27.13.5.2. Culture Strategy
27.13.5.3. Channel Strategy
27.13.6. SWOT Analysis
27.13.7. Financial Analysis
27.13.8. Revenue Share
27.13.9. Key Clients
27.13.10. Analyst Comments
27.14. Nunn Milling Company
27.14.1. Overview
27.14.2. Product Portfolio
27.14.3. Sales Footprint
27.14.4. Channel Footprint
27.14.4.1. Distributors List
27.14.4.2. Sales Channel (Clients)
27.14.5. Strategy Overview
27.14.5.1. Marketing Strategy
27.14.5.2. Culture Strategy
27.14.5.3. Channel Strategy
27.14.6. SWOT Analysis
27.14.7. Financial Analysis
27.14.8. Revenue Share
27.14.9. Key Clients
27.14.10. Analyst Comments
28. Recommendation- Critical Success Factors
29. Research Methodology
30. Assumptions & Acronyms Used
List of Tables:
Table 01: Global Cornmeal Market Value (US$ Mn) by Region, 2014–2029
Table 02: Global Cornmeal Market Volume (MT) by Region, 2014–2029
Table 03: Global Cornmeal Market Value (US$ Mn) by Format 2014–2029
Table 04: Global Cornmeal Market Volume (MT) by Format 2014–2029
Table 05: Global Cornmeal Market Value (US$ Mn) by Nature 2014–2029
Table 06: Global Cornmeal Market Volume (MT) by Nature 2014–2029
Table 07: Global Cornmeal Market Value (US$ Mn) by Product Type 2014–2018
Table 08: Global Cornmeal Market Volume (MT) by Product Type 2014–2029
Table 09: Global Cornmeal Market Value (US$ Mn) by Granulation 2014–2029
Table 10: Global Cornmeal Market Volume (MT) by Granulation 2014–2029
Table 11: Global Cornmeal Market Value (US$ Mn) by End Use 2014–2029
Table 12: Global Cornmeal Market Volume (MT) by End Use 2014–2029
Table 13: Global Cornmeal Market Value (US$ Mn) by Class 2014–2029
Table 14: Global Cornmeal Market Volume (MT) by Class 2014–2029
Table 15: Global Cornmeal Market Value (US$ Mn) by Distribution Channel 2014–2029
Table 16: Global Cornmeal Market Volume (MT) by Distribution Channel 2014–2029
Table 17: North America Cornmeal Market Value (US$ Mn) by Country 2014–2029
Table 18: North America Cornmeal Market Volume (MT) by Country 2014–2029
Table 19: North America Cornmeal Market Value (US$ Mn) by Format 2014–2029
Table 20: North America Cornmeal Market Volume (MT) by Format 2014–2029
Table 21: North America Cornmeal Market Value (US$ Mn) by Nature 2014–2029
Table 22: North America Cornmeal Market Volume (MT) by Nature 2014–2029
Table 23: North America Cornmeal Market Value (US$ Mn) by Product Type 2014–2018
Table 24: North America Cornmeal Market Volume (MT) by Product Type 2014–2029
Table 25: North America Cornmeal Market Value (US$ Mn) by Granulation 2014–2029
Table 26: North America Cornmeal Market Volume (MT) by Granulation 2014–2029
Table 27: North America Cornmeal Market Value (US$ Mn) by End Use 2014–2029
Table 28: North America Cornmeal Market Volume (MT) by End Use 2014–2029
Table 29: North America Cornmeal Market Value (US$ Mn) by Class 2014–2029
Table 30: North America Cornmeal Market Volume (MT) by Class 2014–2029
Table 31: North America Cornmeal Market Value (US$ Mn) by Distribution Channel 2014–2029
Table 32: North America Cornmeal Market Volume (MT) by Distribution Channel 2014–2029
Table 33: Latin America Cornmeal Market Value (US$ Mn) by Country 2014–2029
Table 34: Latin America Cornmeal Market Volume (MT) by Country 2014–2029
Table 35: Latin America Cornmeal Market Value (US$ Mn) by Format 2014–2029
Table 36: Latin America Cornmeal Market Volume (MT) by Format 2014–2029
Table 37: Latin America Cornmeal Market Value (US$ Mn) by Nature 2014–2029
Table 38: Latin America Cornmeal Market Volume (MT) by Nature 2014–2029
Table 39: Latin America Cornmeal Market Value (US$ Mn) by Product Type 2014–2018
Table 40: Latin America Cornmeal Market Volume (MT) by Product Type 2014–2029
Table 41: Latin America Cornmeal Market Value (US$ Mn) by Granulation 2014–2029
Table 42: Latin America Cornmeal Market Volume (MT) by Granulation 2014–2029
Table 43: Latin America Cornmeal Market Value (US$ Mn) by End Use 2014–2029
Table 44: Latin America Cornmeal Market Volume (MT) by End Use 2014–2029
Table 45: Latin America Cornmeal Market Value (US$ Mn) by Class 2014–2029
Table 46: Latin America Cornmeal Market Volume (MT) by Class 2014–2029
Table 47: Latin America Cornmeal Market Value (US$ Mn) by Distribution Channel 2014–2029
Table 48: Latin America Cornmeal Market Volume (MT) by Distribution Channel 2014–2029
Table 49: Europe Cornmeal Market Value (US$ Mn) by Country 2014–2029
Table 50: Europe Cornmeal Market Volume (MT) by Country 2014–2029
Table 51: Europe Cornmeal Market Value (US$ Mn) by Format 2014–2029
Table 52: Europe Cornmeal Market Volume (MT) by Format 2014–2029
Table 53: Europe Cornmeal Market Value (US$ Mn) by Nature 2014–2029
Table 54: Europe Cornmeal Market Volume (MT) by Nature 2014–2029
Table 55: Europe Cornmeal Market Value (US$ Mn) by Product Type 2014–2018
Table 56: Europe Cornmeal Market Volume (MT) by Product Type 2014–2029
Table 57: Europe Cornmeal Market Value (US$ Mn) by Granulation 2014–2029
Table 58: Europe Cornmeal Market Volume (MT) by Granulation 2014–2029
Table 59: Europe Cornmeal Market Value (US$ Mn) by End Use 2014–2029
Table 60: Europe Cornmeal Market Volume (MT) by End Use 2014–2029
Table 61: Europe Cornmeal Market Value (US$ Mn) by Class 2014–2029
Table 62: Europe Cornmeal Market Volume (MT) by Class 2014–2029
Table 63: Europe Cornmeal Market Value (US$ Mn) by Distribution Channel 2014–2029
Table 64: Europe Cornmeal Market Volume (MT) by Distribution Channel 2014–2029
Table 65: East Asia Cornmeal Market Value (US$ Mn) by Country 2014–2029
Table 66: East Asia Cornmeal Market Volume (MT) by Country 2014–2029
Table 67: East Asia Cornmeal Market Value (US$ Mn) by Format 2014–2029
Table 68: East Asia Cornmeal Market Volume (MT) by Format 2014–2029
Table 69: East Asia Cornmeal Market Value (US$ Mn) by Nature 2014–2029
Table 70: East Asia Cornmeal Market Volume (MT) by Nature 2014–2029
Table 71: East Asia Cornmeal Market Value (US$ Mn) by Product Type 2014–2018
Table 72: East Asia Cornmeal Market Volume (MT) by Product Type 2014–2029
Table 73: East Asia Cornmeal Market Value (US$ Mn) by Granulation 2014–2029
Table 74: East Asia Cornmeal Market Volume (MT) by Granulation 2014–2029
Table 75: East Asia Cornmeal Market Value (US$ Mn) by End Use 2014–2029
Table 76: East Asia Cornmeal Market Volume (MT) by End Use 2014–2029
Table 77: East Asia Cornmeal Market Value (US$ Mn) by Class 2014–2029
Table 78: East Asia Cornmeal Market Volume (MT) by Class 2014–2029
Table 79: East Asia Cornmeal Market Value (US$ Mn) by Distribution Channel 2014–2029
Table 80: East Asia Cornmeal Market Volume (MT) by Distribution Channel 2014–2029
Table 81: South Asia Cornmeal Market Value (US$ Mn) by Country 2014–2029
Table 82: South Asia Cornmeal Market Volume (MT) by Country 2014–2029
Table 83: South Asia Cornmeal Market Value (US$ Mn) by Format 2014–2029
Table 84: South Asia Cornmeal Market Volume (MT) by Format 2014–2029
Table 85: South Asia Cornmeal Market Value (US$ Mn) by Nature 2014–2029
Table 86: South Asia Cornmeal Market Volume (MT) by Nature 2014–2029
Table 87: South Asia Cornmeal Market Value (US$ Mn) by Product Type 2014–2018
Table 88: South Asia Cornmeal Market Volume (MT) by Product Type 2014–2029
Table 89: South Asia Cornmeal Market Value (US$ Mn) by Granulation 2014–2029
Table 90: South Asia Cornmeal Market Volume (MT) by Granulation 2014–2029
Table 91: South Asia Cornmeal Market Value (US$ Mn) by End Use 2014–2029
Table 92: South Asia Cornmeal Market Volume (MT) by End Use 2014–2029
Table 93: South Asia Cornmeal Market Value (US$ Mn) by Class 2014–2029
Table 94: South Asia Cornmeal Market Volume (MT) by Class 2014–2029
Table 95: South Asia Cornmeal Market Value (US$ Mn) by Distribution Channel 2014–2029
Table 96: South Asia Cornmeal Market Volume (MT) by Distribution Channel 2014–2029
Table 97: Oceania Cornmeal Market Value (US$ Mn) by Country 2014–2029
Table 98: Oceania Cornmeal Market Volume (MT) by Country 2014–2029
Table 99: Oceania Cornmeal Market Value (US$ Mn) by Format 2014–2029
Table 100: Oceania Cornmeal Market Volume (MT) by Format 2014–2029
Table 101: Oceania Cornmeal Market Value (US$ Mn) by Nature 2014–2029
Table 102: Oceania Cornmeal Market Volume (MT) by Nature 2014–2029
Table 103: Oceania Cornmeal Market Value (US$ Mn) by Product Type 2014–2018
Table 104: Oceania Cornmeal Market Volume (MT) by Product Type 2014–2029
Table 105: Oceania Cornmeal Market Value (US$ Mn) by Granulation 2014–2029
Table 106: Oceania Cornmeal Market Volume (MT) by Granulation 2014–2029
Table 107: Oceania Cornmeal Market Value (US$ Mn) by End Use 2014–2029
Table 108: Oceania Cornmeal Market Volume (MT) by End Use 2014–2029
Table 109: Oceania Cornmeal Market Value (US$ Mn) by Class 2014–2029
Table 110: Oceania Cornmeal Market Volume (MT) by Class 2014–2029
Table 111: Oceania Cornmeal Market Value (US$ Mn) by Distribution Channel 2014–2029
Table 112: Oceania Cornmeal Market Volume (MT) by Distribution Channel 2014–2029
Table 113: MEA Cornmeal Market Value (US$ Mn) by Country 2014–2029
Table 114: MEA Cornmeal Market Volume (MT) by Country 2014–2029
Table 115: MEA Cornmeal Market Value (US$ Mn) by Format 2014–2029
Table 116: MEA Cornmeal Market Volume (MT) by Format 2014–2029
Table 117: MEA Cornmeal Market Value (US$ Mn) by Nature 2014–2029
Table 118: MEA Cornmeal Market Volume (MT) by Nature 2014–2029
Table 119: MEA Cornmeal Market Value (US$ Mn) by Product Type 2014–2018
Table 120: MEA Cornmeal Market Volume (MT) by Product Type 2014–2029
Table 121: MEA Cornmeal Market Value (US$ Mn) by Granulation 2014–2029
Table 122: MEA Cornmeal Market Volume (MT) by Granulation 2014–2029
Table 123: MEA Cornmeal Market Value (US$ Mn) by End Use 2014–2029
Table 124: MEA Cornmeal Market Volume (MT) by End Use 2014–2029
Table 125: MEA Cornmeal Market Value (US$ Mn) by Class 2014–2029
Table 126: MEA Cornmeal Market Volume (MT) by Class 2014–2029
Table 127: MEA Cornmeal Market Value (US$ Mn) by Distribution Channel 2014–2029
Table 128: MEA Cornmeal Market Volume (MT) by Distribution Channel 2014–2029
List of Figures:
Figure 01: Global Cornmeal Historic Market Value (US$ Mn) Forecast, 2014–2029
Figure 02: Global Cornmeal Market Absolute Incremental Opportunity Forecast, 2019–2029
Figure 03: Global Cornmeal Market Volume (MT) Analysis by Format, 2019 & 2029
Figure 04: Global Cornmeal Market Value Share (%) and BPS Analysis by Format, 2014, 2019 & 2029
Figure 05: Global Cornmeal Market Attractiveness, by Format, 2019 to 2029
Figure 06: Global Cornmeal Market Volume (MT) Analysis by Nature, 2019 & 2029
Figure 07: Global Cornmeal Market Value Share (%) and BPS Analysis by Nature, 2014, 2019 & 2029
Figure 08: Global Cornmeal Market Attractiveness, by Nature, 2019 to 2029
Figure 09: Global Cornmeal Market Volume (MT) Analysis by Product Type, 2019 & 2029
Figure 10: Global Cornmeal Market Value Share (%) and BPS Analysis by Product Type, 2014, 2019 & 2029
Figure 11: Global Cornmeal Market Attractiveness, by Product Type, 2019 to 2029
Figure 12: Global Cornmeal Market Volume (MT) Analysis by Granulation, 2019 & 2029
Figure 13: Global Cornmeal Market Value Share (%) and BPS Analysis by Granulation, 2014, 2019 & 2029
Figure 14: Global Cornmeal Market Attractiveness, by Granulation, 2019 to 2029
Figure 15: Global Cornmeal Market Volume (MT) Analysis by End Use, 2019 & 2029
Figure 16: Global Cornmeal Market Value Share (%) and BPS Analysis by End Use, 2014, 2019 & 2029
Figure 17: Global Cornmeal Market Attractiveness, by End Use, 2019 to 2029
Figure 18: Global Cornmeal Market Volume (MT) Analysis by Class, 2019 & 2029
Figure 19: Global Cornmeal Market Value Share (%) and BPS Analysis by Class, 2014, 2019 & 2029
Figure 20: Global Cornmeal Market Attractiveness, by Class, 2019 to 2029
Figure 21: Global Cornmeal Market Volume (MT) Analysis by Distribution Channel, 2019 & 2029
Figure 22: Global Cornmeal Market Value Share (%) and BPS Analysis by Distribution Channel, 2014, 2019 & 2029
Figure 23: Global Cornmeal Market Attractiveness, by Distribution Channel, 2019 to 2029
Figure 24: Global Cornmeal Market Value Share (%) and BPS Analysis by Region, 2014, 2019 & 2029
Figure 25: Global Cornmeal Market Y-o-Y Growth (%) Projections by Region, 2019-2029
Figure 26: North America Cornmeal Market Absolute $ Opportunity Analysis, 2019-2029
Figure 27: Latin America Cornmeal Market Absolute $ Opportunity Analysis, 2019-2029
Figure 28: Europe Cornmeal Market Absolute $ Opportunity Analysis, 2019-2029
Figure 29: East Asia Cornmeal Market Absolute $ Opportunity Analysis, 2019-2029
Figure 30: South Asia Cornmeal Market Absolute $ Opportunity Analysis, 2019-2029
Figure 31: Oceania Cornmeal Market Absolute $ Opportunity Analysis, 2019-2029
Figure 32: MEA Cornmeal Market Absolute $ Opportunity Analysis, 2019-2029
Figure 33: Global Cornmeal Market Attractiveness Analysis, 2019-2029
Figure 34: North America Cornmeal Market Value BPS Analysis, by Country, 2014, 2019 & 2029
Figure 35: U.S. Cornmeal Market Value and Volume Analysis, 2014 -2029
Figure 36: Canada Cornmeal Market Value and Volume Analysis, 2014 -2029
Figure 37: U.S. Cornmeal Market Incremental $ Opportunity, 2019-2029
Figure 38: Canada Cornmeal Market Incremental $ Opportunity, 2019-2029
Figure 39: North America Cornmeal Market Volume (MT) Analysis by Format, 2019 & 2029
Figure 40: North America Cornmeal Market Value Share (%) and BPS Analysis by Format, 2014, 2019 & 2029
Figure 41: North America Cornmeal Market Attractiveness, by Format, 2019 to 2029
Figure 42: North America Cornmeal Market Volume (MT) Analysis by Nature, 2019 & 2029
Figure 43: North America Cornmeal Market Value Share (%) and BPS Analysis by Nature, 2014, 2019 & 2029
Figure 44: North America Cornmeal Market Attractiveness, by Nature, 2019 to 2029
Figure 45: North America Cornmeal Market Volume (MT) Analysis by Product Type, 2019 & 2029
Figure 46: North America Cornmeal Market Value Share (%) and BPS Analysis by Product Type, 2014, 2019 & 2029
Figure 47: North America Cornmeal Market Attractiveness, by Product Type, 2019 to 2029
Figure 48: North America Cornmeal Market Volume (MT) Analysis by Granulation, 2019 & 2029
Figure 49: North America Cornmeal Market Value Share (%) and BPS Analysis by Granulation, 2014, 2019 & 2029
Figure 50: North America Cornmeal Market Attractiveness, by Granulation, 2019 to 2029
Figure 51: North America Cornmeal Market Volume (MT) Analysis by End Use, 2019 & 2029
Figure 52: North America Cornmeal Market Value Share (%) and BPS Analysis by End Use, 2014, 2019 & 2029
Figure 53: North America Cornmeal Market Attractiveness, by End Use, 2019 to 2029
Figure 54: North America Cornmeal Market Volume (MT) Analysis by Class, 2019 & 2029
Figure 55: North America Cornmeal Market Value Share (%) and BPS Analysis by Class, 2014, 2019 & 2029
Figure 56: North America Cornmeal Market Attractiveness, by Class, 2019 to 2029
Figure 57: North America Cornmeal Market Volume (MT) Analysis by Distribution Channel, 2019 & 2029
Figure 58: North America Cornmeal Market Value Share (%) and BPS Analysis by Distribution Channel, 2014, 2019 & 2029
Figure 59: North America Cornmeal Market Attractiveness, by Distribution Channel, 2019 to 2029
Figure 60: Latin America Cornmeal Market Value BPS Analysis, by Country, 2014, 2019 & 2029
Figure 61: Mexico Cornmeal Market Value and Volume Analysis, 2014 -2029
Figure 62: Brazil Cornmeal Market Value and Volume Analysis, 2014 -2029
Figure 63: Peru Cornmeal Market Value and Volume Analysis, 2014 -2029
Figure 64: Chile Cornmeal Market Value and Volume Analysis, 2014 -2029
Figure 65: Argentina Cornmeal Market Value and Volume Analysis, 2014 -2029
Figure 66: Rest of Latin America Cornmeal Market Value and Volume Analysis, 2014 -2029
Figure 67: Mexico Cornmeal Market Incremental $ Opportunity, 2019-2029
Figure 68: Brazil Cornmeal Market Incremental $ Opportunity, 2019-2029
Figure 69: Peru Cornmeal Market Incremental $ Opportunity, 2019-2029
Figure 70: Chile Cornmeal Market Incremental $ Opportunity, 2019-2029
Figure 71: Argentina Cornmeal Market Incremental $ Opportunity, 2019-2029
Figure 72: Rest of Latin America Cornmeal Market Incremental $ Opportunity, 2019-2029
Figure 73: Latin America Cornmeal Market Volume (MT) Analysis by Format, 2019 & 2029
Figure 74: Latin America Cornmeal Market Value Share (%) and BPS Analysis by Format, 2014, 2019 & 2029
Figure 75: Latin America Cornmeal Market Attractiveness, by Format, 2019 to 2029
Figure 76: Latin America Cornmeal Market Volume (MT) Analysis by Nature, 2019 & 2029
Figure 77: Latin America Cornmeal Market Value Share (%) and BPS Analysis by Nature, 2014, 2019 & 2029
Figure 78: Latin America Cornmeal Market Attractiveness, by Nature, 2019 to 2029
Figure 79: Latin America Cornmeal Market Volume (MT) Analysis by Product Type, 2019 & 2029
Figure 80: Latin America Cornmeal Market Value Share (%) and BPS Analysis by Product Type, 2014, 2019 & 2029
Figure 81: Latin America Cornmeal Market Attractiveness, by Product Type, 2019 to 2029
Figure 82: Latin America Cornmeal Market Volume (MT) Analysis by Granulation, 2019 & 2029
Figure 83: Latin America Cornmeal Market Value Share (%) and BPS Analysis by Granulation, 2014, 2019 & 2029
Figure 84: Latin America Cornmeal Market Attractiveness, by Granulation, 2019 to 2029
Figure 85: Latin America Cornmeal Market Volume (MT) Analysis by End Use, 2019 & 2029
Figure 86: Latin America Cornmeal Market Value Share (%) and BPS Analysis by End Use, 2014, 2019 & 2029
Figure 87: Latin America Cornmeal Market Attractiveness, by End Use, 2019 to 2029
Figure 88: Latin America Cornmeal Market Volume (MT) Analysis by Class, 2019 & 2029
Figure 89: Latin America Cornmeal Market Value Share (%) and BPS Analysis by Class, 2014, 2019 & 2029
Figure 90: Latin America Cornmeal Market Attractiveness, by Class, 2019 to 2029
Figure 91: Latin America Cornmeal Market Volume (MT) Analysis by Distribution Channel, 2019 & 2029
Figure 92: Latin America Cornmeal Market Value Share (%) and BPS Analysis by Distribution Channel, 2014, 2019 & 2029
Figure 93: Latin America Cornmeal Market Attractiveness, by Distribution Channel, 2019 to 2029
Figure 94: Europe Cornmeal Market Value BPS Analysis, by Country, 2014, 2019 & 2029
Figure 95: EU-4 Cornmeal Market Value and Volume Analysis, 2014 -2029
Figure 96: U.K. Cornmeal Market Value and Volume Analysis, 2014 -2029
Figure 97: Benelux Cornmeal Market Value and Volume Analysis, 2014 -2029
Figure 98: Nordic Cornmeal Market Value and Volume Analysis, 2014 -2029
Figure 99: Poland Cornmeal Market Value and Volume Analysis, 2014 -2029
Figure 100: Europe Cornmeal Market Attractiveness Analysis By Country, 2019-2029
Figure 101: Russia Cornmeal Market Value and Volume Analysis, 2014 -2029
Figure 102: Rest of Europe Cornmeal Market Value and Volume Analysis, 2014 -2029
Figure 103: Europe Cornmeal Market Y-o-Y Growth (%) Projections by Country, 2019-2029
Figure 104: EU-4 Cornmeal Cornmeal Incremental $ Opportunity, 2019-2029
Figure 105: U.K. Cornmeal Market Incremental $ Opportunity, 2019-2029
Figure 106: Benelux Cornmeal Market Incremental $ Opportunity, 2019-2029
Figure 107: Nordic Cornmeal Market Incremental $ Opportunity, 2019-2029
Figure 108: Poland Cornmeal Market Incremental $ Opportunity, 2019-2029
Figure 109: Russia Cornmeal Market Incremental $ Opportunity, 2019-2029
Figure 110: Rest of Europe Cornmeal Market Incremental $ Opportunity, 2019-2029
Figure 111: Europe Cornmeal Market Volume (MT) Analysis by Format, 2019 & 2029
Figure 112: Europe Cornmeal Market Value Share (%) and BPS Analysis by Format, 2014, 2019 & 2029
Figure 113: Europe Cornmeal Market Attractiveness, by Format, 2019 to 2029
Figure 114: Europe Cornmeal Market Volume (MT) Analysis by Nature, 2019 & 2029
Figure 115: Europe Cornmeal Market Value Share (%) and BPS Analysis by Nature, 2014, 2019 & 2029
Figure 116: Europe Cornmeal Market Attractiveness, by Nature, 2019 to 2029
Figure 117: Europe Cornmeal Market Volume (MT) Analysis by Product Type, 2019 & 2029
Figure 118: Europe Cornmeal Market Value Share (%) and BPS Analysis by Product Type, 2014, 2019 & 2029
Figure 119: Europe Cornmeal Market Attractiveness, by Product Type, 2019 to 2029
Figure 120: Europe Cornmeal Market Volume (MT) Analysis by Granulation, 2019 & 2029
Figure 121: Europe Cornmeal Market Value Share (%) and BPS Analysis by Granulation, 2014, 2019 & 2029
Figure 122: Europe Cornmeal Market Attractiveness, by Granulation, 2019 to 2029
Figure 123: Europe Cornmeal Market Volume (MT) Analysis by End Use, 2019 & 2029
Figure 124: Europe Cornmeal Market Value Share (%) and BPS Analysis by End Use, 2014, 2019 & 2029
Figure 125: Europe Cornmeal Market Attractiveness, by End Use, 2019 to 2029
Figure 126: Europe Cornmeal Market Volume (MT) Analysis by Class, 2019 & 2029
Figure 127: Europe Cornmeal Market Value Share (%) and BPS Analysis by Class, 2014, 2019 & 2029
Figure 128: Europe Cornmeal Market Attractiveness, by Class, 2019 to 2029
Figure 129: Europe Cornmeal Market Volume (MT) Analysis by Distribution Channel, 2019 & 2029
Figure 130: Europe Cornmeal Market Value Share (%) and BPS Analysis by Distribution Channel, 2014, 2019 & 2029
Figure 131: Europe Cornmeal Market Attractiveness, by Distribution Channel, 2019 to 2029
Figure 132: East Asia Cornmeal Market Value BPS Analysis, by Country, 2014, 2019 & 2029
Figure 133: China Cornmeal Market Value and Volume Analysis, 2014 -2029
Figure 134: Japan Cornmeal Market Value and Volume Analysis, 2014 -2029
Figure 135: South Korea Cornmeal Market Value and Volume Analysis, 2014 -2029
Figure 136: East Asia Cornmeal Market Attractiveness Analysis By Country, 2019-2029
Figure 137: China Cornmeal Market Incremental $ Opportunity, 2019-2029
Figure 138: Japan Cornmeal Market Incremental $ Opportunity, 2019-2029
Figure 139: South Korea Cornmeal Market Incremental $ Opportunity, 2019-2029
Figure 140: East Asia Cornmeal Market Volume (MT) Analysis by Format, 2019 & 2029
Figure 141: East Asia Cornmeal Market Value Share (%) and BPS Analysis by Format, 2014, 2019 & 2029
Figure 142: East Asia Cornmeal Market Attractiveness, by Format, 2019 to 2029
Figure 143: East Asia Cornmeal Market Volume (MT) Analysis by Nature, 2019 & 2029
Figure 144: East Asia Cornmeal Market Value Share (%) and BPS Analysis by Nature, 2014, 2019 & 2029
Figure 145: East Asia Cornmeal Market Attractiveness, by Nature, 2019 to 2029
Figure 146: East Asia Cornmeal Market Volume (MT) Analysis by Product Type, 2019 & 2029
Figure 147: East Asia Cornmeal Market Value Share (%) and BPS Analysis by Product Type, 2014, 2019 & 2029
Figure 148: East Asia Cornmeal Market Attractiveness, by Product Type, 2019 to 2029
Figure 149: East Asia Cornmeal Market Volume (MT) Analysis by Granulation, 2019 & 2029
Figure 150: East Asia Cornmeal Market Value Share (%) and BPS Analysis by Granulation, 2014, 2019 & 2029
Figure 151: East Asia Cornmeal Market Attractiveness, by Granulation, 2019 to 2029
Figure 152: East Asia Cornmeal Market Volume (MT) Analysis by End Use, 2019 & 2029
Figure 153: East Asia Cornmeal Market Value Share (%) and BPS Analysis by End Use, 2014, 2019 & 2029
Figure 154: East Asia Cornmeal Market Attractiveness, by End Use, 2019 to 2029
Figure 155: East Asia Cornmeal Market Volume (MT) Analysis by Class, 2019 & 2029
Figure 156: East Asia Cornmeal Market Value Share (%) and BPS Analysis by Class, 2014, 2019 & 2029
Figure 157: East Asia Cornmeal Market Attractiveness, by Class, 2019 to 2029
Figure 158: East Asia Cornmeal Market Volume (MT) Analysis by Distribution Channel, 2019 & 2029
Figure 159: East Asia Cornmeal Market Value Share (%) and BPS Analysis by Distribution Channel, 2014, 2019 & 2029
Figure 160: East Asia Cornmeal Market Attractiveness, by Distribution Channel, 2019 to 2029
Figure 161: South Asia Cornmeal Market Value BPS Analysis, by Country, 2014, 2019 & 2029
Figure 162: India Cornmeal Market Value and Volume Analysis, 2014 -2029
Figure 163: Pakistan Cornmeal Market Value and Volume Analysis, 2014 -2029
Figure 164: Indonesia Cornmeal Market Value and Volume Analysis, 2014 -2029
Figure 165: Thailand Cornmeal Market Value and Volume Analysis, 2014 -2029
Figure 166: Singapore Cornmeal Market Value and Volume Analysis, 2014 -2029
Figure 167: Rest of South Asia Cornmeal Market Value and Volume Analysis, 2014 -2029
Figure 168: India Cornmeal Market Incremental $ Opportunity, 2019-2029
Figure 169: Pakistan Cornmeal Market Incremental $ Opportunity, 2019-2029
Figure 170: Indonesia Cornmeal Market Incremental $ Opportunity, 2019-2029
Figure 171: Thailand Cornmeal Market Incremental $ Opportunity, 2019-2029
Figure 172: Singapore Cornmeal Market Incremental $ Opportunity, 2019-2029
Figure 173: Rest of South Asia Cornmeal Market Incremental $ Opportunity, 2019-2029
Figure 174: South Asia Cornmeal Market Volume (MT) Analysis by Format, 2019 & 2029
Figure 175: South Asia Cornmeal Market Value Share (%) and BPS Analysis by Format, 2014, 2019 & 2029
Figure 176: South Asia Cornmeal Market Attractiveness, by Format, 2019 to 2029
Figure 177: South Asia Cornmeal Market Volume (MT) Analysis by Nature, 2019 & 2029
Figure 178: South Asia Cornmeal Market Value Share (%) and BPS Analysis by Nature, 2014, 2019 & 2029
Figure 179: South Asia Cornmeal Market Attractiveness, by Nature, 2019 to 2029
Figure 180: South Asia Cornmeal Market Volume (MT) Analysis by Product Type, 2019 & 2029
Figure 181: South Asia Cornmeal Market Value Share (%) and BPS Analysis by Product Type, 2014, 2019 & 2029
Figure 182: South Asia Cornmeal Market Attractiveness, by Product Type, 2019 to 2029
Figure 183: South Asia Cornmeal Market Volume (MT) Analysis by Granulation, 2019 & 2029
Figure 184: South Asia Cornmeal Market Value Share (%) and BPS Analysis by Granulation, 2014, 2019 & 2029
Figure 185: South Asia Cornmeal Market Attractiveness, by Granulation, 2019 to 2029
Figure 186: South Asia Cornmeal Market Volume (MT) Analysis by End Use, 2019 & 2029
Figure 187: South Asia Cornmeal Market Value Share (%) and BPS Analysis by End Use, 2014, 2019 & 2029
Figure 188: South Asia Cornmeal Market Attractiveness, by End Use, 2019 to 2029
Figure 189: South Asia Cornmeal Market Volume (MT) Analysis by Class, 2019 & 2029
Figure 190: South Asia Cornmeal Market Value Share (%) and BPS Analysis by Class, 2014, 2019 & 2029
Figure 191: South Asia Cornmeal Market Attractiveness, by Class, 2019 to 2029
Figure 192: South Asia Cornmeal Market Volume (MT) Analysis by Distribution Channel, 2019 & 2029
Figure 193: South Asia Cornmeal Market Value Share (%) and BPS Analysis by Distribution Channel, 2014, 2019 & 2029
Figure 194: South Asia Cornmeal Market Attractiveness, by Distribution Channel, 2019 to 2029
Figure 195: Oceania Cornmeal Market Value BPS Analysis, by Country, 2014, 2019 & 2029
Figure 196: Australia Cornmeal Market Value and Volume Analysis, 2014 -2029
Figure 197: New Zealand Cornmeal Market Value and Volume Analysis, 2014 -2029
Figure 198: Australia Cornmeal Market Incremental $ Opportunity, 2019-2029
Figure 199: New Zealand Cornmeal Market Incremental $ Opportunity, 2019-2029
Figure 200: Oceania Cornmeal Market Volume (MT) Analysis by Format, 2019 & 2029
Figure 201: Oceania Cornmeal Market Value Share (%) and BPS Analysis by Format, 2014, 2019 & 2029
Figure 202: Oceania Cornmeal Market Attractiveness, by Format, 2019 to 2029
Figure 203: Oceania Cornmeal Market Volume (MT) Analysis by Nature, 2019 & 2029
Figure 204: Oceania Cornmeal Market Value Share (%) and BPS Analysis by Nature, 2014, 2019 & 2029
Figure 205: Oceania Cornmeal Market Attractiveness, by Nature, 2019 to 2029
Figure 206: Oceania Cornmeal Market Volume (MT) Analysis by Product Type, 2019 & 2029
Figure 207: Oceania Cornmeal Market Value Share (%) and BPS Analysis by Product Type, 2014, 2019 & 2029
Figure 208: Oceania Cornmeal Market Attractiveness, by Product Type, 2019 to 2029
Figure 209: Oceania Cornmeal Market Volume (MT) Analysis by Granulation, 2019 & 2029
Figure 210: Oceania Cornmeal Market Value Share (%) and BPS Analysis by Granulation, 2014, 2019 & 2029
Figure 211: Oceania Cornmeal Market Attractiveness, by Granulation, 2019 to 2029
Figure 212: Oceania Cornmeal Market Volume (MT) Analysis by End Use, 2019 & 2029
Figure 213: Oceania Cornmeal Market Value Share (%) and BPS Analysis by End Use, 2014, 2019 & 2029
Figure 214: Oceania Cornmeal Market Attractiveness, by End Use, 2019 to 2029
Figure 215: Oceania Cornmeal Market Volume (MT) Analysis by Class, 2019 & 2029
Figure 216: Oceania Cornmeal Market Value Share (%) and BPS Analysis by Class, 2014, 2019 & 2029
Figure 217: Oceania Cornmeal Market Attractiveness, by Class, 2019 to 2029
Figure 218: Oceania Cornmeal Market Volume (MT) Analysis by Distribution Channel, 2019 & 2029
Figure 219: Oceania Cornmeal Market Value Share (%) and BPS Analysis by Distribution Channel, 2014, 2019 & 2029
Figure 220: Oceania Cornmeal Market Attractiveness, by Distribution Channel, 2019 to 2029
Figure 221: MEA Cornmeal Market Value BPS Analysis, by Country, 2014, 2019 & 2029
Figure 222: GCC Countries Cornmeal Market Value and Volume Analysis, 2014 -2029
Figure 223: South Africa Cornmeal Market Value and Volume Analysis, 2014 -2029
Figure 224: North Africa Cornmeal Market Value and Volume Analysis, 2014 -2029
Figure 225: Rest of MEA Cornmeal Market Value and Volume Analysis, 2014 -2029
Figure 226: MEA Cornmeal Market Attractiveness Analysis By Country, 2019-2029
Figure 227: GCC Countries Cornmeal Market Incremental $ Opportunity, 2019-2029
Figure 228: South Africa Cornmeal Market Incremental $ Opportunity, 2019-2029
Figure 229: North Africa Cornmeal Market Incremental $ Opportunity, 2019-2029
Figure 230: Rest of MEA Cornmeal Market Incremental $ Opportunity, 2019-2029
Figure 231: MEA Cornmeal Market Volume (MT) Analysis by Format, 2019 & 2029
Figure 232: MEA Cornmeal Market Value Share (%) and BPS Analysis by Format, 2014, 2019 & 2029
Figure 233: MEA Cornmeal Market Attractiveness, by Format, 2019 to 2029
Figure 234: MEA Cornmeal Market Volume (MT) Analysis by Nature, 2019 & 2029
Figure 235: MEA Cornmeal Market Value Share (%) and BPS Analysis by Nature, 2014, 2019 & 2029
Figure 236: MEA Cornmeal Market Attractiveness, by Nature, 2019 to 2029
Figure 237: MEA Cornmeal Market Volume (MT) Analysis by Product Type, 2019 & 2029
Figure 238: MEA Cornmeal Market Value Share (%) and BPS Analysis by Product Type, 2014, 2019 & 2029
Figure 239: MEA Cornmeal Market Attractiveness, by Product Type, 2019 to 2029
Figure 240: MEA Cornmeal Market Volume (MT) Analysis by Granulation, 2019 & 2029
Figure 241: MEA Cornmeal Market Value Share (%) and BPS Analysis by Granulation, 2014, 2019 & 2029
Figure 242: MEA Cornmeal Market Attractiveness, by Granulation, 2019 to 2029
Figure 243: MEA Cornmeal Market Volume (MT) Analysis by End Use, 2019 & 2029
Figure 244: MEA Cornmeal Market Value Share (%) and BPS Analysis by End Use, 2014, 2019 & 2029
Figure 245: MEA Cornmeal Market Attractiveness, by End Use, 2019 to 2029
Figure 246: MEA Cornmeal Market Volume (MT) Analysis by Class, 2019 & 2029
Figure 247: MEA Cornmeal Market Value Share (%) and BPS Analysis by Class, 2014, 2019 & 2029
Figure 248: MEA Cornmeal Market Attractiveness, by Class, 2019 to 2029
Figure 249: MEA Cornmeal Market Volume (MT) Analysis by Distribution Channel, 2019 & 2029
Figure 250: MEA Cornmeal Market Value Share (%) and BPS Analysis by Distribution Channel, 2014, 2019 & 2029
Figure 251: MEA Cornmeal Market Attractiveness, by Distribution Channel, 2019 to 2029
Copyright © Transparency Market Research, Inc. All Rights reserved
Trust Online

Cornmeal Market