
Reports
Reports
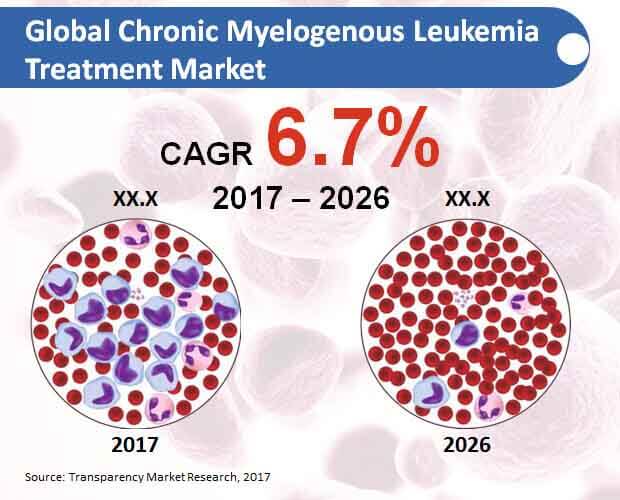
Global Chronic Myelogenous Leukemia Treatment Market: Snapshot
Factors such as increasing number of research and developments in oncology sector, advancements in drug development, new product launch, and the introduction of various new therapies are leading towards the growth of the global market for chronic myelogenous leukemia.
Increasing prevalence of chronic myelogenous leukemia in developed countries due to genetic factors is also resulting in the development of new treatment and therapies that are more effective. Researchers are also focusing on polypharmacology approach to develop the drugs that can act on multiple targets. This is leading to the drug discovery opportunities that are beyond the concept of ‘one drug, one target’. The class of drugs known as TKIs is being used on a large scale, however, side-effects of these drugs are affecting its growth. Hence, new drugs and treatments are being developed to run the treatment successfully without any risk. Moreover, the rise in the development of a combination of drug therapies is also fueling the growth of the market.
High-cost of treatment being the biggest factor hampering market growth. Manufacturers are focusing on reducing the cost of TKIs. Meanwhile, the government of various countries are also taking initiatives to provide TKIs to the large section of population who are not able to afford it.
According to the report by Transparency Market Research (TMR), the global market for chronic myelogenous leukemia is likely to witness strong growth, registering 6.7% CAGR during 2017-2026. The market is also estimated to bring in US$ 8,550.8 million revenue by 2026 end.
Disease Specific Treatment to Gain Maximum Revenue Share
Disease specific treatment is likely to gain maximum revenue share, accounting for more than three-fourth of the revenue share by 2017 end. Disease specific treatment is also projected to exceed US$ 7,100 million revenue towards 2026 end.
Hospital Pharmacies to Emerge as the Largest Distribution Channel
Compared to the other distribution channel, hospital pharmacies are likely to witness significant growth during 2017-2026. By 2026 end, hospital pharmacies are estimated to surpass US$ 4,600 million revenue. Meanwhile, specialty pharmacies are also likely to witness healthy growth between 2017 and 2026.
Branded Drugs to Gain Maximum Traction in the Global Market for Chronic Myelogenous Leukemia Treatment
Branded drugs are likely to gain maximum traction in the market during 2017-2026. Branded drugs are estimated to exceed US$ 6,800 million revenue by 2026 end.
North America to Dominate the Global Market for Chronic Myelogenous Leukemia Treatment
North America is likely to emerge as one of the largest regions in the global market for chronic myelogenous leukemia treatment. Increasing awareness about various new treatments among the patients suffering from chronic myelogenous leukemia, early diagnosis of patients suffering from cancer are some of the factors driving the market growth in North America. Other factors contributing to the market growth are presence of leading market players and rise in a number of approval of drugs by the U.S. Food and Drug Administration (FDA) for treating chronic myelogenous leukemia.
Meanwhile, improving healthcare infrastructure in developing countries like China and India are contributing towards the growth of chronic myelogenous leukemia treatment in the APEJ region.
Competition Tracking
Some of the major market players in the global market for chronic myelogenous leukemia treatment are Novartis, Teva Pharmaceutical, Bristol Myers Squibb, Hoffman-LaRoche and Schering Plough, Pfizer, and Others. The use of second and third generation therapies has recently increased due to the lack of benefits from imatinib. Hence, players in the market are working on introducing treatments and drugs that can offer maximum benefits.
Rising Success Rates of Infection Treatment will Augment Chronic Myelogenous Leukemia Treatment Market Growth
Expanding pervasiveness of persistent myelogenous leukemia in created nations because of hereditary elements is additionally bringing about the advancement of new treatment and treatments that are more powerful. Specialists are additionally zeroing in on polypharmacology way to deal with build up the medications that can follow up on various targets. This is prompting the medication revelation openings that are past the idea of 'one medication, one objective'. The class of medications known as TKIs is being utilized for a huge scope, be that as it may, symptoms of these medications are influencing its development. Subsequently, new medications and medicines are being created to run the treatment effectively with no danger. In addition, the ascent in the improvement of a mix of medication treatments is likewise filling the development of the market.
Factors like expanding number of exploration and improvements in oncology area, progressions in drug advancement, new item dispatch, and the presentation of different new treatments are driving towards the development of the worldwide market for chronic myelogenous leukemia. Unexpectedly, significant expense of treatment being the greatest factor hampering market development. Makers are zeroing in on lessening the expense of TKIs. Then, the public authority of different nations is likewise taking drives to give TKIs to the huge segment of populace who can't manage the cost of it.
The worldwide market for chronic myelogenous leukemia treatment has been growing at a heavenly speed over the previous decade. The initiation of recent fads in the medical services crew is liable for the development of the chronic myelogenous leukemia treatment market. Besides, infection treatment is a sub-area inside medical care that has gathered the consideration of territorial and worldwide financial backers. This factor has acquired voluminous incomes into the worldwide chronic myelogenous leukemia treatment market as of late. Progressions in the field of oncology have likewise smelled of development inside the worldwide chronic myelogenous leukemia treatment market as of late.
Chapter 1 Global Outlook
Chapter 2 Global Chronic Myelogenous Leukemia Treatment Market - Executive Summary
Chapter 3 Global Chronic Myelogenous Leukemia Treatment Market Overview
3.1 Introduction
3.1.1 Global Chronic Myelogenous Leukemia Treatment Market Taxonomy
3.1.2 Global Chronic Myelogenous Leukemia Treatment Market Definition
3.2 Global Chronic Myelogenous Leukemia Treatment Market Size (US$ Mn) and Forecast, 2012-2026
3.2.1 Global Chronic Myelogenous Leukemia Treatment Market Y-o-Y Growth
3.3 Global Chronic Myelogenous Leukemia Treatment Market Dynamics
3.4 Supply Chain
3.5 Cost Structure
3.6 Pricing Analysis
3.6.1 Pricing for Tablets
3.6.2 Pricing for Injectable
3.7 Patent Analysis
3.8 Drug Regulations
3.9 List of Distributors
3.10 PESTL Analysis
3.11 Product Lifecycle
3.12 Key Participants Market Presence (Intensity Map) By Region
Chapter 4 Global Chronic Myelogenous Leukemia Treatment Market Analysis and Forecast 2012-2026
4.1 Global Chronic Myelogenous Leukemia Treatment Market Size and Forecast by Treatment Type, 2012-2026
4.1.1 Disease Specific Treatment Market Size and Forecast, 2012-2026
4.1.1.1 Revenue (US$ Mn) Comparison, By Region
4.1.1.2 Market Share Comparison, By Region
4.1.1.3 Y-o-Y growth Comparison, By Region
4.1.2 Symptomatic Treatment Market Size and Forecast, 2012-2026
4.1.2.1 Revenue (US$ Mn) Comparison, By Region
4.1.2.2 Market Share Comparison, By Region
4.1.2.3 Y-o-Y growth Comparison, By Region
4.2 Global Chronic Myelogenous Leukemia Treatment Market Size and Forecast by Distribution Channel, 2012-2026
4.2.1 Hospital Pharmacies Market Size and Forecast, 2012-2026
4.2.1.1 Revenue (US$ Mn) Comparison, By Region
4.2.1.2 Market Share Comparison, By Region
4.2.1.3 Y-o-Y growth Comparison, By Region
4.2.2 Specialty Pharmacies Market Size and Forecast, 2012-2026
4.2.2.1 Revenue (US$ Mn) Comparison, By Region
4.2.2.2 Market Share Comparison, By Region
4.2.2.3 Y-o-Y growth Comparison, By Region
4.2.3 Retail Pharmacies Market Size and Forecast, 2012-2026
4.2.3.1 Revenue (US$ Mn) Comparison, By Region
4.2.3.2 Market Share Comparison, By Region
4.2.3.3 Y-o-Y growth Comparison, By Region
4.3 Global Chronic Myelogenous Leukemia Treatment Market Size and Forecast by Drug Type, 2012-2026
4.3.1 Branded Market Size and Forecast, 2012-2026
4.3.1.1 Revenue (US$ Mn) Comparison, By Region
4.3.1.2 Market Share Comparison, By Region
4.3.1.3 Y-o-Y growth Comparison, By Region
4.3.2 Generic Market Size and Forecast, 2012-2026
4.3.2.1 Revenue (US$ Mn) Comparison, By Region
4.3.2.2 Market Share Comparison, By Region
4.3.2.3 Y-o-Y growth Comparison, By Region
Chapter 5 North America Chronic Myelogenous Leukemia Treatment Market Size and Forecast, 2012-2026
5.1 Regional Outlook
5.1.1 Political Outlook
5.1.2 Economic Outlook
5.1.3 Business Environment Outlook
5.1.4 North America Healthcare Sector Outlook
5.1.5 Chronic Myelogenous Leukemia Treatment – North America Region Outlook
5.2 Revenue (US$ Mn) Comparison, By Country
5.3 Revenue (US$ Mn) Comparison, By Treatment Type
5.4 Revenue (US$ Mn) Comparison, By Distribution Channel
5.5 Revenue (US$ Mn) Comparison, By Drug Type
Chapter 6 Latin America Chronic Myelogenous Leukemia Treatment Market Size and Forecast, 2012-2026
6.1 Regional Outlook
6.1.1 Political Outlook
6.1.2 Economic Outlook
6.1.3 Business Environment Outlook
6.1.4 Latin America Healthcare Sector Outlook
6.1.5 Chronic Myelogenous Leukemia Treatment – Latin America Region Outlook
6.2 Revenue (US$ Mn) Comparison, By Country
6.3 Revenue (US$ Mn) Comparison, By Treatment Type
6.4 Revenue (US$ Mn) Comparison, By Distribution Channel
6.5 Revenue (US$ Mn) Comparison, By Drug Type
Chapter 7 Europe Chronic Myelogenous Leukemia Treatment Market Size and Forecast, 2012-2026
7.1 Regional Outlook
7.1.1 Political Outlook
7.1.2 Economic Outlook
7.1.3 Business Environment Outlook
7.1.4 Europe Healthcare Sector Outlook
7.1.5 Chronic Myelogenous Leukemia Treatment – Europe Region Outlook
7.2 Revenue (US$ Mn) Comparison, By Country
7.3 Revenue (US$ Mn) Comparison, By Treatment Type
7.4 Revenue (US$ Mn) Comparison, By Distribution Channel
7.5 Revenue (US$ Mn) Comparison, By Drug Type
Chapter 8 Japan Chronic Myelogenous Leukemia Treatment Market Size and Forecast, 2012-2026
8.1 Regional Outlook
8.1.1 Political Outlook
8.1.2 Economic Outlook
8.1.3 Business Environment Outlook
8.1.4 Japan Healthcare Sector Outlook
8.1.5 Chronic Myelogenous Leukemia Treatment – Japan Region Outlook
8.2 Revenue (US$ Mn) Comparison, By Country
8.3 Revenue (US$ Mn) Comparison, By Treatment Type
8.4 Revenue (US$ Mn) Comparison, By Distribution Channel
8.5 Revenue (US$ Mn) Comparison, By Drug Type
Chapter 9 APEJ Chronic Myelogenous Leukemia Treatment Market Size and Forecast, 2012-2026
9.1 Regional Outlook
9.1.1 Political Outlook
9.1.2 Economic Outlook
9.1.3 Business Environment Outlook
9.1.4 Asia Pacific Excluding Japan (APEJ) Healthcare Sector Outlook
9.1.5 Chronic Myelogenous Leukemia Treatment – APEJ Region Outlook
9.2 Revenue (US$ Mn) Comparison, By Country
9.3 Revenue (US$ Mn) Comparison, By Treatment Type
9.4 Revenue (US$ Mn) Comparison, By Distribution Channel
9.5 Revenue (US$ Mn) Comparison, By Drug Type
Chapter 10 MEA Chronic Myelogenous Leukemia Treatment Market Size and Forecast, 2012-2026
10.1 Regional Outlook
10.1.1 Political Outlook
10.1.2 Economic Outlook
10.1.3 Business Environment Outlook
10.1.4 Middle East & Africa (MEA) Healthcare Sector Outlook
10.1.5 Chronic Myelogenous Leukemia Treatment – MEA Region Outlook
10.2 Revenue (US$ Mn) Comparison, By Country
10.3 Revenue (US$ Mn) Comparison, By Treatment Type
10.4 Revenue (US$ Mn) Comparison, By Distribution Channel
10.5 Revenue (US$ Mn) Comparison, By Drug Type
Chapter 11 Global Chronic Myelogenous Leukemia Treatment Market Competitive Landscape and Company Profile
11.1 Global Chronic Myelogenous Leukemia Treatment Market: Company Share Analysis
11.2 Global Chronic Myelogenous Leukemia Treatment Market: Company Dashboard
11.3 Global Chronic Myelogenous Leukemia Treatment Market: Company Profiles
11.3.1 Bristol-Myers Squibb Company
11.3.1.1 Company Overview
11.3.1.2 Product Overview
11.3.1.3 Key Financials
11.3.1.4 Key Developments
11.3.1.5 SWOT Analysis
11.3.2 Novartis AG
11.3.2.1 Company Overview
11.3.2.2 Product Overview
11.3.2.3 Key Financials
11.3.2.4 SWOT Analysis
11.3.3 Pfizer Inc.
11.3.3.1 Company Overview
11.3.3.2 Product Overview
11.3.3.3 Key Financials
11.3.3.4 Key Developments
11.3.3.5 SWOT Analysis
11.3.4 Teva Pharmaceuticals
11.3.4.1 Company Overview
11.3.4.2 Product Overview
11.3.4.3 Key Financials
11.3.4.4 Key Developments
11.3.4.5 SWOT Analysis
11.3.5 Roche Holdings AG
11.3.5.1 Company Overview
11.3.5.2 Product Overview
11.3.5.3 Key Financials
11.3.5.4 Key Developments
11.3.5.5 SWOT Analysis
11.3.6 Incyte Corporation
11.3.6.1 Company Overview
11.3.6.2 Product Overview
11.3.6.3 Key Developments
11.3.7 Bio-Path Holdings, Inc.
11.3.7.1 Company Overview
11.3.7.2 Product Overview
Chapter 12 TMR Research Methodology
Chapter 13 Disclaimer and Contact information
List of Tables
TABLE 1 Global Chronic Myelogenous Leukemia Treatment Market Value (US$ Mn), 2012-2017
TABLE 2 Global Chronic Myelogenous Leukemia Treatment Market Value (US$ Mn), 2018-2026
TABLE 3 Global Chronic Myelogenous Leukemia Treatment Market Value (US$ Mn) and Y-o-Y, 2017-2026
TABLE 4 Global Disease Specific Treatment Segment Value (US$ Mn), By Region 2012-2017
TABLE 5 Global Disease Specific Treatment Segment Value (US$ Mn), By Region 2018-2026
TABLE 6 Global Disease Specific Treatment Segment Market Share, By Region 2012-2017
TABLE 7 Global Disease Specific Treatment Segment Market Share, By Region 2018-2026
TABLE 8 Global Disease Specific Treatment Segment Y-o-Y, By Region 2017-2026
TABLE 9 Global Symptomatic Treatment Segment Value (US$ Mn), By Region 2012-2017
TABLE 10 Global Symptomatic Treatment Segment Value (US$ Mn), By Region 2018-2026
TABLE 11 Global Symptomatic Treatment Segment Market Share, By Region 2012-2017
TABLE 12 Global Symptomatic Treatment Segment Market Share, By Region 2018-2026
TABLE 13 Global Symptomatic Treatment Segment Y-o-Y, By Region 2017-2026
TABLE 14 Global Hospital Pharmacies Segment Value (US$ Mn), By Region 2012-2017
TABLE 15 Global Hospital Pharmacies Segment Value (US$ Mn), By Region 2018-2026
TABLE 16 Global Hospital Pharmacies Segment Market Share, By Region 2012-2017
TABLE 17 Global Hospital Pharmacies Segment Market Share, By Region 2018-2026
TABLE 18 Global Hospital Pharmacies Segment Y-o-Y, By Region 2017-2026
TABLE 19 Global Specialty Pharmacies Segment Value (US$ Mn), By Region 2012-2017
TABLE 20 Global Specialty Pharmacies Segment Value (US$ Mn), By Region 2018-2026
TABLE 21 Global Specialty Pharmacies Segment Market Share, By Region 2012-2017
TABLE 22 Global Specialty Pharmacies Segment Market Share, By Region 2018-2026
TABLE 23 Global Specialty Pharmacies Segment Y-o-Y, By Region 2017-2026
TABLE 24 Global Retail Pharmacies Segment Value (US$ Mn), By Region 2012-2017
TABLE 25 Global Retail Pharmacies Segment Value (US$ Mn), By Region 2018-2026
TABLE 26 Global Retail Pharmacies Segment Market Share, By Region 2012-2017
TABLE 27 Global Retail Pharmacies Segment Market Share, By Region 2018-2026
TABLE 28 Global Retail Pharmacies Segment Y-o-Y, By Region 2017-2026
TABLE 29 Global Branded Segment Value (US$ Mn), By Region 2012-2017
TABLE 30 Global Branded Segment Value (US$ Mn), By Region 2018-2026
TABLE 31 Global Branded Segment Market Share, By Region 2012-2017
TABLE 32 Global Branded Segment Market Share, By Region 2018-2026
TABLE 33 Global Branded Segment Y-o-Y, By Region 2017-2026
TABLE 34 Global Generic Segment Value (US$ Mn), By Region 2012-2017
TABLE 35 Global Generic Segment Value (US$ Mn), By Region 2018-2026
TABLE 36 Global Generic Segment Market Share, By Region 2012-2017
TABLE 37 Global Generic Segment Market Share, By Region 2018-2026
TABLE 38 Global Generic Segment Y-o-Y, By Region 2017-2026
TABLE 39 North America Current Expenditure on Health, (% of GDP), by Country, 2010 – 2016
TABLE 40 North America Per Capita Health Expenditure (US$ PPP), by Country, 2010 - 2016
TABLE 41 North America Per Capita Healthcare Expenditure Y-o-Y Growth (in Real terms %), by Country, 2010 - 2016
TABLE 42 North America Out-of-Pocket Healthcare Expenditure, % of Healthcare Expenditure, by Country, 2010 - 2016
TABLE 43 North America Per Capita Healthcare Expenditure (at Current Price, in US$), by Country, 2010 - 2016
TABLE 44 North America Chronic Myelogenous Leukemia Treatment Market Value (US$ Mn), By Country 2012-2017
TABLE 45 North America Chronic Myelogenous Leukemia Treatment Market Value (US$ Mn), By Country 2018-2026
TABLE 46 North America Chronic Myelogenous Leukemia Treatment Market Value (US$ Mn), By Treatment Type 2012-2017
TABLE 47 North America Chronic Myelogenous Leukemia Treatment Market Value (US$ Mn), By Treatment Type 2018-2026
TABLE 48 North America Chronic Myelogenous Leukemia Treatment Market Value (US$ Mn), By Distribution Channel 2012-2017
TABLE 49 North America Chronic Myelogenous Leukemia Treatment Market Value (US$ Mn), By Distribution Channel 2018-2026
TABLE 50 North America Chronic Myelogenous Leukemia Treatment Market Value (US$ Mn), By Drug Type 2012-2017
TABLE 51 North America Chronic Myelogenous Leukemia Treatment Market Value (US$ Mn), By Drug Type 2018-2026
TABLE 52 Latin America Current Expenditure on Health, (% of GDP), by Country, 2010 – 2016
TABLE 53 Latin America Per Capita Health Expenditure (US$ PPP), by Country, 2010 - 2016
TABLE 54 Latin America Per Capita Healthcare Expenditure Y-o-Y Growth (in Real terms %), by Country, 2010 - 2016
TABLE 55 Latin America Out-of-Pocket Healthcare Expenditure, % of Healthcare Expenditure, by Country, 2010 - 2016
TABLE 56 Latin America Per Capita Healthcare Expenditure (at Current Price, in US$), by Country, 2010 - 2016
TABLE 57 Latin America Chronic Myelogenous Leukemia Treatment Market Value (US$ Mn), By Country 2012-2017
TABLE 58 Latin America Chronic Myelogenous Leukemia Treatment Market Value (US$ Mn), By Country 2018-2026
TABLE 59 Latin America Chronic Myelogenous Leukemia Treatment Market Value (US$ Mn), By Treatment Type 2012-2017
TABLE 60 Latin America Chronic Myelogenous Leukemia Treatment Market Value (US$ Mn), By Treatment Type 2018-2026
TABLE 61 Latin America Chronic Myelogenous Leukemia Treatment Market Value (US$ Mn), By Distribution Channel 2012-2017
TABLE 62 Latin America Chronic Myelogenous Leukemia Treatment Market Value (US$ Mn), By Distribution Channel 2018-2026
TABLE 63 Latin America Chronic Myelogenous Leukemia Treatment Market Value (US$ Mn), By Drug Type 2012-2017
TABLE 64 Latin America Chronic Myelogenous Leukemia Treatment Market Value (US$ Mn), By Drug Type 2018-2026
TABLE 65 Europe Current Expenditure on Health, (% of GDP), by Country, 2010 – 2016
TABLE 66 Europe Per Capita Health Expenditure (US$ PPP), by Country, 2010 - 2016
TABLE 67 Europe Per Capita Healthcare Expenditure Y-o-Y Growth (in Real terms %), by Country, 2010 - 2016
TABLE 68 Europe Out-of-Pocket Healthcare Expenditure, % of Healthcare Expenditure, by Country, 2010 - 2016
TABLE 69 Europe Per Capita Healthcare Expenditure (at Current Price, in US$), by Country, 2010 - 2016
TABLE 70 Europe Chronic Myelogenous Leukemia Treatment Market Value (US$ Mn), By Country 2012-2017
TABLE 71 Europe Chronic Myelogenous Leukemia Treatment Market Value (US$ Mn), By Country 2018-2026
TABLE 72 Europe Chronic Myelogenous Leukemia Treatment Market Value (US$ Mn), By Treatment Type 2012-2017
TABLE 73 Europe Chronic Myelogenous Leukemia Treatment Market Value (US$ Mn), By Treatment Type 2018-2026
TABLE 74 Europe Chronic Myelogenous Leukemia Treatment Market Value (US$ Mn), By Distribution Channel 2012-2017
TABLE 75 Europe Chronic Myelogenous Leukemia Treatment Market Value (US$ Mn), By Distribution Channel 2018-2026
TABLE 76 Europe Chronic Myelogenous Leukemia Treatment Market Value (US$ Mn), By Drug Type 2012-2017
TABLE 77 Europe Chronic Myelogenous Leukemia Treatment Market Value (US$ Mn), By Drug Type 2018-2026
TABLE 78 Japan Current Expenditure on Health, (% of GDP), by Country, 2010 – 2016
TABLE 79 Japan Per Capita Health Expenditure (US$ PPP), by Country, 2010 - 2016
TABLE 80 Japan Per Capita Healthcare Expenditure Y-o-Y Growth (in Real terms %), by Country, 2010 - 2016
TABLE 81 Japan Out-of-Pocket Healthcare Expenditure, % of Healthcare Expenditure, by Country, 2010 - 2016
TABLE 82 Japan Per Capita Healthcare Expenditure (at Current Price, in US$), by Country, 2010 - 2016
TABLE 83 Japan Chronic Myelogenous Leukemia Treatment Market Value (US$ Mn), By Country 2012-2017
TABLE 84 Japan Chronic Myelogenous Leukemia Treatment Market Value (US$ Mn), By Country 2018-2026
TABLE 85 Japan Chronic Myelogenous Leukemia Treatment Market Value (US$ Mn), By Treatment Type 2012-2017
TABLE 86 Japan Chronic Myelogenous Leukemia Treatment Market Value (US$ Mn), By Treatment Type 2018-2026
TABLE 87 Japan Chronic Myelogenous Leukemia Treatment Market Value (US$ Mn), By Distribution Channel 2012-2017
TABLE 88 Japan Chronic Myelogenous Leukemia Treatment Market Value (US$ Mn), By Distribution Channel 2018-2026
TABLE 89 Japan Chronic Myelogenous Leukemia Treatment Market Value (US$ Mn), By Drug Type 2012-2017
TABLE 90 Japan Chronic Myelogenous Leukemia Treatment Market Value (US$ Mn), By Drug Type 2018-2026
TABLE 91 APEJ Current Expenditure on Health, (% of GDP), by Country, 2010 – 2016
TABLE 92 APEJ Per Capita Health Expenditure (US$ PPP), by Country, 2010 - 2016
TABLE 93 APEJ Per Capita Healthcare Expenditure Y-o-Y Growth (in Real terms %), by Country, 2010 - 2016
TABLE 94 APEJ Out-of-Pocket Healthcare Expenditure, % of Healthcare Expenditure, by Country, 2010 - 2016
TABLE 95 APEJ Per Capita Healthcare Expenditure (at Current Price, in US$), by Country, 2010 - 2016
TABLE 96 APEJ Chronic Myelogenous Leukemia Treatment Market Value (US$ Mn), By Country 2012-2017
TABLE 97 APEJ Chronic Myelogenous Leukemia Treatment Market Value (US$ Mn), By Country 2018-2026
TABLE 98 APEJ Chronic Myelogenous Leukemia Treatment Market Value (US$ Mn), By Treatment Type 2012-2017
TABLE 99 APEJ Chronic Myelogenous Leukemia Treatment Market Value (US$ Mn), By Treatment Type 2018-2026
TABLE 100 APEJ Chronic Myelogenous Leukemia Treatment Market Value (US$ Mn), By Distribution Channel 2012-2017
TABLE 101 APEJ Chronic Myelogenous Leukemia Treatment Market Value (US$ Mn), By Distribution Channel 2018-2026
TABLE 102 APEJ Chronic Myelogenous Leukemia Treatment Market Value (US$ Mn), By Drug Type 2012-2017
TABLE 103 APEJ Chronic Myelogenous Leukemia Treatment Market Value (US$ Mn), By Drug Type 2018-2026
TABLE 104 MEA Current Expenditure on Health, (% of GDP), by Country, 2010 – 2016
TABLE 105 MEA Per Capita Health Expenditure (US$ PPP), by Country, 2010 - 2016
TABLE 106 MEA Per Capita Healthcare Expenditure Y-o-Y Growth (in Real terms %), by Country, 2010 - 2016
TABLE 107 MEA Out-of-Pocket Healthcare Expenditure, % of Healthcare Expenditure, by Country, 2010 - 2016
TABLE 108 MEA Per Capita Healthcare Expenditure (at Current Price, in US$), by Country, 2010 - 2016
TABLE 109 MEA Chronic Myelogenous Leukemia Treatment Market Value (US$ Mn), By Country 2012-2017
TABLE 110 MEA Chronic Myelogenous Leukemia Treatment Market Value (US$ Mn), By Country 2018-2026
TABLE 111 MEA Chronic Myelogenous Leukemia Treatment Market Value (US$ Mn), By Treatment Type 2012-2017
TABLE 112 MEA Chronic Myelogenous Leukemia Treatment Market Value (US$ Mn), By Treatment Type 2018-2026
TABLE 113 MEA Chronic Myelogenous Leukemia Treatment Market Value (US$ Mn), By Distribution Channel 2012-2017
TABLE 114 MEA Chronic Myelogenous Leukemia Treatment Market Value (US$ Mn), By Distribution Channel 2018-2026
TABLE 115 MEA Chronic Myelogenous Leukemia Treatment Market Value (US$ Mn), By Drug Type 2012-2017
TABLE 116 MEA Chronic Myelogenous Leukemia Treatment Market Value (US$ Mn), By Drug Type 2018-2026
List of Figures
FIG. 1 Global Chronic Myelogenous Leukemia Treatment Market Value (US$ Mn), 2012-2017
FIG. 2 Global Chronic Myelogenous Leukemia Treatment Market Value (US$ Mn) Forecast, 2018-2026
FIG. 3 Global Chronic Myelogenous Leukemia Treatment Market Value (US$ Mn) and Y-o-Y, 2017-2026
FIG. 4 Global Disease Specific Treatment Segment Market Value (US$ Mn) By Region, 2012-2017
FIG. 5 Global Disease Specific Treatment Segment Market Value (US$ Mn) By Region, 2018-2026
FIG. 6 Global Disease Specific Treatment Segment Y-o-Y Growth Rate, By Region, 2017-2026
FIG. 7 Global Symptomatic Treatment Segment Market Value (US$ Mn) By Region, 2012-2017
FIG. 8 Global Symptomatic Treatment Segment Market Value (US$ Mn) By Region, 2018-2026
FIG. 9 Global Symptomatic Treatment Segment Y-o-Y Growth Rate, By Region, 2017-2026
FIG. 10 Global Hospital Pharmacies Segment Market Value (US$ Mn) By Region, 2012-2017
FIG. 11 Global Hospital Pharmacies Segment Market Value (US$ Mn) By Region, 2018-2026
FIG. 12 Global Hospital Pharmacies Segment Y-o-Y Growth Rate, By Region, 2017-2026
FIG. 13 Global Specialty Pharmacies Segment Market Value (US$ Mn) By Region, 2012-2017
FIG. 14 Global Specialty Pharmacies Segment Market Value (US$ Mn) By Region, 2018-2026
FIG. 15 Global Specialty Pharmacies Segment Y-o-Y Growth Rate, By Region, 2017-2026
FIG. 16 Global Retail Pharmacies Segment Market Value (US$ Mn) By Region, 2012-2017
FIG. 17 Global Retail Pharmacies Segment Market Value (US$ Mn) By Region, 2018-2026
FIG. 18 Global Retail Pharmacies Segment Y-o-Y Growth Rate, By Region, 2017-2026
FIG. 19 Global Branded Segment Market Value (US$ Mn) By Region, 2012-2017
FIG. 20 Global Branded Segment Market Value (US$ Mn) By Region, 2018-2026
FIG. 21 Global Branded Segment Y-o-Y Growth Rate, By Region, 2017-2026
FIG. 22 Global Generic Segment Market Value (US$ Mn) By Region, 2012-2017
FIG. 23 Global Generic Segment Market Value (US$ Mn) By Region, 2018-2026
FIG. 24 Global Generic Segment Y-o-Y Growth Rate, By Region, 2017-2026
FIG. 25 North America Chronic Myelogenous Leukemia Treatment Market Value (US$ Mn), By Country 2012-2017
FIG. 26 North America Chronic Myelogenous Leukemia Treatment Market Value (US$ Mn), By Country 2018-2026
FIG. 27 North America Chronic Myelogenous Leukemia Treatment Market Value (US$ Mn), By Treatment Type 2012-2017
FIG. 28 North America Chronic Myelogenous Leukemia Treatment Market Value (US$ Mn), By Treatment Type 2018-2026
FIG. 29 North America Chronic Myelogenous Leukemia Treatment Market Value (US$ Mn), By Distribution Channel 2012-2017
FIG. 30 North America Chronic Myelogenous Leukemia Treatment Market Value (US$ Mn), By Distribution Channel 2018-2026
FIG. 31 North America Chronic Myelogenous Leukemia Treatment Market Value (US$ Mn), By Drug Type 2012-2017
FIG. 32 North America Chronic Myelogenous Leukemia Treatment Market Value (US$ Mn), By Drug Type 2018-2026
FIG. 33 Latin America Chronic Myelogenous Leukemia Treatment Market Value (US$ Mn), By Country 2012-2017
FIG. 34 Latin America Chronic Myelogenous Leukemia Treatment Market Value (US$ Mn), By Country 2018-2026
FIG. 35 Latin America Chronic Myelogenous Leukemia Treatment Market Value (US$ Mn), By Treatment Type 2012-2017
FIG. 36 Latin America Chronic Myelogenous Leukemia Treatment Market Value (US$ Mn), By Treatment Type 2018-2026
FIG. 37 Latin America Chronic Myelogenous Leukemia Treatment Market Value (US$ Mn), By Distribution Channel 2012-2017
FIG. 38 Latin America Chronic Myelogenous Leukemia Treatment Market Value (US$ Mn), By Distribution Channel 2018-2026
FIG. 39 Latin America Chronic Myelogenous Leukemia Treatment Market Value (US$ Mn), By Drug Type 2012-2017
FIG. 40 Latin America Chronic Myelogenous Leukemia Treatment Market Value (US$ Mn), By Drug Type 2018-2026
FIG. 41 Europe Chronic Myelogenous Leukemia Treatment Market Value (US$ Mn), By Country 2012-2017
FIG. 42 Europe Chronic Myelogenous Leukemia Treatment Market Value (US$ Mn), By Country 2018-2026
FIG. 43 Europe Chronic Myelogenous Leukemia Treatment Market Value (US$ Mn), By Treatment Type 2012-2017
FIG. 44 Europe Chronic Myelogenous Leukemia Treatment Market Value (US$ Mn), By Treatment Type 2018-2026
FIG. 45 Europe Chronic Myelogenous Leukemia Treatment Market Value (US$ Mn), By Distribution Channel 2012-2017
FIG. 46 Europe Chronic Myelogenous Leukemia Treatment Market Value (US$ Mn), By Distribution Channel 2018-2026
FIG. 47 Europe Chronic Myelogenous Leukemia Treatment Market Value (US$ Mn), By Drug Type 2012-2017
FIG. 48 Europe Chronic Myelogenous Leukemia Treatment Market Value (US$ Mn), By Drug Type 2018-2026
FIG. 49 Japan Chronic Myelogenous Leukemia Treatment Market Value (US$ Mn), By Country 2012-2017
FIG. 50 Japan Chronic Myelogenous Leukemia Treatment Market Value (US$ Mn), By Country 2018-2026
FIG. 51 Japan Chronic Myelogenous Leukemia Treatment Market Value (US$ Mn), By Treatment Type 2012-2017
FIG. 52 Japan Chronic Myelogenous Leukemia Treatment Market Value (US$ Mn), By Treatment Type 2018-2026
FIG. 53 Japan Chronic Myelogenous Leukemia Treatment Market Value (US$ Mn), By Drug Type 2012-2017
FIG. 54 Japan Chronic Myelogenous Leukemia Treatment Market Value (US$ Mn), By Distribution Channel 2018-2026
FIG. 55 Japan Chronic Myelogenous Leukemia Treatment Market Value (US$ Mn), By Drug Type 2012-2017
FIG. 56 Japan Chronic Myelogenous Leukemia Treatment Market Value (US$ Mn), By Drug Type 2018-2026
FIG. 57 APEJ Chronic Myelogenous Leukemia Treatment Market Value (US$ Mn), By Country 2012-2017
FIG. 58 APEJ Chronic Myelogenous Leukemia Treatment Market Value (US$ Mn), By Country 2018-2026
FIG. 59 APEJ Chronic Myelogenous Leukemia Treatment Market Value (US$ Mn), By Treatment Type 2012-2017
FIG. 60 APEJ Chronic Myelogenous Leukemia Treatment Market Value (US$ Mn), By Treatment Type 2018-2026
FIG. 61 APEJ Chronic Myelogenous Leukemia Treatment Market Value (US$ Mn), By Distribution Channel 2012-2017
FIG. 62 APEJ Chronic Myelogenous Leukemia Treatment Market Value (US$ Mn), By Distribution Channel 2018-2026
FIG. 63 APEJ Chronic Myelogenous Leukemia Treatment Market Value (US$ Mn), By Drug Type 2012-2017
FIG. 64 APEJ Chronic Myelogenous Leukemia Treatment Market Value (US$ Mn), By Drug Type 2018-2026
FIG. 65 MEA Chronic Myelogenous Leukemia Treatment Market Value (US$ Mn), By Country 2012-2017
FIG. 66 MEA Chronic Myelogenous Leukemia Treatment Market Value (US$ Mn), By Country 2018-2026
FIG. 67 MEA Chronic Myelogenous Leukemia Treatment Market Value (US$ Mn), By Treatment Type 2012-2017
FIG. 68 MEA Chronic Myelogenous Leukemia Treatment Market Value (US$ Mn), By Treatment Type 2018-2026
FIG. 69 MEA Chronic Myelogenous Leukemia Treatment Market Value (US$ Mn), By Distribution Channel 2012-2017
FIG. 70 MEA Chronic Myelogenous Leukemia Treatment Market Value (US$ Mn), By Distribution Channel 2018-2026
FIG. 71 MEA Chronic Myelogenous Leukemia Treatment Market Value (US$ Mn), By Drug Type 2012-2017
FIG. 72 MEA Chronic Myelogenous Leukemia Treatment Market Value (US$ Mn), By Drug Type 2018-2026
Copyright © Transparency Market Research, Inc. All Rights reserved
Trust Online

Chronic Myelogenous Leukemia Treatment Market