
Reports
Reports
Analysts’ Viewpoint on the Cash-in-Transit Bags Market
The global cash-in-transit bags market is highly fragmented, with a few key players holding a large share of the market. Europe and Asian Pacific are highly mature markets for cash-in-transit bags. The market in Asia Pacific is growing due to substantial increase in liquid cash transactions in the region. Key vendors in the cash-in-transit bags market are focusing on high-growth end-users such as financial institutions, casinos, retail chains, and academic institutions to keep their business growing. Customers are increasingly preferring plastic cash transit bags over leather bags for better security. Global players operating in the cash-in-transit bags market are looking at e-commerce platforms to enter uncharted markets.
Cash-in-transit bags are specifically designed to carry a large amount of cash from one location to other. Rise in demand for security bags for the transportation of money and documents is fueling the market for cash-in transit bags. Cash-in-transit bags are lightweight and protect cash from environmental hazards. These bags are largely used in financial institutions, casinos, retail chains, academic institutions, hospitals, government organizations, and other businesses that deal in large volumes of cash.
Increase in risk of online fraud and cybercrime has propelled the need for robust security and safety measures. Cases of online fraud have been rising rapidly across the globe, especially during the COVID-19 pandemic. Significant growth of the e-commerce market, surge in usage of mobile payments, and higher money flow in the online channel are leading to rise in cases of online fraud and crime in various end-use industries across the globe. According to Fraud ‒ The Facts 2021 report, unauthorized financial fraud losses due to payment cards and remote banking stood at US$ 826.9 Mn in 2020. The UK Finance members reported 149,946 incidents of Authorized Push Payment (APP) scams in 2020 with gross losses of US$ 500 Mn. In Europe, around 60% of card fraud is associated with CNP (Cash Not Present) transactions. This is expected to drive cash transactions across the region, thereby propelling the cash-in-transit bags market.
Current packaging solutions are used to transfer cash or coins from one location to another, as opposed to traditional packaging. Cash-in-transit shipping and deposit bags provide additional value for secure and safe transactions. They are equipped with tamper-evident security seals. Rise in concern about safe and secure movement of cash from one place to another is boosting the demand for cash security bags or cash-in-transit bags. Customers are increasingly preferring eco-friendly products; hence, currency transit bag manufacturers are focusing on using less toxic materials.
Growth of the casino industry is driving the need for transportation of cash to and from casinos. This is boosting the demand for cash-in-transit bags. Usage of security deposits and coin bags for casinos is rising at a rapid pace. Casinos ensure that they do not invest in ineffective cash bags that only further enable internal theft or currency loss due to rips and tears. Around 7% of casino revenue is lost due to employee theft. Theft rate in casinos is higher vis-à-vis other industries due to the opportunity being more easily available and the motivation to steal being significantly higher. Studies indicate that casino employees have a higher rate of stealing. Thus, the casino industry is increasingly opting for cash-in-transit bags in order to safeguard money.
Key manufacturers of cash-in-transit bag are focusing on delivering standard or quality products to enhance and support secure cash management supply activities. Mergers and acquisitions are enabling small and medium-sized organizations to avail the opportunity to expand their business across the world. Rise in adoption of cash-in-transit bags in several end-use industries, including retail chain, hospitals, hotels, casinos, financial institutions, and academic institutions, is expected to offer lucrative opportunities to key vendors of cash-in-transit bags to extend and improve their product portfolio and cater to new markets through product innovation. Innovation of smart cash-in-transit bags, which have built-in GPS for security purposes, is an important marketing strategy adopted by manufacturers of cash-in-transit bags.
Europe led the global cash-in-transit bags market in 2021. The market in the region is likely to grow in the near future with incremental opportunities in the U.K. market. Increase in risk of online fraud and cybercrime has fuelled the need for robust security and safety systems in Europe. This is anticipated to propel the cash-in transit bags market in Europe during the forecast period.
The cash-in-transit bags market in developing countries in Asia Pacific, such as China, India, Japan, South Korea, Hong Kong, and Singapore, is expected to grow during the forecast period, due to the increase in buying capacity of consumers in the region. The deposit bags segment held key share of the cash-in-transit bags market in India. Of the total population of India, about 890 million people reside in rural areas. This population transacts only with cash, as digital or cashless method of transaction is unavailable. This is estimated to offer lucrative opportunities for manufacturers of cash-in-transit bags in India.
Detailed profiles of providers of the cash-in-transit bags market have been provided in the report to evaluate their financials, key product offerings, recent developments, and strategies. Majority of the firms are investing significantly in comprehensive research and development activities, primarily to develop environment-friendly products. Expansion of product portfolios and mergers and acquisitions are major strategies adopted by key players. Prominent players in the global cash-in-transit market are A. Rifkin Co., ADSURE Packaging Limited, DynCorp, Harcor Security Seals, Packaging Solutions Ltd., LEGHORN Srl, Nelmar Security Packaging Systems Inc, Packaging Horizons Corporation, The Versapak Group, and TruSeal (Pty) Ltd.
Key players operating in the cash-in transit bags market report have been profiled based on parameters such as company overview, financial overview, business strategies, product portfolio, business segments, and recent developments.
|
Attribute |
Detail |
|
Market Size Value in 2021 (Base Year) |
US$ 391.8 Mn |
|
Market Forecast Value in 2031 |
US$ 587.4 Mn |
|
Growth Rate (CAGR) |
4.2% |
|
Forecast Period |
2022‒2031 |
|
Quantitative Units |
US$ Mn for Value, Million Units for Volume |
|
Market Analysis |
The global qualitative analysis includes drivers, restraints, opportunities, key trends, upcoming key trends, Porter’s Five Forces analysis, value chain analysis, SWOT analysis, technology analysis, regulatory analysis, etc. Furthermore, at the regional level, the qualitative analysis includes key trends, price trends, and key supplier analysis. |
|
Competition Landscape |
Market Player – Competition Dashboard and Revenue Share Analysis 2021 Company Profiles (Details – Company Overview, Sales Area/Geographical Presence, Revenue, COVID-19 Response, Strategy & Business Overview) |
|
Regions Covered |
|
|
Market Segmentation |
|
|
Companies Profile |
|
|
Customization Scope |
Available upon Request |
|
Pricing |
Available upon Reques |
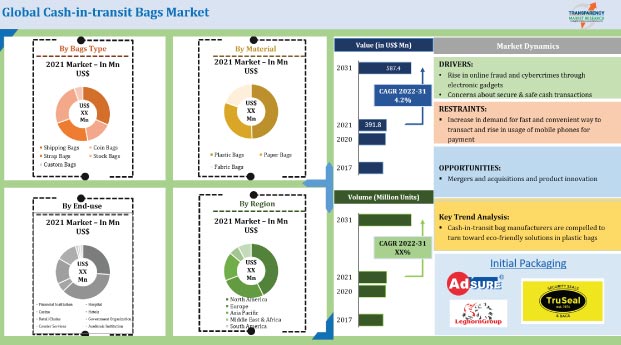
The cash-in-transit bags market stood at US$ 391.8 Mn in 2021.
The cash-in-transit bags market is expected to reach a value of US$ 587.4 Mn by 2031.
Growing concerns among Users about online fraud and cybercrime and concerns about secure & safe cash transactions are key factors driving the cash-in-transit bags market.
The plastic material segment accounted for a prominent share of the global cash-in-transit bags market in 2021.
Europe accounted for about 24% share of the cash-in-transit bags market in 2021.
Key players operating in the global cash-in-transit market are A. Rifkin Co., ADSURE Packaging Limited, DynCorp, Harcor Security Seals, Packaging Solutions Ltd., LEGHORN Srl, Nelmar Security Packaging Systems Inc, Packaging Horizons Corporation, The Versapak Group, and TruSeal (Pty) Ltd.
1. Preface
1.1. Market Definition and Scope
1.2. Market Segmentation
1.3. Key Research Objectives
1.4. Research Highlights
2. Assumptions
3. Research Methodology
4. Executive Summary
5. Market Overview
5.1. Introduction
5.2. Market Dynamics
5.2.1. Drivers
5.2.2. Restraints
5.2.3. Opportunities
5.3. Key Trends Analysis
5.3.1. Demand Side Analysis
5.3.2. Supply Side Analysis
5.4. Regulations & Guidelines
5.5. Key Market Indicators
5.6. Raw Material Analysis
5.7. Porter’s Five Forces Analysis
5.8. Industry SWOT Analysis
5.9. Value Chain Analysis
5.10. Regulatory Framework
5.11. Covid-19 Impact Analysis
5.12. Global Cash-In-Transit Bags Market Analysis and Forecast, 2017‒2031
5.12.1. Market Value Projections (US$ Mn)
5.12.2. Market Volume Projections (Million Units)
6. Global Cash-In-Transit Bags Market Analysis and Forecast, by Bag Type
6.1. Cash-In-Transit Bags Market Size (US$ Mn and Million Units), by Bag Type, 2017‒2031
6.1.1. Deposit Bags
6.1.2. Shipping Bags
6.1.3. Coin Bags
6.1.4. Strap Bags
6.1.5. Stock Bags
6.1.6. Custom Bags
6.2. Incremental Opportunity, by Bag Type
7. Global Cash-In-Transit Bags Market Analysis and Forecast, by Material
7.1. Cash-In-Transit Bags Market Size (US$ Mn and Million Units), by Material, 2017‒2031
7.1.1. Plastic Bags
7.1.2. Paper Bags
7.1.3. Fabric Bags
7.2. Incremental Opportunity, by Material
8. Global Cash-In-Transit Bags Market Analysis and Forecast, by End-use
8.1. Cash-In-Transit Bags Market Size (US$ Mn and Million Units), by End-use, 2017‒2031
8.1.1. Financial Institutions
8.1.2. Hospitals
8.1.3. Casinos
8.1.4. Hotels
8.1.5. Retail Chains
8.1.6. Government Organizations
8.1.7. Courier Services
8.1.8. Academic Institutions
8.2. Incremental Opportunity, by End-use
9. Global Cash-In-Transit Bags Market Analysis and Forecast, by Region
9.1. Cash-In-Transit Bags Market Size (US$ Mn and Million Units), by Region, 2017‒2031
9.1.1. North America
9.1.2. Europe
9.1.3. Asia Pacific
9.1.4. Middle East & Africa
9.1.5. South America
9.2. Incremental Opportunity, by Region
10. North America Cash-In-Transit Bags Market Analysis and Forecast
10.1. Regional Snapshot
10.2. Consumer Buying Behavior
10.3. Brand Analysis
10.4. Price Trend Analysis
10.4.1. Weighted Average Price
10.5. Key Trends Analysis
10.5.1. Demand Side
10.5.2. Supplier Side
10.6. Cash-In-Transit Bags Market Size (US$ Mn and Million Units), by Bag Type, 2017 – 2031
10.6.1. Deposit Bags
10.6.2. Shipping Bags
10.6.3. Coin Bags
10.6.4. Strap Bags
10.6.5. Stock Bags
10.6.6. Custom Bags
10.7. Cash-In-Transit Bags Market Size (US$ Mn and Million Units), by Material, 2017‒2031
10.7.1. Plastic Bags
10.7.2. Paper Bags
10.7.3. Fabric Bags
10.8. Cash-In-Transit Bags Market Size (US$ Mn and Million Units), by End-use, 2017‒2031
10.8.1. Financial Institutions
10.8.2. Hospitals
10.8.3. Casinos
10.8.4. Hotels
10.8.5. Retail Chains
10.8.6. Government Organizations
10.8.7. Courier Services
10.8.8. Academic Institutions
10.9. Cash-In-Transit Bags Market Size (US$ Mn and Million Units), by Country, 2017‒2031
10.9.1. U.S
10.9.2. Canada
10.9.3. Rest of North America
10.10. Incremental Opportunity Analysis
11. Europe Cash-In-Transit Bags Market Analysis and Forecast
11.1. Regional Snapshot
11.2. Consumer Buying Behavior
11.3. Brand Analysis
11.4. Price Trend Analysis
11.4.1. Weighted Average Price
11.5. Key Trends Analysis
11.5.1. Demand Side
11.5.2. Supplier Side
11.6. Cash-In-Transit Bags Market Size (US$ Mn and Million Units), by Bag Type, 2017 – 2031
11.6.1. Deposit Bags
11.6.2. Shipping Bags
11.6.3. Coin Bags
11.6.4. Strap Bags
11.6.5. Stock Bags
11.6.6. Custom Bags
11.7. Cash-In-Transit Bags Market Size (US$ Mn and Million Units), by Material, 2017‒2031
11.7.1. Plastic Bags
11.7.2. Paper Bags
11.7.3. Fabric Bags
11.8. Cash-In-Transit Bags Market Size (US$ Mn and Million Units), by End-use, 2017‒2031
11.8.1. Financial Institutions
11.8.2. Hospitals
11.8.3. Casinos
11.8.4. Hotels
11.8.5. Retail Chains
11.8.6. Government Organizations
11.8.7. Courier Services
11.8.8. Academic Institutions
11.9. Incremental Opportunity Analysis
11.10. Cash-In-Transit Bags Market Size (US$ Mn and Million Units), by Country & Sub-region, 2017‒2031
11.10.1. U.K
11.10.2. France
11.10.3. Rest of Europe
11.11. Incremental Opportunity Analysis
12. Asia Pacific Cash-In-Transit Bags Market Analysis and Forecast
12.1. Regional Snapshot
12.2. Consumer Buying Behavior
12.3. Brand Analysis
12.4. Price Trend Analysis
12.4.1. Weighted Average Price
12.5. Key Trends Analysis
12.5.1. Demand Side
12.5.2. Supplier Side
12.6. Cash-In-Transit Bags Market Size (US$ Mn and Million Units), by Bag Type, 2017 – 2031
12.6.1. Deposit Bags
12.6.2. Shipping Bags
12.6.3. Coin Bags
12.6.4. Strap Bags
12.6.5. Stock Bags
12.6.6. Custom Bags
12.7. Cash-In-Transit Bags Market Size (US$ Mn and Million Units), by Material, 2017‒2031
12.7.1. Plastic Bags
12.7.2. Paper Bags
12.7.3. Fabric Bags
12.8. Cash-In-Transit Bags Market Size (US$ Mn and Million Units), by End-use, 2017‒2031
12.8.1. Financial Institutions
12.8.2. Hospitals
12.8.3. Casinos
12.8.4. Hotels
12.8.5. Retail Chains
12.8.6. Government Organizations
12.8.7. Courier Services
12.8.8. Academic Institutions
12.9. Cash-In-Transit Bags Market Size (US$ Mn and Million Units), by Country & Sub-region, 2017‒2031
12.9.1. China
12.9.2. India
12.9.3. Rest of Asia Pacific
12.10. Incremental Opportunity Analysis
13. Middle East and Africa Cash-In-Transit Bags Market Analysis and Forecast
13.1. Regional Snapshot
13.2. Consumer Buying Behavior
13.3. Brand Analysis
13.4. Price Trend Analysis
13.4.1. Weighted Average Price
13.5. Key Trends Analysis
13.5.1. Demand Side
13.5.2. Supplier Side
13.6. Cash-In-Transit Bags Market Size (US$ Mn and Million Units), by Bag Type, 2017 – 2031
13.6.1. Deposit Bags
13.6.2. Shipping Bags
13.6.3. Coin Bags
13.6.4. Strap Bags
13.6.5. Stock Bags
13.6.6. Custom Bags
13.7. Cash-In-Transit Bags Market Size (US$ Mn and Million Units), by Material, 2017‒2031
13.7.1. Plastic Bags
13.7.2. Paper Bags
13.7.3. Fabric Bags
13.8. Cash-In-Transit Bags Market Size (US$ Mn and Million Units), by End-use, 2017‒2031
13.8.1. Financial Institutions
13.8.2. Hospitals
13.8.3. Casinos
13.8.4. Hotels
13.8.5. Retail Chains
13.8.6. Government Organizations
13.8.7. Courier Services
13.8.8. Academic Institutions
13.9. Cash-In-Transit Bags Market Size (US$ Mn and Million Units), by Country & Sub-region, 2017‒2031
13.9.1. GCC
13.9.2. South Africa
13.9.3. Rest of Middle East & Africa
13.10. Incremental Opportunity Analysis
14. South America Cash-In-Transit Bags Market Analysis and Forecast
14.1. Regional Snapshot
14.2. Consumer Buying Behavior
14.3. Brand Analysis
14.4. Price Trend Analysis
14.4.1. Weighted Average Price
14.5. Key Trends Analysis
14.5.1. Demand Side
14.5.2. Supplier Side
14.6. Cash-In-Transit Bags Market Size (US$ Mn and Million Units), by Bag Type, 2017 – 2031
14.6.1. Deposit Bags
14.6.2. Shipping Bags
14.6.3. Coin Bags
14.6.4. Strap Bags
14.6.5. Stock Bags
14.6.6. Custom Bags
14.7. Cash-In-Transit Bags Market Size (US$ Mn and Million Units), by Material, 2017‒2031
14.7.1. Plastic Bags
14.7.2. Paper Bags
14.7.3. Fabric Bags
14.8. Cash-In-Transit Bags Market Size (US$ Mn and Million Units), by End-use, 2017‒2031
14.8.1. Financial Institutions
14.8.2. Hospitals
14.8.3. Casinos
14.8.4. Hotels
14.8.5. Retail Chains
14.8.6. Government Organizations
14.8.7. Courier Services
14.8.8. Academic Institutions
14.9. Cash-In-Transit Bags Market Size (US$ Mn and Million Units), by Country, 2017‒2031
14.9.1. Brazil
14.9.2. Mexico
14.9.3. Rest of South America
14.10. Incremental Opportunity Analysis
15. Competition Landscape
15.1. Market Player – Competition Dashboard
15.2. Market Share Analysis (%), by Company, (2021)
15.3. Company Profiles (Details – Company Overview, Sales Area/Geographical Presence, Revenue, Strategy & Business Overview)
15.3.1. A. Rifkin Co.
15.3.1.1. Company Overview
15.3.1.2. Sales Area/Geographical Presence
15.3.1.3. Revenue
15.3.1.4. Strategy & Business Overview
15.3.2. ADSURE® Packaging Limited
15.3.2.1. Company Overview
15.3.2.2. Sales Area/Geographical Presence
15.3.2.3. Revenue
15.3.2.4. Strategy & Business Overview
15.3.3. DynaCorp
15.3.3.1. Company Overview
15.3.3.2. Sales Area/Geographical Presence
15.3.3.3. Revenue
15.3.3.4. Strategy & Business Overview
15.3.4. Harcor Security Seals
15.3.4.1. Company Overview
15.3.4.2. Sales Area/Geographical Presence
15.3.4.3. Revenue
15.3.4.4. Strategy & Business Overview
15.3.5. Initial Packaging Solutions Ltd.
15.3.5.1. Company Overview
15.3.5.2. Sales Area/Geographical Presence
15.3.5.3. Revenue
15.3.5.4. Strategy & Business Overview
15.3.6. LEGHORN srl
15.3.6.1. Company Overview
15.3.6.2. Sales Area/Geographical Presence
15.3.6.3. Revenue
15.3.6.4. Strategy & Business Overview
15.3.7. Nelmar Security Packaging Systems Inc
15.3.7.1. Company Overview
15.3.7.2. Sales Area/Geographical Presence
15.3.7.3. Revenue
15.3.7.4. Strategy & Business Overview
15.3.8. Packaging Horizons Corporation
15.3.8.1. Company Overview
15.3.8.2. Sales Area/Geographical Presence
15.3.8.3. Revenue
15.3.8.4. Strategy & Business Overview
15.3.9. The Versapak Group
15.3.9.1. Company Overview
15.3.9.2. Sales Area/Geographical Presence
15.3.9.3. Revenue
15.3.9.4. Strategy & Business Overview
15.3.10. TruSeal (Pty) Ltd
15.3.10.1. Company Overview
15.3.10.2. Sales Area/Geographical Presence
15.3.10.3. Revenue
15.3.10.4. Strategy & Business Overview
16. Key Takeaways
16.1. Identification of Potential Market Spaces
16.1.1. By Bag Type
16.1.2. By Material
16.1.3. By End-use
16.1.4. By Region
16.2. Understanding the Buying Process of the Customers
16.3. Prevailing Market Risks
16.4. Preferred Sales & Marketing Strategy
List of Tables
Table 1: Global Cash-In-Transit Bags Market Value (US$ Mn) Forecast, 2017‒2031, by Bag Type
Table 2: Global Cash-In-Transit Bags Market Volume (Million Units) Forecast, 2017‒2031, by Bag Type
Table 3: Global Cash-In-Transit Bags Market Value (US$ Mn) Forecast, 2017‒2031, by Material
Table 4: Global Cash-In-Transit Bags Market Volume (Million Units) Forecast, 2017‒2031, by Material
Table 5: Global Cash-In-Transit Bags Market Value (US$ Mn) Forecast, 2017‒2031, by End-use
Table 6: Global Cash-In-Transit Bags Market Volume (Million Units) Forecast, 2017‒2031, by End-use
Table 7: Global Cash-In-Transit Bags Market Value (US$ Mn) Forecast, 2017‒2031, by Region
Table 8: Global Cash-In-Transit Bags Market Volume (Million Units) Forecast, 2017‒2031, by Region
Table 9: North America Cash-In-Transit Bags Market Value (US$ Mn) Forecast, 2017‒2031, by Bag Type
Table 10: North America Cash-In-Transit Bags Market Volume (Million Units) Forecast, 2017‒2031, by Bag Type
Table 11: North America Cash-In-Transit Bags Market Value (US$ Mn) Forecast, 2017‒2031, by Material
Table 12: North America Cash-In-Transit Bags Market Volume (Million Units) Forecast, 2017‒2031, by Material
Table 13: North America Cash-In-Transit Bags Market Value (US$ Mn) Forecast, 2017‒2031, by End-use
Table 14: North America Cash-In-Transit Bags Market Volume (Million Units) Forecast, 2017‒2031, by End-use
Table 15: North America Cash-In-Transit Bags Market Value (US$ Mn) Forecast, 2017‒2031, by Country
Table 16: North America Cash-In-Transit Bags Market Volume (Million Units) Forecast, 2017‒2031, by Country
Table 17: Europe Cash-In-Transit Bags Market Value (US$ Mn) Forecast, 2017‒2031, by Bag Type
Table 18: Europe Cash-In-Transit Bags Market Volume (Million Units) Forecast, 2017‒2031, by Bag Type
Table 19: Europe Cash-In-Transit Bags Market Value (US$ Mn) Forecast, 2017‒2031, by Material
Table 20: Europe Cash-In-Transit Bags Market Volume (Million Units) Forecast, 2017‒2031, by Material
Table 21: Europe Cash-In-Transit Bags Market Value (US$ Mn) Forecast, 2017‒2031, by End-use
Table 22: Europe Cash-In-Transit Bags Market Volume (Million Units) Forecast, 2017‒2031, by End-use
Table 23: Europe Cash-In-Transit Bags Market Value (US$ Mn) Forecast, 2017‒2031, by Country & Sub-region
Table 24: Europe Cash-In-Transit Bags Market Volume (Million Units) Forecast, 2017‒2031, by Country & Sub-region
Table 25: Asia Pacific Cash-In-Transit Bags Market Value (US$ Mn) Forecast, 2017‒2031, by Bag Type
Table 26: Asia Pacific Cash-In-Transit Bags Market Volume (Million Units) Forecast, 2017‒2031, by Bag Type
Table 27: Asia Pacific Cash-In-Transit Bags Market Value (US$ Mn) Forecast, 2017‒2031, by Material
Table 28: Asia Pacific Cash-In-Transit Bags Market Volume (Million Units) Forecast, 2017‒2031, by Material
Table 29: Asia Pacific Cash-In-Transit Bags Market Value (US$ Mn) Forecast, 2017‒2031, by End-use
Table 30: Asia Pacific Cash-In-Transit Bags Market Volume (Million Units) Forecast, 2017‒2031, by End-use
Table 31: Asia Pacific Cash-In-Transit Bags Market Value (US$ Mn) Forecast, 2017‒2031, by Country & Sub-region
Table 32: Asia Pacific Cash-In-Transit Bags Market Volume (Million Units) Forecast, 2017‒2031, by Country & Sub-region
Table 33: Middle East & Africa Cash-In-Transit Bags Market Value (US$ Mn) Forecast, 2017‒2031, by Bag Type
Table 34: Middle East & Africa Cash-In-Transit Bags Market Volume (Million Units) Forecast, 2017‒2031, by Bag Type
Table 35: Middle East & Africa Cash-In-Transit Bags Market Value (US$ Mn) Forecast, 2017‒2031, by Material
Table 36: Middle East & Africa Cash-In-Transit Bags Market Volume (Million Units) Forecast, 2017‒2031, by Material
Table 37: Middle East & Africa Cash-In-Transit Bags Market Value (US$ Mn) Forecast, 2017‒2031, by End-use
Table 38: Middle East & Africa Cash-In-Transit Bags Market Volume (Million Units) Forecast, 2017‒2031, by End-use
Table 39: Middle East & Africa Cash-In-Transit Bags Market Value (US$ Mn) Forecast, 2017‒2031, by Country & Sub-region
Table 40: Middle East & Africa Cash-In-Transit Bags Market Volume (Million Units) Forecast, 2017‒2031, by Country & Sub-region
Table 41: South America Cash-In-Transit Bags Market Value (US$ Mn) Forecast, 2017‒2031, by Bag Type
Table 42: South America Cash-In-Transit Bags Market Volume (Million Units) Forecast, 2017‒2031, by Bag Type
Table 43: South America Cash-In-Transit Bags Market Value (US$ Mn) Forecast, 2017‒2031, by Material
Table 44: South America Cash-In-Transit Bags Market Volume (Million Units) Forecast, 2017‒2031, by Material
Table 45: South America Cash-In-Transit Bags Market Value (US$ Mn) Forecast, 2017‒2031, by End-use
Table 46: South America Cash-In-Transit Bags Market Volume (Million Units) Forecast, 2017‒2031, by End-use
Table 47: South America Cash-In-Transit Bags Market Value (US$ Mn) Forecast, 2017‒2031, by Country & Sub-region
Table 48: South America Cash-In-Transit Bags Market Volume (Million Units) Forecast, 2017‒2031, by Country & Sub-region
List of Figures
Figure 1: Global Cash-In-Transit Bags Market Value (US$ Mn) Forecast, 2017‒2031, by Bag Type
Figure 2: Global Cash-In-Transit Bags Market Volume (Million Units) Forecast, 2017‒2031, by Bag Type
Figure 3: Global Cash-In-Transit Bags Market, Incremental Growth (US$ Mn) Forecast, 2022‒2031, by Bag Type
Figure 4: Global Cash-In-Transit Bags Market Value (US$ Mn) Forecast, 2017‒2031, by Material
Figure 5: Global Cash-In-Transit Bags Market Volume (Million Units) Forecast, 2017‒2031, by Material
Figure 6: Global Cash-In-Transit Bags Market, Incremental Growth (US$ Mn) Forecast, 2022‒2031, by Material
Figure 7: Global Cash-In-Transit Bags Market Value (US$ Mn) Forecast, 2017‒2031, by End-use
Figure 8: Global Cash-In-Transit Bags Market Volume (Million Units) Forecast, 2017‒2031, by End-use
Figure 9: Global Cash-In-Transit Bags Market, Incremental Growth (US$ Mn) Forecast, 2022‒2031, by End-use
Figure 10: Global Cash-In-Transit Bags Market Value (US$ Mn) Forecast, 2017‒2031, by Region
Figure 11: Global Cash-In-Transit Bags Market Volume (Million Units) Forecast, 2017‒2031, by Region
Figure 12: Global Cash-In-Transit Bags Market, Incremental Growth (US$ Mn) Forecast, 2022‒2031, by Region
Figure 13: North America Cash-In-Transit Bags Market Value (US$ Mn) Forecast, 2017‒2031, by Bag Type
Figure 14: North America Cash-In-Transit Bags Market Volume (Million Units) Forecast, 2017‒2031, by Bag Type
Figure 15: North America Cash-In-Transit Bags Market, Incremental Growth (US$ Mn) Forecast, 2022‒2031, by Bag Type
Figure 16: North America Cash-In-Transit Bags Market Value (US$ Mn) Forecast, 2017‒2031, by Material
Figure 17: North America Cash-In-Transit Bags Market Volume (Million Units) Forecast, 2017‒2031, by Material
Figure 18: North America Cash-In-Transit Bags Market, Incremental Growth (US$ Mn) Forecast, 2022‒2031, by Material
Figure 19: North America Cash-In-Transit Bags Market Value (US$ Mn) Forecast, 2017‒2031, by End-use
Figure 20: North America Cash-In-Transit Bags Market Volume (Million Units) Forecast, 2017‒2031, by End-use
Figure 21: North America Cash-In-Transit Bags Market, Incremental Growth (US$ Mn) Forecast, 2022‒2031, by End-use
Figure 22: North America Cash-In-Transit Bags Market Value (US$ Mn) Forecast, 2017‒2031, by Country
Figure 23: North America Cash-In-Transit Bags Market Volume (Million Units) Forecast, 2017‒2031, by Country
Figure 24: North America Cash-In-Transit Bags Market, Incremental Growth (US$ Mn) Forecast, 2022‒2031, by Country
Figure 25: Europe Cash-In-Transit Bags Market Value (US$ Mn) Forecast, 2017‒2031, by Bag Type
Figure 26: Europe Cash-In-Transit Bags Market Volume (Million Units) Forecast, 2017‒2031, by Bag Type
Figure 27: Europe Cash-In-Transit Bags Market, Incremental Growth (US$ Mn) Forecast, 2022‒2031, by Bag Type
Figure 28: Europe Cash-In-Transit Bags Market Value (US$ Mn) Forecast, 2017‒2031, by Material
Figure 29: Europe Cash-In-Transit Bags Market Volume (Million Units) Forecast, 2017‒2031, by Material
Figure 30: Europe Cash-In-Transit Bags Market, Incremental Growth (US$ Mn) Forecast, 2022‒2031, by Material
Figure 31: Europe Cash-In-Transit Bags Market Value (US$ Mn) Forecast, 2017‒2031, by End-use
Figure 32: Europe Cash-In-Transit Bags Market Volume (Million Units) Forecast, 2017‒2031, by End-use
Figure 33: Europe Cash-In-Transit Bags Market, Incremental Growth (US$ Mn) Forecast, 2022‒2031, by End-use
Figure 34: Europe Cash-In-Transit Bags Market Value (US$ Mn) Forecast, 2017‒2031, by Country & Sub-region
Figure 35: Europe Cash-In-Transit Bags Market Volume (Million Units) Forecast, 2017‒2031, by Country & Sub-region
Figure 36: Europe Cash-In-Transit Bags Market, Incremental Growth (US$ Mn) Forecast, 2022‒2031, by Country & Sub-region
Figure 37: Asia Pacific Cash-In-Transit Bags Market Value (US$ Mn) Forecast, 2017‒2031, by Bag Type
Figure 38: Asia Pacific Cash-In-Transit Bags Market Volume (Million Units) Forecast, 2017‒2031, by Bag Type
Figure 39: Asia Pacific Cash-In-Transit Bags Market, Incremental Growth (US$ Mn) Forecast, 2022‒2031, by Bag Type
Figure 40: Asia Pacific Cash-In-Transit Bags Market Value (US$ Mn) Forecast, 2017‒2031, by Material
Figure 41: Asia Pacific Cash-In-Transit Bags Market Volume (Million Units) Forecast, 2017‒2031, by Material
Figure 42: Asia Pacific Cash-In-Transit Bags Market, Incremental Growth (US$ Mn) Forecast, 2022‒2031, by Material
Figure 43: Asia Pacific Cash-In-Transit Bags Market Value (US$ Mn) Forecast, 2017‒2031, by End-use
Figure 44: Asia Pacific Cash-In-Transit Bags Market Volume (Million Units) Forecast, 2017‒2031, by End-use
Figure 45: Asia Pacific Cash-In-Transit Bags Market, Incremental Growth (US$ Mn) Forecast, 2022‒2031, by End-use
Figure 46: Asia Pacific Cash-In-Transit Bags Market Value (US$ Mn) Forecast, 2017‒2031, by Country & Sub-region
Figure 47: Asia Pacific Cash-In-Transit Bags Market Volume (Million Units) Forecast, 2017‒2031, by Country & Sub-region
Figure 48: Asia Pacific Cash-In-Transit Bags Market, Incremental Growth (US$ Mn) Forecast, 2022‒2031, by Country & Sub-region
Figure 49: Middle East & Africa Cash-In-Transit Bags Market Value (US$ Mn) Forecast, 2017‒2031, by Bag Type
Figure 50: Middle East & Africa Cash-In-Transit Bags Market Volume (Million Units) Forecast, 2017‒2031, by Bag Type
Figure 51: Middle East & Africa Cash-In-Transit Bags Market, Incremental Growth (US$ Mn) Forecast, 2022‒2031, by Bag Type
Figure 52: Middle East & Africa Cash-In-Transit Bags Market Value (US$ Mn) Forecast, 2017‒2031, by Material
Figure 53: Middle East & Africa Cash-In-Transit Bags Market Volume (Million Units) Forecast, 2017‒2031, by Material
Figure 54: Middle East & Africa Cash-In-Transit Bags Market, Incremental Growth (US$ Mn) Forecast, 2022‒2031, by Material
Figure 55: Middle East & Africa Cash-In-Transit Bags Market Value (US$ Mn) Forecast, 2017‒2031, by End-use
Figure 56: Middle East & Africa Cash-In-Transit Bags Market Volume (Million Units) Forecast, 2017‒2031, by End-use
Figure 57: Middle East & Africa Cash-In-Transit Bags Market, Incremental Growth (US$ Mn) Forecast, 2022‒2031, by End-use
Figure 58: Middle East & Africa Cash-In-Transit Bags Market Value (US$ Mn) Forecast, 2017‒2031, by Country & Sub-region
Figure 59: Middle East & Africa Cash-In-Transit Bags Market Volume (Million Units) Forecast, 2017‒2031, by Country & Sub-region
Figure 60: Middle East & Africa Cash-In-Transit Bags Market, Incremental Growth (US$ Mn) Forecast, 2022‒2031, by Country & Sub-region
Figure 61: South America Cash-In-Transit Bags Market Value (US$ Mn) Forecast, 2017‒2031, by Bag Type
Figure 62: South America Cash-In-Transit Bags Market Volume (Million Units) Forecast, 2017‒2031, by Bag Type
Figure 63: South America Cash-In-Transit Bags Market, Incremental Growth (US$ Mn) Forecast, 2022‒2031, by Bag Type
Figure 64: South America Cash-In-Transit Bags Market Value (US$ Mn) Forecast, 2017‒2031, by Material
Figure 65: South America Cash-In-Transit Bags Market Volume (Million Units) Forecast, 2017‒2031, by Material
Figure 66: South America Cash-In-Transit Bags Market, Incremental Growth (US$ Mn) Forecast, 2022‒2031, by Material
Figure 67: South America Cash-In-Transit Bags Market Value (US$ Mn) Forecast, 2017‒2031, by End-use
Figure 68: South America Cash-In-Transit Bags Market Volume (Million Units) Forecast, 2017‒2031, by End-use
Figure 69: South America Cash-In-Transit Bags Market, Incremental Growth (US$ Mn) Forecast, 2022‒2031, by End-use
Figure 70: South America Cash-In-Transit Bags Market Value (US$ Mn) Forecast, 2017‒2031, by Country & Sub-region
Figure 71: South America Cash-In-Transit Bags Market Volume (Million Units) Forecast, 2017‒2031, by Country & Sub-region
Figure 72: South America Cash-In-Transit Bags Market, Incremental Growth (US$ Mn) Forecast, 2022‒2031, by Country & Sub-region
Copyright © Transparency Market Research, Inc. All Rights reserved
Trust Online

Cash-in Transit Bags Market