
Reports
Reports
The global automotive valves market is anticipated to be pampered by the soaring demand for automobiles underlining the significance of the valves in evaluating their performance. Automobiles equipped with ecofriendly and advanced engines being highly demanded are envisioned to subsequently benefit the growth of the market. Owing to the inclination of consumers toward electric automobiles, solenoid valves could welcome a growing demand in the market.
The electrification of automobiles, introduction of sophisticated technology, and increased manufacturing are projected to be crucial factors important for the growth of the market. New government regulations enforced on automobile manufacturers for safeguarding the environment could augment the demand for automotive valves with the production of efficient and environment-friendly automobiles.
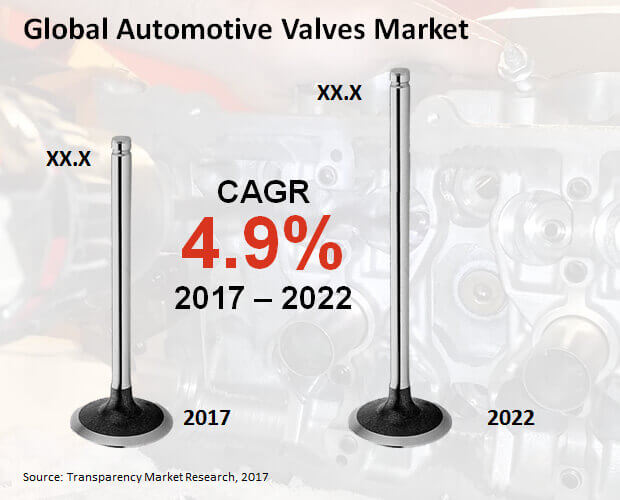
The global automotive valves market is envisaged to parade a valuation of US$34.2 bn by the end of 2022 at a CAGR of 4.9% between 2017 and 2022. In 2017, the market was valued at a US$27.0 bn.
The world automotive valves market is foreseen to be classified according to four categories, viz. product, vehicle, sales channel, and function. As per the product classification, the market could be segregated into AT control valve, water valve, tire valve, exhaust gas recirculation valve, solenoid valve, fuel system valve, thermostat valve, brake valve, air conditioning (A/C) valve, and engine (inlet and outlet) valve. Amongst these, engine (inlet and outlet) valve could rake in a higher share in the market while growing at a 5.2% CAGR.
The segmentation of the world automotive valves market by vehicle could include plug-in hybrid electric vehicles (PHEVs), hybrid electric vehicles (HEVs), battery electric vehicles (BEVs), heavy commercial vehicles (HCVs), light commercial vehicles (LCVs), luxury passenger cars, premium passenger cars, mid-size passenger cars, and compact passenger cars.
By sales channel, the world automotive valves market is foretold to be segmented into original equipment manufacturer (OEM) and aftermarket.
On the basis of function, electric, pneumatic, hydraulic, and mechanical and pilot-operated could be key segments of the world automotive valves market.
In terms of regional segmentation, the international automotive valves market is prophesized to be cataloged into the Middle East and Africa (MEA), North America, Asia Pacific except Japan (APEJ), Latin America, and Europe. Japan could be another market for automotive valves, according to the report, but with a comparatively humbler growth than prime regions such as APEJ and North America.
APEJ is prognosticated to boast of a stronger revenue growth throughout the forecast timeframe. By the concluding forecast year, the regional market could stockpile a US$12.6 bn at an impressive CAGR. Expanding at a slightly higher CAGR than APEJ’s, North America is predicted to collect an over half of the revenue expected to be garnered by the emerging region by 2022 end.
Some of the competent companies exploring the worldwide automotive valves market could be Continental AG, Delphi Automotive, Hitachi Ltd., Denso Corporation, Federal-Mogul LLC, Eaton, FTE Automotive, MAHLE GmbH, FUJI OOZX, Inc., and Knorr Bremse AG.
1. Global Automotive Valves Market - Executive Summary
2. Global Automotive Valves Market Overview
2.1. Introduction
2.1.1. Global Automotive Valves Market Taxonomy
2.1.2. Global Automotive Valves Market Definition
2.2. Global Automotive Valves Market Size (US$ Mn) and Forecast, 2012-2022
2.2.1. Global Automotive Valves Market Y-o-Y Growth
2.3. Global Automotive Valves Market Dynamics
2.4. Supply Chain
2.5. Cost Structure
2.6. Pricing Analysis
2.7. Raw Material Sourcing Strategy and Analysis
2.8. List of Distributors
2.9. Key Participants Market Presence (Intensity Map) By Region
3. Global Automotive Valves Market Analysis and Forecast By Product Type
3.1. Global Automotive Valves Market Size and Forecast By Product Type, 2012-2022
3.1.1. Engine (inlet and outlet) valves Market Size and Forecast, 2012-2022
3.1.1.1. Revenue (US$ Mn) Comparison, By Region
3.1.1.2. Market Share Comparison, By Region
3.1.1.3. Y-o-Y growth Comparison, By Region
3.1.2. A/c valve Market Size and Forecast, 2012-2022
3.1.2.1. Revenue (US$ Mn) Comparison, By Region
3.1.2.2. Market Share Comparison, By Region
3.1.2.3. Y-o-Y growth Comparison, By Region
3.1.3. Brake valve Market Size and Forecast, 2012-2022
3.1.3.1. Revenue (US$ Mn) Comparison, By Region
3.1.3.2. Market Share Comparison, By Region
3.1.3.3. Y-o-Y growth Comparison, By Region
3.1.4. Thermostat valve Market Size and Forecast, 2012-2022
3.1.4.1. Revenue (US$ Mn) Comparison, By Region
3.1.4.2. Market Share Comparison, By Region
3.1.4.3. Y-o-Y growth Comparison, By Region
3.1.5. Fuel system valve Market Size and Forecast, 2012-2022
3.1.5.1. Revenue (US$ Mn) Comparison, By Region
3.1.5.2. Market Share Comparison, By Region
3.1.5.3. Y-o-Y growth Comparison, By Region
3.1.6. Solenoid valve Market Size and Forecast, 2012-2022
3.1.6.1. Revenue (US$ Mn) Comparison, By Region
3.1.6.2. Market Share Comparison, By Region
3.1.6.3. Y-o-Y growth Comparison, By Region
3.1.7. Exhaust gas recirculation valve Market Size and Forecast, 2012-2022
3.1.7.1. Revenue (US$ Mn) Comparison, By Region
3.1.7.2. Market Share Comparison, By Region
3.1.7.3. Y-o-Y growth Comparison, By Region
3.1.8. Tire valve Market Size and Forecast, 2012-2022
3.1.8.1. Revenue (US$ Mn) Comparison, By Region
3.1.8.2. Market Share Comparison, By Region
3.1.8.3. Y-o-Y growth Comparison, By Region
3.1.9. Water valve Market Size and Forecast, 2012-2022
3.1.9.1. Revenue (US$ Mn) Comparison, By Region
3.1.9.2. Market Share Comparison, By Region
3.1.9.3. Y-o-Y growth Comparison, By Region
3.1.10. AT control valve Market Size and Forecast, 2012-2022
3.1.10.1. Revenue (US$ Mn) Comparison, By Region
3.1.10.2. Market Share Comparison, By Region
3.1.10.3. Y-o-Y growth Comparison, By Region
4. Global Automotive Valves Market Analysis and Forecast By Vehicle Type
4.1. Global Automotive Valves Market Size and Forecast By Vehicle Type, 2012-2022
4.1.1. Compact Passenger Cars Market Size and Forecast, 2012-2022
4.1.1.1. Revenue (US$ Mn) Comparison, By Region
4.1.1.2. Market Share Comparison, By Region
4.1.1.3. Y-o-Y growth Comparison, By Region
4.1.2. Mid-sized Passenger Cars Market Size and Forecast, 2012-2022
4.1.2.1. Revenue (US$ Mn) Comparison, By Region
4.1.2.2. Market Share Comparison, By Region
4.1.2.3. Y-o-Y growth Comparison, By Region
4.1.3. Premium Passenger Cars Market Size and Forecast, 2012-2022
4.1.3.1. Revenue (US$ Mn) Comparison, By Region
4.1.3.2. Market Share Comparison, By Region
4.1.3.3. Y-o-Y growth Comparison, By Region
4.1.4. Luxury Passenger Cars Market Size and Forecast, 2012-2022
4.1.4.1. Revenue (US$ Mn) Comparison, By Region
4.1.4.2. Market Share Comparison, By Region
4.1.4.3. Y-o-Y growth Comparison, By Region
4.1.5. Light Commercial Vehicles Market Size and Forecast, 2012-2022
4.1.5.1. Revenue (US$ Mn) Comparison, By Region
4.1.5.2. Market Share Comparison, By Region
4.1.5.3. Y-o-Y growth Comparison, By Region
4.1.6. Heavy Commercial Vehicles Market Size and Forecast, 2012-2022
4.1.6.1. Revenue (US$ Mn) Comparison, By Region
4.1.6.2. Market Share Comparison, By Region
4.1.6.3. Y-o-Y growth Comparison, By Region
4.1.7. BEV Market Size and Forecast, 2012-2022
4.1.7.1. Revenue (US$ Mn) Comparison, By Region
4.1.7.2. Market Share Comparison, By Region
4.1.7.3. Y-o-Y growth Comparison, By Region
4.1.8. HEV Market Size and Forecast, 2012-2022
4.1.8.1. Revenue (US$ Mn) Comparison, By Region
4.1.8.2. Market Share Comparison, By Region
4.1.8.3. Y-o-Y growth Comparison, By Region
4.1.9. PHEV Market Size and Forecast, 2012-2022
4.1.9.1. Revenue (US$ Mn) Comparison, By Region
4.1.9.2. Market Share Comparison, By Region
4.1.9.3. Y-o-Y growth Comparison, By Region
5. Global Automotive Valves Market Analysis and Forecast By Sales Channel
5.1. Global Automotive Valves Market Size and Forecast By Sales Channel, 2012-2022
5.1.1. OEM Market Size and Forecast, 2012-2022
5.1.1.1. Revenue (US$ Mn) Comparison, By Region
5.1.1.2. Market Share Comparison, By Region
5.1.1.3. Y-o-Y growth Comparison, By Region
5.1.2. Aftermarket Market Size and Forecast, 2012-2022
5.1.2.1. Revenue (US$ Mn) Comparison, By Region
5.1.2.2. Market Share Comparison, By Region
5.1.2.3. Y-o-Y growth Comparison, By Region
6. Global Automotive Valves Market Analysis and Forecast By Function Type
6.1. Global Automotive Valves Market Size and Forecast By Function Type, 2012-2022
6.1.1. Electric Market Size and Forecast, 2012-2022
6.1.1.1. Revenue (US$ Mn) Comparison, By Region
6.1.1.2. Market Share Comparison, By Region
6.1.1.3. Y-o-Y growth Comparison, By Region
6.1.2. Pneumatic Market Size and Forecast, 2012-2022
6.1.2.1. Revenue (US$ Mn) Comparison, By Region
6.1.2.2. Market Share Comparison, By Region
6.1.2.3. Y-o-Y growth Comparison, By Region
6.1.3. Hydraulic Market Size and Forecast, 2012-2022
6.1.3.1. Revenue (US$ Mn) Comparison, By Region
6.1.3.2. Market Share Comparison, By Region
6.1.3.3. Y-o-Y growth Comparison, By Region
6.1.4. Others (Mechanical, Pilot-operated) Market Size and Forecast, 2012-2022
6.1.4.1. Revenue (US$ Mn) Comparison, By Region
6.1.4.2. Market Share Comparison, By Region
6.1.4.3. Y-o-Y growth Comparison, By Region
7. Global Automotive Valves Market Analysis and Forecast By Region
7.1. Global Automotive Valves Market Size and Forecast, 2012-2022
7.1.1. North America Automotive Valves Market Size and Forecast, 2012-2022
7.1.1.1. Revenue (US$ Mn) Comparison, By Product Type
7.1.1.2. Revenue (US$ Mn) Comparison, By Vehicle Type
7.1.1.3. Revenue (US$ Mn) Comparison, By Sales Channel
7.1.1.4. Revenue (US$ Mn) Comparison, By Function Type
7.1.2. Latin America Automotive Valves Market Size and Forecast, 2012-2022
7.1.2.1. Revenue (US$ Mn) Comparison, By Product Type
7.1.2.2. Revenue (US$ Mn) Comparison, By Vehicle Type
7.1.2.3. Revenue (US$ Mn) Comparison, By Sales Channel
7.1.2.4. Revenue (US$ Mn) Comparison, By Function Type
7.1.3. Europe Automotive Valves Market Size and Forecast, 2012-2022
7.1.3.1. Revenue (US$ Mn) Comparison, By Product Type
7.1.3.2. Revenue (US$ Mn) Comparison, By Vehicle Type
7.1.3.3. Revenue (US$ Mn) Comparison, By Sales Channel
7.1.3.4. Revenue (US$ Mn) Comparison, By Function Type
7.1.4. Japan Automotive Valves Market Size and Forecast, 2012-2022
7.1.4.1. Revenue (US$ Mn) Comparison, By Product Type
7.1.4.2. Revenue (US$ Mn) Comparison, By Vehicle Type
7.1.4.3. Revenue (US$ Mn) Comparison, By Sales Channel
7.1.4.4. Revenue (US$ Mn) Comparison, By Function Type
7.1.5. APEJ Automotive Valves Market Size and Forecast, 2012-2022
7.1.5.1. Revenue (US$ Mn) Comparison, By Product Type
7.1.5.2. Revenue (US$ Mn) Comparison, By Vehicle Type
7.1.5.3. Revenue (US$ Mn) Comparison, By Sales Channel
7.1.5.4. Revenue (US$ Mn) Comparison, By Function Type
7.1.6. MEA Automotive Valves Market Size and Forecast, 2012-2022
7.1.6.1. Revenue (US$ Mn) Comparison, By Product Type
7.1.6.2. Revenue (US$ Mn) Comparison, By Vehicle Type
7.1.6.3. Revenue (US$ Mn) Comparison, By Sales Channel
7.1.6.4. Revenue (US$ Mn) Comparison, By Function Type
8. North America Automotive Valves Market Analysis and Forecast, By Country, 2012-2022
8.1. US Automotive Valves Market Size and Forecast, 2012-2022
8.1.1. Revenue (US$ Mn) Comparison, By Product Type
8.1.2. Revenue (US$ Mn) Comparison, By Vehicle Type
8.1.3. Revenue (US$ Mn) Comparison, By Sales Channel
8.1.4. Revenue (US$ Mn) Comparison, By Function Type
8.2. Canada Automotive Valves Market Size and Forecast, 2012-2022
8.2.1. Revenue (US$ Mn) Comparison, By Product Type
8.2.2. Revenue (US$ Mn) Comparison, By Vehicle Type
8.2.3. Revenue (US$ Mn) Comparison, By Sales Channel
8.2.4. Revenue (US$ Mn) Comparison, By Function Type
9. Latin America Automotive Valves Market Analysis and Forecast, By Country, 2012-2022
9.1. Brazil Automotive Valves Market Size and Forecast, 2012-2022
9.1.1. Revenue (US$ Mn) Comparison, By Product Type
9.1.2. Revenue (US$ Mn) Comparison, By Vehicle Type
9.1.3. Revenue (US$ Mn) Comparison, By Sales Channel
9.1.4. Revenue (US$ Mn) Comparison, By Function Type
9.2. Mexico Automotive Valves Market Size and Forecast, 2012-2022
9.2.1. Revenue (US$ Mn) Comparison, By Product Type
9.2.2. Revenue (US$ Mn) Comparison, By Vehicle Type
9.2.3. Revenue (US$ Mn) Comparison, By Sales Channel
9.2.4. Revenue (US$ Mn) Comparison, By Function Type
9.3. Argentina Automotive Valves Market Size and Forecast, 2012-2022
9.3.1. Revenue (US$ Mn) Comparison, By Product Type
9.3.2. Revenue (US$ Mn) Comparison, By Vehicle Type
9.3.3. Revenue (US$ Mn) Comparison, By Sales Channel
9.3.4. Revenue (US$ Mn) Comparison, By Function Type
10. Europe Automotive Valves Market Analysis and Forecast, By Country, 2012-2022
10.1. Germany Automotive Valves Market Size and Forecast, 2012-2022
10.1.1. Revenue (US$ Mn) Comparison, By Product Type
10.1.2. Revenue (US$ Mn) Comparison, By Vehicle Type
10.1.3. Revenue (US$ Mn) Comparison, By Sales Channel
10.1.4. Revenue (US$ Mn) Comparison, By Function Type
10.2. UK Automotive Valves Market Size and Forecast, 2012-2022
10.2.1. Revenue (US$ Mn) Comparison, By Product Type
10.2.2. Revenue (US$ Mn) Comparison, By Vehicle Type
10.2.3. Revenue (US$ Mn) Comparison, By Sales Channel
10.2.4. Revenue (US$ Mn) Comparison, By Function Type
10.3. France Automotive Valves Market Size and Forecast, 2012-2022
10.3.1. Revenue (US$ Mn) Comparison, By Product Type
10.3.2. Revenue (US$ Mn) Comparison, By Vehicle Type
10.3.3. Revenue (US$ Mn) Comparison, By Sales Channel
10.3.4. Revenue (US$ Mn) Comparison, By Function Type
10.4. Spain Automotive Valves Market Size and Forecast, 2012-2022
10.4.1. Revenue (US$ Mn) Comparison, By Product Type
10.4.2. Revenue (US$ Mn) Comparison, By Vehicle Type
10.4.3. Revenue (US$ Mn) Comparison, By Sales Channel
10.4.4. Revenue (US$ Mn) Comparison, By Function Type
10.5. Italy Automotive Valves Market Size and Forecast, 2012-2022
10.5.1. Revenue (US$ Mn) Comparison, By Product Type
10.5.2. Revenue (US$ Mn) Comparison, By Vehicle Type
10.5.3. Revenue (US$ Mn) Comparison, By Sales Channel
10.5.4. Revenue (US$ Mn) Comparison, By Function Type
10.6. Nordic Automotive Valves Market Size and Forecast, 2012-2022
10.6.1. Revenue (US$ Mn) Comparison, By Product Type
10.6.2. Revenue (US$ Mn) Comparison, By Vehicle Type
10.6.3. Revenue (US$ Mn) Comparison, By Sales Channel
10.6.4. Revenue (US$ Mn) Comparison, By Function Type
11. Japan Automotive Valves Market Analysis and Forecast, By Country, 2012-2022
11.1. Japan Automotive Valves Market Size and Forecast, 2012-2022
11.1.1. Revenue (US$ Mn) Comparison, By Product Type
11.1.2. Revenue (US$ Mn) Comparison, By Vehicle Type
11.1.3. Revenue (US$ Mn) Comparison, By Sales Channel
11.1.4. Revenue (US$ Mn) Comparison, By Function Type
12. APEJ Automotive Valves Market Analysis and Forecast, By Country, 2012-2022
12.1. China Automotive Valves Market Size and Forecast, 2012-2022
12.1.1. Revenue (US$ Mn) Comparison, By Product Type
12.1.2. Revenue (US$ Mn) Comparison, By Vehicle Type
12.1.3. Revenue (US$ Mn) Comparison, By Sales Channel
12.1.4. Revenue (US$ Mn) Comparison, By Function Type
12.2. India Automotive Valves Market Size and Forecast, 2012-2022
12.2.1. Revenue (US$ Mn) Comparison, By Product Type
12.2.2. Revenue (US$ Mn) Comparison, By Vehicle Type
12.2.3. Revenue (US$ Mn) Comparison, By Sales Channel
12.2.4. Revenue (US$ Mn) Comparison, By Function Type
12.3. Malaysia Automotive Valves Market Size and Forecast, 2012-2022
12.3.1. Revenue (US$ Mn) Comparison, By Product Type
12.3.2. Revenue (US$ Mn) Comparison, By Vehicle Type
12.3.3. Revenue (US$ Mn) Comparison, By Sales Channel
12.3.4. Revenue (US$ Mn) Comparison, By Function Type
12.4. Thailand Automotive Valves Market Size and Forecast, 2012-2022
12.4.1. Revenue (US$ Mn) Comparison, By Product Type
12.4.2. Revenue (US$ Mn) Comparison, By Vehicle Type
12.4.3. Revenue (US$ Mn) Comparison, By Sales Channel
12.4.4. Revenue (US$ Mn) Comparison, By Function Type
12.5. Singapore Automotive Valves Market Size and Forecast, 2012-2022
12.5.1. Revenue (US$ Mn) Comparison, By Product Type
12.5.2. Revenue (US$ Mn) Comparison, By Vehicle Type
12.5.3. Revenue (US$ Mn) Comparison, By Sales Channel
12.5.4. Revenue (US$ Mn) Comparison, By Function Type
12.6. Australia Automotive Valves Market Size and Forecast, 2012-2022
12.6.1. Revenue (US$ Mn) Comparison, By Product Type
12.6.2. Revenue (US$ Mn) Comparison, By Vehicle Type
12.6.3. Revenue (US$ Mn) Comparison, By Sales Channel
12.6.4. Revenue (US$ Mn) Comparison, By Function Type
13. MEA Automotive Valves Market Analysis and Forecast, By Country, 2012-2022
13.1. GCC Countries Automotive Valves Market Size and Forecast, 2012-2022
13.1.1. Revenue (US$ Mn) Comparison, By Product Type
13.1.2. Revenue (US$ Mn) Comparison, By Vehicle Type
13.1.3. Revenue (US$ Mn) Comparison, By Sales Channel
13.1.4. Revenue (US$ Mn) Comparison, By Function Type
13.2. South Africa Automotive Valves Market Size and Forecast, 2012-2022
13.2.1. Revenue (US$ Mn) Comparison, By Product Type
13.2.2. Revenue (US$ Mn) Comparison, By Vehicle Type
13.2.3. Revenue (US$ Mn) Comparison, By Sales Channel
13.2.4. Revenue (US$ Mn) Comparison, By Function Type
13.3. Nigeria Automotive Valves Market Size and Forecast, 2012-2022
13.3.1. Revenue (US$ Mn) Comparison, By Product Type
13.3.2. Revenue (US$ Mn) Comparison, By Vehicle Type
13.3.3. Revenue (US$ Mn) Comparison, By Sales Channel
13.3.4. Revenue (US$ Mn) Comparison, By Function Type
13.4. Israel Automotive Valves Market Size and Forecast, 2012-2022
13.4.1. Revenue (US$ Mn) Comparison, By Product Type
13.4.2. Revenue (US$ Mn) Comparison, By Vehicle Type
13.4.3. Revenue (US$ Mn) Comparison, By Sales Channel
13.4.4. Revenue (US$ Mn) Comparison, By Function Type
14. Global Automotive Valves Market Company Share, Competition Landscape and Company Profiles
14.1. Company Share Analysis
14.2. Competition Landscape
14.3. Company Profiles
14.3.1. Continental AG
14.3.2. Delphi Automotive
14.3.3. Hitachi Ltd.
14.3.4. Denso Corporation
14.3.5. Federal-Mogul LLC
14.3.6. Eaton
14.3.7. FTE Automotive
14.3.8. MAHLE GmbH
14.3.9. FUJI OOZX Inc.
14.3.10. Knorr Bremse AG
15. Research Methodology
16. Secondary and Primary Sources
17. Assumptions and Acronyms
18. Disclaimer+A257A242A1:A288
List of Tables
TABLE 1 Global Automotive Valves Market Value (US$ Mn), 2012-2016
TABLE 2 Global Automotive Valves Market Value (US$ Mn), 2017-2022
TABLE 3 Global Automotive Valves Market Value (US$ Mn) and Y-o-Y, 2015-2022
TABLE 4 Global Engine (inlet and outlet) valves Segment Value (US$ Mn), By Region 2012-2016
TABLE 5 Global Engine (inlet and outlet) valves Segment Value (US$ Mn), By Region 2017-2022
TABLE 6 Global Engine (inlet and outlet) valves Segment Market Share, By Region 2012-2016
TABLE 7 Global Engine (inlet and outlet) valves Segment Market Share, By Region 2017-2022
TABLE 8 Global Engine (inlet and outlet) valves Segment Y-o-Y, By Region 2015-2022
TABLE 9 Global A/c valve Segment Value (US$ Mn), By Region 2012-2016
TABLE 10 Global A/c valve Segment Value (US$ Mn), By Region 2017-2022
TABLE 11 Global A/c valve Segment Market Share, By Region 2012-2016
TABLE 12 Global A/c valve Segment Market Share, By Region 2017-2022
TABLE 13 Global A/c valve Segment Y-o-Y, By Region 2015-2022
TABLE 14 Global Brake valve Segment Value (US$ Mn), By Region 2012-2016
TABLE 15 Global Brake valve Segment Value (US$ Mn), By Region 2017-2022
TABLE 16 Global Brake valve Segment Market Share, By Region 2012-2016
TABLE 17 Global Brake valve Segment Market Share, By Region 2017-2022
TABLE 18 Global Brake valve Segment Y-o-Y, By Region 2015-2022
TABLE 19 Global Thermostat valve Segment Value (US$ Mn), By Region 2012-2016
TABLE 20 Global Thermostat valve Segment Value (US$ Mn), By Region 2017-2022
TABLE 21 Global Thermostat valve Segment Market Share, By Region 2012-2016
TABLE 22 Global Thermostat valve Segment Market Share, By Region 2017-2022
TABLE 23 Global Thermostat valve Segment Y-o-Y, By Region 2015-2022
TABLE 24 Global Fuel system valve Segment Value (US$ Mn), By Region 2012-2016
TABLE 25 Global Fuel system valve Segment Value (US$ Mn), By Region 2017-2022
TABLE 26 Global Fuel system valve Segment Market Share, By Region 2012-2016
TABLE 27 Global Fuel system valve Segment Market Share, By Region 2017-2022
TABLE 28 Global Fuel system valve Segment Y-o-Y, By Region 2015-2022
TABLE 29 Global Solenoid valve Segment Value (US$ Mn), By Region 2012-2016
TABLE 30 Global Solenoid valve Segment Value (US$ Mn), By Region 2017-2022
TABLE 31 Global Solenoid valve Segment Market Share, By Region 2012-2016
TABLE 32 Global Solenoid valve Segment Market Share, By Region 2017-2022
TABLE 33 Global Solenoid valve Segment Y-o-Y, By Region 2015-2022
TABLE 34 Global Exhaust gas recirculation valve Segment Value (US$ Mn), By Region 2012-2016
TABLE 35 Global Exhaust gas recirculation valve Segment Value (US$ Mn), By Region 2017-2022
TABLE 36 Global Exhaust gas recirculation valve Segment Market Share, By Region 2012-2016
TABLE 37 Global Exhaust gas recirculation valve Segment Market Share, By Region 2017-2022
TABLE 38 Global Exhaust gas recirculation valve Segment Y-o-Y, By Region 2015-2022
TABLE 39 Global Tire valve Segment Value (US$ Mn), By Region 2012-2016
TABLE 40 Global Tire valve Segment Value (US$ Mn), By Region 2017-2022
TABLE 41 Global Tire valve Segment Market Share, By Region 2012-2016
TABLE 42 Global Tire valve Segment Market Share, By Region 2017-2022
TABLE 43 Global Tire valve Segment Y-o-Y, By Region 2015-2022
TABLE 44 Global Water valve Segment Value (US$ Mn), By Region 2012-2016
TABLE 45 Global Water valve Segment Value (US$ Mn), By Region 2017-2022
TABLE 46 Global Water valve Segment Market Share, By Region 2012-2016
TABLE 47 Global Water valve Segment Market Share, By Region 2017-2022
TABLE 48 Global Water valve Segment Y-o-Y, By Region 2015-2022
TABLE 49 Global AT control valve Segment Value (US$ Mn), By Region 2012-2016
TABLE 50 Global AT control valve Segment Value (US$ Mn), By Region 2017-2022
TABLE 51 Global AT control valve Segment Market Share, By Region 2012-2016
TABLE 52 Global AT control valve Segment Market Share, By Region 2017-2022
TABLE 53 Global AT control valve Segment Y-o-Y, By Region 2015-2022
TABLE 54 Global Compact Passenger Cars Segment Value (US$ Mn), By Region 2012-2016
TABLE 55 Global Compact Passenger Cars Segment Value (US$ Mn), By Region 2017-2022
TABLE 56 Global Compact Passenger Cars Segment Market Share, By Region 2012-2016
TABLE 57 Global Compact Passenger Cars Segment Market Share, By Region 2017-2022
TABLE 58 Global Compact Passenger Cars Segment Y-o-Y, By Region 2015-2022
TABLE 59 Global Mid-sized Passenger Cars Segment Value (US$ Mn), By Region 2012-2016
TABLE 60 Global Mid-sized Passenger Cars Segment Value (US$ Mn), By Region 2017-2022
TABLE 61 Global Mid-sized Passenger Cars Segment Market Share, By Region 2012-2016
TABLE 62 Global Mid-sized Passenger Cars Segment Market Share, By Region 2017-2022
TABLE 63 Global Mid-sized Passenger Cars Segment Y-o-Y, By Region 2015-2022
TABLE 64 Global Premium Passenger Cars Segment Value (US$ Mn), By Region 2012-2016
TABLE 65 Global Premium Passenger Cars Segment Value (US$ Mn), By Region 2017-2022
TABLE 66 Global Premium Passenger Cars Segment Market Share, By Region 2012-2016
TABLE 67 Global Premium Passenger Cars Segment Market Share, By Region 2017-2022
TABLE 68 Global Premium Passenger Cars Segment Y-o-Y, By Region 2015-2022
TABLE 69 Global Luxury Passenger Cars Segment Value (US$ Mn), By Region 2012-2016
TABLE 70 Global Luxury Passenger Cars Segment Value (US$ Mn), By Region 2017-2022
TABLE 71 Global Luxury Passenger Cars Segment Market Share, By Region 2012-2016
TABLE 72 Global Luxury Passenger Cars Segment Market Share, By Region 2017-2022
TABLE 73 Global Luxury Passenger Cars Segment Y-o-Y, By Region 2015-2022
TABLE 74 Global Light Commercial Vehicles Segment Value (US$ Mn), By Region 2012-2016
TABLE 75 Global Light Commercial Vehicles Segment Value (US$ Mn), By Region 2017-2022
TABLE 76 Global Light Commercial Vehicles Segment Market Share, By Region 2012-2016
TABLE 77 Global Light Commercial Vehicles Segment Market Share, By Region 2017-2022
TABLE 78 Global Light Commercial Vehicles Segment Y-o-Y, By Region 2015-2022
TABLE 79 Global Heavy Commercial Vehicles Segment Value (US$ Mn), By Region 2012-2016
TABLE 80 Global Heavy Commercial Vehicles Segment Value (US$ Mn), By Region 2017-2022
TABLE 81 Global Heavy Commercial Vehicles Segment Market Share, By Region 2012-2016
TABLE 82 Global Heavy Commercial Vehicles Segment Market Share, By Region 2017-2022
TABLE 83 Global Heavy Commercial Vehicles Segment Y-o-Y, By Region 2015-2022
TABLE 84 Global BEV Segment Value (US$ Mn), By Region 2012-2016
TABLE 85 Global BEV Segment Value (US$ Mn), By Region 2017-2022
TABLE 86 Global BEV Segment Market Share, By Region 2012-2016
TABLE 87 Global BEV Segment Market Share, By Region 2017-2022
TABLE 88 Global BEV Segment Y-o-Y, By Region 2015-2022
TABLE 89 Global HEV Segment Value (US$ Mn), By Region 2012-2016
TABLE 90 Global HEV Segment Value (US$ Mn), By Region 2017-2022
TABLE 91 Global HEV Segment Market Share, By Region 2012-2016
TABLE 92 Global HEV Segment Market Share, By Region 2017-2022
TABLE 93 Global HEV Segment Y-o-Y, By Region 2015-2022
TABLE 94 Global PHEV Segment Value (US$ Mn), By Region 2012-2016
TABLE 95 Global PHEV Segment Value (US$ Mn), By Region 2017-2022
TABLE 96 Global PHEV Segment Market Share, By Region 2012-2016
TABLE 97 Global PHEV Segment Market Share, By Region 2017-2022
TABLE 98 Global PHEV Segment Y-o-Y, By Region 2015-2022
TABLE 99 Global OEM Segment Value (US$ Mn), By Region 2012-2016
TABLE 100 Global OEM Segment Value (US$ Mn), By Region 2017-2022
TABLE 101 Global OEM Segment Market Share, By Region 2012-2016
TABLE 102 Global OEM Segment Market Share, By Region 2017-2022
TABLE 103 Global OEM Segment Y-o-Y, By Region 2015-2022
TABLE 104 Global Aftermarket Segment Value (US$ Mn), By Region 2012-2016
TABLE 105 Global Aftermarket Segment Value (US$ Mn), By Region 2017-2022
TABLE 106 Global Aftermarket Segment Market Share, By Region 2012-2016
TABLE 107 Global Aftermarket Segment Market Share, By Region 2017-2022
TABLE 108 Global Aftermarket Segment Y-o-Y, By Region 2015-2022
TABLE 109 Global Electric Segment Value (US$ Mn), By Region 2012-2016
TABLE 110 Global Electric Segment Value (US$ Mn), By Region 2017-2022
TABLE 111 Global Electric Segment Market Share, By Region 2012-2016
TABLE 112 Global Electric Segment Market Share, By Region 2017-2022
TABLE 113 Global Electric Segment Y-o-Y, By Region 2015-2022
TABLE 114 Global Pneumatic Segment Value (US$ Mn), By Region 2012-2016
TABLE 115 Global Pneumatic Segment Value (US$ Mn), By Region 2017-2022
TABLE 116 Global Pneumatic Segment Market Share, By Region 2012-2016
TABLE 117 Global Pneumatic Segment Market Share, By Region 2017-2022
TABLE 118 Global Pneumatic Segment Y-o-Y, By Region 2015-2022
TABLE 119 Global Hydraulic Segment Value (US$ Mn), By Region 2012-2016
TABLE 120 Global Hydraulic Segment Value (US$ Mn), By Region 2017-2022
TABLE 121 Global Hydraulic Segment Market Share, By Region 2012-2016
TABLE 122 Global Hydraulic Segment Market Share, By Region 2017-2022
TABLE 123 Global Hydraulic Segment Y-o-Y, By Region 2015-2022
TABLE 124 Global Others (Mechanical, Pilot-operated) Segment Value (US$ Mn), By Region 2012-2016
TABLE 125 Global Others (Mechanical, Pilot-operated) Segment Value (US$ Mn), By Region 2017-2022
TABLE 126 Global Others (Mechanical, Pilot-operated) Segment Market Share, By Region 2012-2016
TABLE 127 Global Others (Mechanical, Pilot-operated) Segment Market Share, By Region 2017-2022
TABLE 128 Global Others (Mechanical, Pilot-operated) Segment Y-o-Y, By Region 2015-2022
TABLE 129 North America Automotive Valves Market Value (US$ Mn), By Product Type 2012-2016
TABLE 130 North America Automotive Valves Market Value (US$ Mn), By Product Type 2017-2022
TABLE 131 North America Automotive Valves Market Value (US$ Mn), By Vehicle Type 2012-2016
TABLE 132 North America Automotive Valves Market Value (US$ Mn), By Vehicle Type 2017-2022
TABLE 133 North America Automotive Valves Market Value (US$ Mn), By Sales Channel 2012-2016
TABLE 134 North America Automotive Valves Market Value (US$ Mn), By Sales Channel 2017-2022
TABLE 135 North America Automotive Valves Market Value (US$ Mn), By Function Type 2012-2016
TABLE 136 North America Automotive Valves Market Value (US$ Mn), By Function Type 2017-2022
TABLE 137 Latin America Automotive Valves Market Value (US$ Mn), By Product Type 2012-2016
TABLE 138 Latin America Automotive Valves Market Value (US$ Mn), By Product Type 2017-2022
TABLE 139 Latin America Automotive Valves Market Value (US$ Mn), By Vehicle Type 2012-2016
TABLE 140 Latin America Automotive Valves Market Value (US$ Mn), By Vehicle Type 2017-2022
TABLE 141 Latin America Automotive Valves Market Value (US$ Mn), By Sales Channel 2012-2016
TABLE 142 Latin America Automotive Valves Market Value (US$ Mn), By Sales Channel 2017-2022
TABLE 143 Latin America Automotive Valves Market Value (US$ Mn), By Function Type 2012-2016
TABLE 144 Latin America Automotive Valves Market Value (US$ Mn), By Function Type 2017-2022
TABLE 145 Europe Automotive Valves Market Value (US$ Mn), By Product Type 2012-2016
TABLE 146 Europe Automotive Valves Market Value (US$ Mn), By Product Type 2017-2022
TABLE 147 Europe Automotive Valves Market Value (US$ Mn), By Vehicle Type 2012-2016
TABLE 148 Europe Automotive Valves Market Value (US$ Mn), By Vehicle Type 2017-2022
TABLE 149 Europe Automotive Valves Market Value (US$ Mn), By Sales Channel 2012-2016
TABLE 150 Europe Automotive Valves Market Value (US$ Mn), By Sales Channel 2017-2022
TABLE 151 Europe Automotive Valves Market Value (US$ Mn), By Function Type 2012-2016
TABLE 152 Europe Automotive Valves Market Value (US$ Mn), By Function Type 2017-2022
TABLE 153 Japan Automotive Valves Market Value (US$ Mn), By Product Type 2012-2016
TABLE 154 Japan Automotive Valves Market Value (US$ Mn), By Product Type 2017-2022
TABLE 155 Japan Automotive Valves Market Value (US$ Mn), By Vehicle Type 2012-2016
TABLE 156 Japan Automotive Valves Market Value (US$ Mn), By Vehicle Type 2017-2022
TABLE 157 Japan Automotive Valves Market Value (US$ Mn), By Sales Channel 2012-2016
TABLE 158 Japan Automotive Valves Market Value (US$ Mn), By Sales Channel 2017-2022
TABLE 159 Japan Automotive Valves Market Value (US$ Mn), By Function Type 2012-2016
TABLE 160 Japan Automotive Valves Market Value (US$ Mn), By Function Type 2017-2022
TABLE 161 APEJ Automotive Valves Market Value (US$ Mn), By Product Type 2012-2016
TABLE 162 APEJ Automotive Valves Market Value (US$ Mn), By Product Type 2017-2022
TABLE 163 APEJ Automotive Valves Market Value (US$ Mn), By Vehicle Type 2012-2016
TABLE 164 APEJ Automotive Valves Market Value (US$ Mn), By Vehicle Type 2017-2022
TABLE 165 APEJ Automotive Valves Market Value (US$ Mn), By Sales Channel 2012-2016
TABLE 166 APEJ Automotive Valves Market Value (US$ Mn), By Sales Channel 2017-2022
TABLE 167 APEJ Automotive Valves Market Value (US$ Mn), By Function Type 2012-2016
TABLE 168 APEJ Automotive Valves Market Value (US$ Mn), By Function Type 2017-2022
TABLE 169 MEA Automotive Valves Market Value (US$ Mn), By Product Type 2012-2016
TABLE 170 MEA Automotive Valves Market Value (US$ Mn), By Product Type 2017-2022
TABLE 171 MEA Automotive Valves Market Value (US$ Mn), By Vehicle Type 2012-2016
TABLE 172 MEA Automotive Valves Market Value (US$ Mn), By Vehicle Type 2017-2022
TABLE 173 MEA Automotive Valves Market Value (US$ Mn), By Sales Channel 2012-2016
TABLE 174 MEA Automotive Valves Market Value (US$ Mn), By Sales Channel 2017-2022
TABLE 175 MEA Automotive Valves Market Value (US$ Mn), By Function Type 2012-2016
TABLE 176 MEA Automotive Valves Market Value (US$ Mn), By Function Type 2017-2022
TABLE 177 US Automotive Valves Market Value (US$ Mn), By Product Type 2012-2016
TABLE 178 US Automotive Valves Market Value (US$ Mn), By Product Type 2017-2022
TABLE 179 US Automotive Valves Market Value (US$ Mn), By Vehicle Type 2012-2016
TABLE 180 US Automotive Valves Market Value (US$ Mn), By Vehicle Type 2017-2022
TABLE 181 US Automotive Valves Market Value (US$ Mn), By Sales Channel 2012-2016
TABLE 182 US Automotive Valves Market Value (US$ Mn), By Sales Channel 2017-2022
TABLE 183 US Automotive Valves Market Value (US$ Mn), By Function Type 2012-2016
TABLE 184 US Automotive Valves Market Value (US$ Mn), By Function Type 2017-2022
TABLE 185 Canada Automotive Valves Market Value (US$ Mn), By Product Type 2012-2016
TABLE 186 Canada Automotive Valves Market Value (US$ Mn), By Product Type 2017-2022
TABLE 187 Canada Automotive Valves Market Value (US$ Mn), By Vehicle Type 2012-2016
TABLE 188 Canada Automotive Valves Market Value (US$ Mn), By Vehicle Type 2017-2022
TABLE 189 Canada Automotive Valves Market Value (US$ Mn), By Sales Channel 2012-2016
TABLE 190 Canada Automotive Valves Market Value (US$ Mn), By Sales Channel 2017-2022
TABLE 191 Canada Automotive Valves Market Value (US$ Mn), By Function Type 2012-2016
TABLE 192 Canada Automotive Valves Market Value (US$ Mn), By Function Type 2017-2022
TABLE 193 Brazil Automotive Valves Market Value (US$ Mn), By Product Type 2012-2016
TABLE 194 Brazil Automotive Valves Market Value (US$ Mn), By Product Type 2017-2022
TABLE 195 Brazil Automotive Valves Market Value (US$ Mn), By Vehicle Type 2012-2016
TABLE 196 Brazil Automotive Valves Market Value (US$ Mn), By Vehicle Type 2017-2022
TABLE 197 Brazil Automotive Valves Market Value (US$ Mn), By Sales Channel 2012-2016
TABLE 198 Brazil Automotive Valves Market Value (US$ Mn), By Sales Channel 2017-2022
TABLE 199 Brazil Automotive Valves Market Value (US$ Mn), By Function Type 2012-2016
TABLE 200 Brazil Automotive Valves Market Value (US$ Mn), By Function Type 2017-2022
TABLE 201 Mexico Automotive Valves Market Value (US$ Mn), By Product Type 2012-2016
TABLE 202 Mexico Automotive Valves Market Value (US$ Mn), By Product Type 2017-2022
TABLE 203 Mexico Automotive Valves Market Value (US$ Mn), By Vehicle Type 2012-2016
TABLE 204 Mexico Automotive Valves Market Value (US$ Mn), By Vehicle Type 2017-2022
TABLE 205 Mexico Automotive Valves Market Value (US$ Mn), By Sales Channel 2012-2016
TABLE 206 Mexico Automotive Valves Market Value (US$ Mn), By Sales Channel 2017-2022
TABLE 207 Mexico Automotive Valves Market Value (US$ Mn), By Function Type 2012-2016
TABLE 208 Mexico Automotive Valves Market Value (US$ Mn), By Function Type 2017-2022
TABLE 209 Argentina Automotive Valves Market Value (US$ Mn), By Product Type 2012-2016
TABLE 210 Argentina Automotive Valves Market Value (US$ Mn), By Product Type 2017-2022
TABLE 211 Argentina Automotive Valves Market Value (US$ Mn), By Vehicle Type 2012-2016
TABLE 212 Argentina Automotive Valves Market Value (US$ Mn), By Vehicle Type 2017-2022
TABLE 213 Argentina Automotive Valves Market Value (US$ Mn), By Sales Channel 2012-2016
TABLE 214 Argentina Automotive Valves Market Value (US$ Mn), By Sales Channel 2017-2022
TABLE 215 Argentina Automotive Valves Market Value (US$ Mn), By Function Type 2012-2016
TABLE 216 Argentina Automotive Valves Market Value (US$ Mn), By Function Type 2017-2022
TABLE 217 Germany Automotive Valves Market Value (US$ Mn), By Product Type 2012-2016
TABLE 218 Germany Automotive Valves Market Value (US$ Mn), By Product Type 2017-2022
TABLE 219 Germany Automotive Valves Market Value (US$ Mn), By Vehicle Type 2012-2016
TABLE 220 Germany Automotive Valves Market Value (US$ Mn), By Vehicle Type 2017-2022
TABLE 221 Germany Automotive Valves Market Value (US$ Mn), By Sales Channel 2012-2016
TABLE 222 Germany Automotive Valves Market Value (US$ Mn), By Sales Channel 2017-2022
TABLE 223 Germany Automotive Valves Market Value (US$ Mn), By Function Type 2012-2016
TABLE 224 Germany Automotive Valves Market Value (US$ Mn), By Function Type 2017-2022
TABLE 225 UK Automotive Valves Market Value (US$ Mn), By Product Type 2012-2016
TABLE 226 UK Automotive Valves Market Value (US$ Mn), By Product Type 2017-2022
TABLE 227 UK Automotive Valves Market Value (US$ Mn), By Vehicle Type 2012-2016
TABLE 228 UK Automotive Valves Market Value (US$ Mn), By Vehicle Type 2017-2022
TABLE 229 UK Automotive Valves Market Value (US$ Mn), By Sales Channel 2012-2016
TABLE 230 UK Automotive Valves Market Value (US$ Mn), By Sales Channel 2017-2022
TABLE 231 UK Automotive Valves Market Value (US$ Mn), By Function Type 2012-2016
TABLE 232 UK Automotive Valves Market Value (US$ Mn), By Function Type 2017-2022
TABLE 233 France Automotive Valves Market Value (US$ Mn), By Product Type 2012-2016
TABLE 234 France Automotive Valves Market Value (US$ Mn), By Product Type 2017-2022
TABLE 235 France Automotive Valves Market Value (US$ Mn), By Vehicle Type 2012-2016
TABLE 236 France Automotive Valves Market Value (US$ Mn), By Vehicle Type 2017-2022
TABLE 237 France Automotive Valves Market Value (US$ Mn), By Sales Channel 2012-2016
TABLE 238 France Automotive Valves Market Value (US$ Mn), By Sales Channel 2017-2022
TABLE 239 France Automotive Valves Market Value (US$ Mn), By Function Type 2012-2016
TABLE 240 France Automotive Valves Market Value (US$ Mn), By Function Type 2017-2022
TABLE 241 Spain Automotive Valves Market Value (US$ Mn), By Product Type 2012-2016
TABLE 242 Spain Automotive Valves Market Value (US$ Mn), By Product Type 2017-2022
TABLE 243 Spain Automotive Valves Market Value (US$ Mn), By Vehicle Type 2012-2016
TABLE 244 Spain Automotive Valves Market Value (US$ Mn), By Vehicle Type 2017-2022
TABLE 245 Spain Automotive Valves Market Value (US$ Mn), By Sales Channel 2012-2016
TABLE 246 Spain Automotive Valves Market Value (US$ Mn), By Sales Channel 2017-2022
TABLE 247 Spain Automotive Valves Market Value (US$ Mn), By Function Type 2012-2016
TABLE 248 Spain Automotive Valves Market Value (US$ Mn), By Function Type 2017-2022
TABLE 249 Italy Automotive Valves Market Value (US$ Mn), By Product Type 2012-2016
TABLE 250 Italy Automotive Valves Market Value (US$ Mn), By Product Type 2017-2022
TABLE 251 Italy Automotive Valves Market Value (US$ Mn), By Vehicle Type 2012-2016
TABLE 252 Italy Automotive Valves Market Value (US$ Mn), By Vehicle Type 2017-2022
TABLE 253 Italy Automotive Valves Market Value (US$ Mn), By Sales Channel 2012-2016
TABLE 254 Italy Automotive Valves Market Value (US$ Mn), By Sales Channel 2017-2022
TABLE 255 Italy Automotive Valves Market Value (US$ Mn), By Function Type 2012-2016
TABLE 256 Italy Automotive Valves Market Value (US$ Mn), By Function Type 2017-2022
TABLE 257 Nordic Automotive Valves Market Value (US$ Mn), By Product Type 2012-2016
TABLE 258 Nordic Automotive Valves Market Value (US$ Mn), By Product Type 2017-2022
TABLE 259 Nordic Automotive Valves Market Value (US$ Mn), By Vehicle Type 2012-2016
TABLE 260 Nordic Automotive Valves Market Value (US$ Mn), By Vehicle Type 2017-2022
TABLE 261 Nordic Automotive Valves Market Value (US$ Mn), By Sales Channel 2012-2016
TABLE 262 Nordic Automotive Valves Market Value (US$ Mn), By Sales Channel 2017-2022
TABLE 263 Nordic Automotive Valves Market Value (US$ Mn), By Function Type 2012-2016
TABLE 264 Nordic Automotive Valves Market Value (US$ Mn), By Function Type 2017-2022
TABLE 265 Japan Automotive Valves Market Value (US$ Mn), By Product Type 2012-2016
TABLE 266 Japan Automotive Valves Market Value (US$ Mn), By Product Type 2017-2022
TABLE 267 Japan Automotive Valves Market Value (US$ Mn), By Vehicle Type 2012-2016
TABLE 268 Japan Automotive Valves Market Value (US$ Mn), By Vehicle Type 2017-2022
TABLE 269 Japan Automotive Valves Market Value (US$ Mn), By Sales Channel 2012-2016
TABLE 270 Japan Automotive Valves Market Value (US$ Mn), By Sales Channel 2017-2022
TABLE 271 Japan Automotive Valves Market Value (US$ Mn), By Function Type 2012-2016
TABLE 272 Japan Automotive Valves Market Value (US$ Mn), By Function Type 2017-2022
TABLE 273 China Automotive Valves Market Value (US$ Mn), By Product Type 2012-2016
TABLE 274 China Automotive Valves Market Value (US$ Mn), By Product Type 2017-2022
TABLE 275 China Automotive Valves Market Value (US$ Mn), By Vehicle Type 2012-2016
TABLE 276 China Automotive Valves Market Value (US$ Mn), By Vehicle Type 2017-2022
TABLE 277 China Automotive Valves Market Value (US$ Mn), By Sales Channel 2012-2016
TABLE 278 China Automotive Valves Market Value (US$ Mn), By Sales Channel 2017-2022
TABLE 279 China Automotive Valves Market Value (US$ Mn), By Function Type 2012-2016
TABLE 280 China Automotive Valves Market Value (US$ Mn), By Function Type 2017-2022
TABLE 281 India Automotive Valves Market Value (US$ Mn), By Product Type 2012-2016
TABLE 282 India Automotive Valves Market Value (US$ Mn), By Product Type 2017-2022
TABLE 283 India Automotive Valves Market Value (US$ Mn), By Vehicle Type 2012-2016
TABLE 284 India Automotive Valves Market Value (US$ Mn), By Vehicle Type 2017-2022
TABLE 285 India Automotive Valves Market Value (US$ Mn), By Sales Channel 2012-2016
TABLE 286 India Automotive Valves Market Value (US$ Mn), By Sales Channel 2017-2022
TABLE 287 India Automotive Valves Market Value (US$ Mn), By Function Type 2012-2016
TABLE 288 India Automotive Valves Market Value (US$ Mn), By Function Type 2017-2022
TABLE 289 Malaysia Automotive Valves Market Value (US$ Mn), By Product Type 2012-2016
TABLE 290 Malaysia Automotive Valves Market Value (US$ Mn), By Product Type 2017-2022
TABLE 291 Malaysia Automotive Valves Market Value (US$ Mn), By Vehicle Type 2012-2016
TABLE 292 Malaysia Automotive Valves Market Value (US$ Mn), By Vehicle Type 2017-2022
TABLE 293 Malaysia Automotive Valves Market Value (US$ Mn), By Sales Channel 2012-2016
TABLE 294 Malaysia Automotive Valves Market Value (US$ Mn), By Sales Channel 2017-2022
TABLE 295 Malaysia Automotive Valves Market Value (US$ Mn), By Function Type 2012-2016
TABLE 296 Malaysia Automotive Valves Market Value (US$ Mn), By Function Type 2017-2022
TABLE 297 Thailand Automotive Valves Market Value (US$ Mn), By Product Type 2012-2016
TABLE 298 Thailand Automotive Valves Market Value (US$ Mn), By Product Type 2017-2022
TABLE 299 Thailand Automotive Valves Market Value (US$ Mn), By Vehicle Type 2012-2016
TABLE 300 Thailand Automotive Valves Market Value (US$ Mn), By Vehicle Type 2017-2022
TABLE 301 Thailand Automotive Valves Market Value (US$ Mn), By Sales Channel 2012-2016
TABLE 302 Thailand Automotive Valves Market Value (US$ Mn), By Sales Channel 2017-2022
TABLE 303 Thailand Automotive Valves Market Value (US$ Mn), By Function Type 2012-2016
TABLE 304 Thailand Automotive Valves Market Value (US$ Mn), By Function Type 2017-2022
TABLE 305 Singapore Automotive Valves Market Value (US$ Mn), By Product Type 2012-2016
TABLE 306 Singapore Automotive Valves Market Value (US$ Mn), By Product Type 2017-2022
TABLE 307 Singapore Automotive Valves Market Value (US$ Mn), By Vehicle Type 2012-2016
TABLE 308 Singapore Automotive Valves Market Value (US$ Mn), By Vehicle Type 2017-2022
TABLE 309 Singapore Automotive Valves Market Value (US$ Mn), By Sales Channel 2012-2016
TABLE 310 Singapore Automotive Valves Market Value (US$ Mn), By Sales Channel 2017-2022
TABLE 311 Singapore Automotive Valves Market Value (US$ Mn), By Function Type 2012-2016
TABLE 312 Singapore Automotive Valves Market Value (US$ Mn), By Function Type 2017-2022
TABLE 313 Australia Automotive Valves Market Value (US$ Mn), By Product Type 2012-2016
TABLE 314 Australia Automotive Valves Market Value (US$ Mn), By Product Type 2017-2022
TABLE 315 Australia Automotive Valves Market Value (US$ Mn), By Vehicle Type 2012-2016
TABLE 316 Australia Automotive Valves Market Value (US$ Mn), By Vehicle Type 2017-2022
TABLE 317 Australia Automotive Valves Market Value (US$ Mn), By Sales Channel 2012-2016
TABLE 318 Australia Automotive Valves Market Value (US$ Mn), By Sales Channel 2017-2022
TABLE 319 Australia Automotive Valves Market Value (US$ Mn), By Function Type 2012-2016
TABLE 320 Australia Automotive Valves Market Value (US$ Mn), By Function Type 2017-2022
TABLE 321 GCC Countries Automotive Valves Market Value (US$ Mn), By Product Type 2012-2016
TABLE 322 GCC Countries Automotive Valves Market Value (US$ Mn), By Product Type 2017-2022
TABLE 323 GCC Countries Automotive Valves Market Value (US$ Mn), By Vehicle Type 2012-2016
TABLE 324 GCC Countries Automotive Valves Market Value (US$ Mn), By Vehicle Type 2017-2022
TABLE 325 GCC Countries Automotive Valves Market Value (US$ Mn), By Sales Channel 2012-2016
TABLE 326 GCC Countries Automotive Valves Market Value (US$ Mn), By Sales Channel 2017-2022
TABLE 327 GCC Countries Automotive Valves Market Value (US$ Mn), By Function Type 2012-2016
TABLE 328 GCC Countries Automotive Valves Market Value (US$ Mn), By Function Type 2017-2022
TABLE 329 South Africa Automotive Valves Market Value (US$ Mn), By Product Type 2012-2016
TABLE 330 South Africa Automotive Valves Market Value (US$ Mn), By Product Type 2017-2022
TABLE 331 South Africa Automotive Valves Market Value (US$ Mn), By Vehicle Type 2012-2016
TABLE 332 South Africa Automotive Valves Market Value (US$ Mn), By Vehicle Type 2017-2022
TABLE 333 South Africa Automotive Valves Market Value (US$ Mn), By Sales Channel 2012-2016
TABLE 334 South Africa Automotive Valves Market Value (US$ Mn), By Sales Channel 2017-2022
TABLE 335 South Africa Automotive Valves Market Value (US$ Mn), By Function Type 2012-2016
TABLE 336 South Africa Automotive Valves Market Value (US$ Mn), By Function Type 2017-2022
TABLE 337 Nigeria Automotive Valves Market Value (US$ Mn), By Product Type 2012-2016
TABLE 338 Nigeria Automotive Valves Market Value (US$ Mn), By Product Type 2017-2022
TABLE 339 Nigeria Automotive Valves Market Value (US$ Mn), By Vehicle Type 2012-2016
TABLE 340 Nigeria Automotive Valves Market Value (US$ Mn), By Vehicle Type 2017-2022
TABLE 341 Nigeria Automotive Valves Market Value (US$ Mn), By Sales Channel 2012-2016
TABLE 342 Nigeria Automotive Valves Market Value (US$ Mn), By Sales Channel 2017-2022
TABLE 343 Nigeria Automotive Valves Market Value (US$ Mn), By Function Type 2012-2016
TABLE 344 Nigeria Automotive Valves Market Value (US$ Mn), By Function Type 2017-2022
TABLE 345 Israel Automotive Valves Market Value (US$ Mn), By Product Type 2012-2016
TABLE 346 Israel Automotive Valves Market Value (US$ Mn), By Product Type 2017-2022
TABLE 347 Israel Automotive Valves Market Value (US$ Mn), By Vehicle Type 2012-2016
TABLE 348 Israel Automotive Valves Market Value (US$ Mn), By Vehicle Type 2017-2022
TABLE 349 Israel Automotive Valves Market Value (US$ Mn), By Sales Channel 2012-2016
TABLE 350 Israel Automotive Valves Market Value (US$ Mn), By Sales Channel 2017-2022
TABLE 351 Israel Automotive Valves Market Value (US$ Mn), By Function Type 2012-2016
TABLE 352 Israel Automotive Valves Market Value (US$ Mn), By Function Type 2017-2022
List of Figures
FIG. 1 Global Automotive Valves Market Value (US$ Mn), 2012-2016
FIG. 2 Global Automotive Valves Market Value (US$ Mn) Forecast, 2017-2022
FIG. 3 Global Automotive Valves Market Value (US$ Mn) and Y-o-Y, 2015-2022
FIG. 4 Global Engine (inlet and outlet) valves Segment Market Value (US$ Mn) By Region, 2012-2016
FIG. 5 Global Engine (inlet and outlet) valves Segment Market Value (US$ Mn) By Region, 2017-2022
FIG. 6 Global Engine (inlet and outlet) valves Segment Y-o-Y Growth Rate, By Region, 2015-2022
FIG. 7 Global A/c valve Segment Market Value (US$ Mn) By Region, 2012-2016
FIG. 8 Global A/c valve Segment Market Value (US$ Mn) By Region, 2017-2022
FIG. 9 Global A/c valve Segment Y-o-Y Growth Rate, By Region, 2015-2022
FIG. 10 Global Brake valve Segment Market Value (US$ Mn) By Region, 2012-2016
FIG. 11 Global Brake valve Segment Market Value (US$ Mn) By Region, 2017-2022
FIG. 12 Global Brake valve Segment Y-o-Y Growth Rate, By Region, 2015-2022
FIG. 13 Global Thermostat valve Segment Market Value (US$ Mn) By Region, 2012-2016
FIG. 14 Global Thermostat valve Segment Market Value (US$ Mn) By Region, 2017-2022
FIG. 15 Global Thermostat valve Segment Y-o-Y Growth Rate, By Region, 2015-2022
FIG. 16 Global Fuel system valve Segment Market Value (US$ Mn) By Region, 2012-2016
FIG. 17 Global Fuel system valve Segment Market Value (US$ Mn) By Region, 2017-2022
FIG. 18 Global Fuel system valve Segment Y-o-Y Growth Rate, By Region, 2015-2022
FIG. 19 Global Solenoid valve Segment Market Value (US$ Mn) By Region, 2012-2016
FIG. 20 Global Solenoid valve Segment Market Value (US$ Mn) By Region, 2017-2022
FIG. 21 Global Solenoid valve Segment Y-o-Y Growth Rate, By Region, 2015-2022
FIG. 22 Global Exhaust gas recirculation valve Segment Market Value (US$ Mn) By Region, 2012-2016
FIG. 23 Global Exhaust gas recirculation valve Segment Market Value (US$ Mn) By Region, 2017-2022
FIG. 24 Global Exhaust gas recirculation valve Segment Y-o-Y Growth Rate, By Region, 2015-2022
FIG. 25 Global Tire valve Segment Market Value (US$ Mn) By Region, 2012-2016
FIG. 26 Global Tire valve Segment Market Value (US$ Mn) By Region, 2017-2022
FIG. 27 Global Tire valve Segment Y-o-Y Growth Rate, By Region, 2015-2022
FIG. 28 Global Water valve Segment Market Value (US$ Mn) By Region, 2012-2016
FIG. 29 Global Water valve Segment Market Value (US$ Mn) By Region, 2017-2022
FIG. 30 Global Water valve Segment Y-o-Y Growth Rate, By Region, 2015-2022
FIG. 31 Global AT control valve Segment Market Value (US$ Mn) By Region, 2012-2016
FIG. 32 Global AT control valve Segment Market Value (US$ Mn) By Region, 2017-2022
FIG. 33 Global AT control valve Segment Y-o-Y Growth Rate, By Region, 2015-2022
FIG. 34 Global Compact Passenger Cars Segment Market Value (US$ Mn) By Region, 2012-2016
FIG. 35 Global Compact Passenger Cars Segment Market Value (US$ Mn) By Region, 2017-2022
FIG. 36 Global Compact Passenger Cars Segment Y-o-Y Growth Rate, By Region, 2015-2022
FIG. 37 Global Mid-sized Passenger Cars Segment Market Value (US$ Mn) By Region, 2012-2016
FIG. 38 Global Mid-sized Passenger Cars Segment Market Value (US$ Mn) By Region, 2017-2022
FIG. 39 Global Mid-sized Passenger Cars Segment Y-o-Y Growth Rate, By Region, 2015-2022
FIG. 40 Global Premium Passenger Cars Segment Market Value (US$ Mn) By Region, 2012-2016
FIG. 41 Global Premium Passenger Cars Segment Market Value (US$ Mn) By Region, 2017-2022
FIG. 42 Global Premium Passenger Cars Segment Y-o-Y Growth Rate, By Region, 2015-2022
FIG. 43 Global Luxury Passenger Cars Segment Market Value (US$ Mn) By Region, 2012-2016
FIG. 44 Global Luxury Passenger Cars Segment Market Value (US$ Mn) By Region, 2017-2022
FIG. 45 Global Luxury Passenger Cars Segment Y-o-Y Growth Rate, By Region, 2015-2022
FIG. 46 Global Light Commercial Vehicles Segment Market Value (US$ Mn) By Region, 2012-2016
FIG. 47 Global Light Commercial Vehicles Segment Market Value (US$ Mn) By Region, 2017-2022
FIG. 48 Global Light Commercial Vehicles Segment Y-o-Y Growth Rate, By Region, 2015-2022
FIG. 49 Global Heavy Commercial Vehicles Segment Market Value (US$ Mn) By Region, 2012-2016
FIG. 50 Global Heavy Commercial Vehicles Segment Market Value (US$ Mn) By Region, 2017-2022
FIG. 51 Global Heavy Commercial Vehicles Segment Y-o-Y Growth Rate, By Region, 2015-2022
FIG. 52 Global BEV Segment Market Value (US$ Mn) By Region, 2012-2016
FIG. 53 Global BEV Segment Market Value (US$ Mn) By Region, 2017-2022
FIG. 54 Global BEV Segment Y-o-Y Growth Rate, By Region, 2015-2022
FIG. 55 Global HEV Segment Market Value (US$ Mn) By Region, 2012-2016
FIG. 56 Global HEV Segment Market Value (US$ Mn) By Region, 2017-2022
FIG. 57 Global HEV Segment Y-o-Y Growth Rate, By Region, 2015-2022
FIG. 58 Global PHEV Segment Market Value (US$ Mn) By Region, 2012-2016
FIG. 59 Global PHEV Segment Market Value (US$ Mn) By Region, 2017-2022
FIG. 60 Global PHEV Segment Y-o-Y Growth Rate, By Region, 2015-2022
FIG. 61 Global OEM Segment Market Value (US$ Mn) By Region, 2012-2016
FIG. 62 Global OEM Segment Market Value (US$ Mn) By Region, 2017-2022
FIG. 63 Global OEM Segment Y-o-Y Growth Rate, By Region, 2015-2022
FIG. 64 Global Aftermarket Segment Market Value (US$ Mn) By Region, 2012-2016
FIG. 65 Global Aftermarket Segment Market Value (US$ Mn) By Region, 2017-2022
FIG. 66 Global Aftermarket Segment Y-o-Y Growth Rate, By Region, 2015-2022
FIG. 67 Global Electric Segment Market Value (US$ Mn) By Region, 2012-2016
FIG. 68 Global Electric Segment Market Value (US$ Mn) By Region, 2017-2022
FIG. 69 Global Electric Segment Y-o-Y Growth Rate, By Region, 2015-2022
FIG. 70 Global Pneumatic Segment Market Value (US$ Mn) By Region, 2012-2016
FIG. 71 Global Pneumatic Segment Market Value (US$ Mn) By Region, 2017-2022
FIG. 72 Global Pneumatic Segment Y-o-Y Growth Rate, By Region, 2015-2022
FIG. 73 Global Hydraulic Segment Market Value (US$ Mn) By Region, 2012-2016
FIG. 74 Global Hydraulic Segment Market Value (US$ Mn) By Region, 2017-2022
FIG. 75 Global Hydraulic Segment Y-o-Y Growth Rate, By Region, 2015-2022
FIG. 76 Global Others (Mechanical, Pilot-operated) Segment Market Value (US$ Mn) By Region, 2012-2016
FIG. 77 Global Others (Mechanical, Pilot-operated) Segment Market Value (US$ Mn) By Region, 2017-2022
FIG. 78 Global Others (Mechanical, Pilot-operated) Segment Y-o-Y Growth Rate, By Region, 2015-2022
FIG. 79 North America Automotive Valves Market Value (US$ Mn), By Product Type 2012-2016
FIG. 80 North America Automotive Valves Market Value (US$ Mn), By Product Type 2017-2022
FIG. 81 North America Automotive Valves Market Value (US$ Mn), By Vehicle Type 2012-2016
FIG. 82 North America Automotive Valves Market Value (US$ Mn), By Vehicle Type 2017-2022
FIG. 83 North America Automotive Valves Market Value (US$ Mn), By Sales Channel 2012-2016
FIG. 84 North America Automotive Valves Market Value (US$ Mn), By Sales Channel 2017-2022
FIG. 85 North America Automotive Valves Market Value (US$ Mn), By Function Type 2012-2016
FIG. 86 North America Automotive Valves Market Value (US$ Mn), By Function Type 2017-2022
FIG. 87 Latin America Automotive Valves Market Value (US$ Mn), By Product Type 2012-2016
FIG. 88 Latin America Automotive Valves Market Value (US$ Mn), By Product Type 2017-2022
FIG. 89 Latin America Automotive Valves Market Value (US$ Mn), By Vehicle Type 2012-2016
FIG. 90 Latin America Automotive Valves Market Value (US$ Mn), By Vehicle Type 2017-2022
FIG. 91 Latin America Automotive Valves Market Value (US$ Mn), By Sales Channel 2012-2016
FIG. 92 Latin America Automotive Valves Market Value (US$ Mn), By Sales Channel 2017-2022
FIG. 93 Latin America Automotive Valves Market Value (US$ Mn), By Function Type 2012-2016
FIG. 94 Latin America Automotive Valves Market Value (US$ Mn), By Function Type 2017-2022
FIG. 95 Europe Automotive Valves Market Value (US$ Mn), By Product Type 2012-2016
FIG. 96 Europe Automotive Valves Market Value (US$ Mn), By Product Type 2017-2022
FIG. 97 Europe Automotive Valves Market Value (US$ Mn), By Vehicle Type 2012-2016
FIG. 98 Europe Automotive Valves Market Value (US$ Mn), By Vehicle Type 2017-2022
FIG. 99 Europe Automotive Valves Market Value (US$ Mn), By Sales Channel 2012-2016
FIG. 100 Europe Automotive Valves Market Value (US$ Mn), By Sales Channel 2017-2022
FIG. 101 Europe Automotive Valves Market Value (US$ Mn), By Function Type 2012-2016
FIG. 102 Europe Automotive Valves Market Value (US$ Mn), By Function Type 2017-2022
FIG. 103 Japan Automotive Valves Market Value (US$ Mn), By Product Type 2012-2016
FIG. 104 Japan Automotive Valves Market Value (US$ Mn), By Product Type 2017-2022
FIG. 105 Japan Automotive Valves Market Value (US$ Mn), By Vehicle Type 2012-2016
FIG. 106 Japan Automotive Valves Market Value (US$ Mn), By Vehicle Type 2017-2022
FIG. 107 Japan Automotive Valves Market Value (US$ Mn), By Sales Channel 2012-2016
FIG. 108 Japan Automotive Valves Market Value (US$ Mn), By Sales Channel 2017-2022
FIG. 109 Japan Automotive Valves Market Value (US$ Mn), By Function Type 2012-2016
FIG. 110 Japan Automotive Valves Market Value (US$ Mn), By Function Type 2017-2022
FIG. 111 APEJ Automotive Valves Market Value (US$ Mn), By Product Type 2012-2016
FIG. 112 APEJ Automotive Valves Market Value (US$ Mn), By Product Type 2017-2022
FIG. 113 APEJ Automotive Valves Market Value (US$ Mn), By Vehicle Type 2012-2016
FIG. 114 APEJ Automotive Valves Market Value (US$ Mn), By Vehicle Type 2017-2022
FIG. 115 APEJ Automotive Valves Market Value (US$ Mn), By Sales Channel 2012-2016
FIG. 116 APEJ Automotive Valves Market Value (US$ Mn), By Sales Channel 2017-2022
FIG. 117 APEJ Automotive Valves Market Value (US$ Mn), By Function Type 2012-2016
FIG. 118 APEJ Automotive Valves Market Value (US$ Mn), By Function Type 2017-2022
FIG. 119 MEA Automotive Valves Market Value (US$ Mn), By Product Type 2012-2016
FIG. 120 MEA Automotive Valves Market Value (US$ Mn), By Product Type 2017-2022
FIG. 121 MEA Automotive Valves Market Value (US$ Mn), By Vehicle Type 2012-2016
FIG. 122 MEA Automotive Valves Market Value (US$ Mn), By Vehicle Type 2017-2022
FIG. 123 MEA Automotive Valves Market Value (US$ Mn), By Sales Channel 2012-2016
FIG. 124 MEA Automotive Valves Market Value (US$ Mn), By Sales Channel 2017-2022
FIG. 125 MEA Automotive Valves Market Value (US$ Mn), By Function Type 2012-2016
FIG. 126 MEA Automotive Valves Market Value (US$ Mn), By Function Type 2017-2022
Copyright © Transparency Market Research, Inc. All Rights reserved
Trust Online

Automotive Valves Market