
Reports
Reports
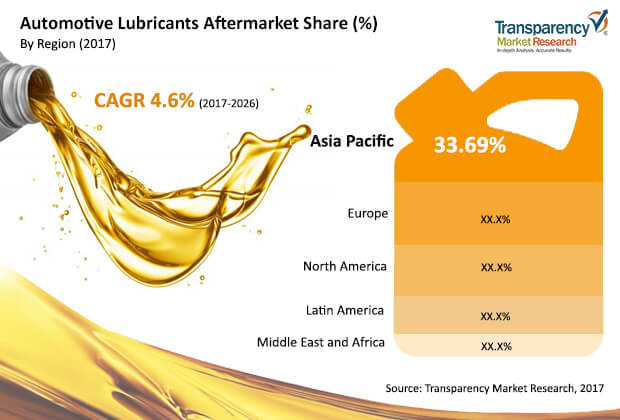
Automotive Lubricants Aftermarket : Snapshot
A lubricant is a substance that is used to reduce friction and control wear between surfaces that are in contact with a relative motion. Automotive lubricants sold in the aftermarket are required for maintenance and smooth operation of vehicles after their purchase. Typically, a lubricant consists of approximately 80% to 90% base oil, and the rest is additives. However, these percentages vary according to application. Characteristics of a good lubricant include high boiling point, high viscosity index, corrosion retardation, thermal stability, low freezing point, and resistance to oxidation. Lubricants are used for their ability to increase the operating lifespan of mechanical parts. They can also eliminate any residue deposited over mechanical parts. Additives are added to the base oil to impart various properties to the lubricant and improve its performance. Lubricant additives are inorganic and organic compounds that are dissolved or suspended as solids in lubricants or base oils. in terms of type, the automotive lubricants aftermarket can be classified into engine oil, gear oil, transmission fluid, and others (including brake oil, greases, coolants, etc.). Aftermarket customers require lubricant suppliers to help them reduce their total operating cost. For instance, extended oil drain intervals help fleet owners to reduce their operating and maintenance cost, primarily by keeping cars and trucks on road for a longer duration of time. The type and quality of the lubricants used has a significant bearing on engine performance, fuel economy, and vehicle life. For instance, European cars and trucks have smaller, more fuel efficient and higher performance engines than vehicles in North America and Asia. Better fuel economy in cars can be achieved by reduced engine and gearbox friction, which is achieved by using lower viscosity and friction-modified lubricants.
World Vehicle Usage
Increase in automotive vehicle fleet has been the main driver of the automotive lubricant aftermarket. The vehicles in operation all over the world require lubricants at frequent time intervals for smoother engine operation and fuel economy. The total global vehicle fleet, including passenger cars and commercial vehicles, stood at 1.28 billion in 2015 and is projected to cross the 2 billion mark by 2035 and 2.5 billion by 2050. Increasing vehicle fleet around the globe is a key indicator of increasing demand for aftermarket automotive lubricants in the near future.
Increasing Sales of New Vehicles
The total number of new vehicle sales stood at 96,804,390 units (including passenger cars and commercial vehicles) in 2017. The rapid increase in sales of vehicle in developing countries and development of infrastructure have created a strong demand for aftermarket automotive lubricants. Increase in manufacturing of vehicles is one of the major factors contributing to the expansion of the global automotive lubricants aftermarket. Rise in demand for low viscosity fluids in the automotive sector is expected to boost the automotive lubricants aftermarket during the forecast period. The engine oil segment dominated the market in 2017 and is expected to expand at a significant rate during the forecast period due to increasing number of vehicles. Engine oil has to be changed frequently after every 5,000 miles to 15,000 miles of vehicle usage depending upon the engine and base oil used. This is expected to boost demand for engine oil. A unique feature of the global automotive aftermarket lubricant industry is that there is no significant slowdown in the consumption of aftermarket lubricants during economic downturns or market slowdowns. For instance, when vehicle sales go up, there is more consumption of lubricants, whereas even if new vehicle sales go down, the running vehicle fleet requires lubricants at frequent time intervals for smoother operation. Oil changes in vehicles become more frequent as they grow old. Therefore, even during unfavorable market conditions, customers have to purchase lubricants in order to maintain the current fleet of vehicles.
Impact of Electric Vehicles on Lubricant Demand
In 2015, there were about 1.1 billion light passenger vehicles, of which 0.9% (9.9 million) vehicles were electric, while the rest were internal combustion engine (ICE) vehicles. Out of the total number of light electric vehicles (9.9 million), 0.1% were battery electric vehicles (BEV) and the rest were hybrid electric vehicles (HEV/PHEV). Despite the marginal penetration of electric vehicles, the move toward electrification of automotive vehicles is likely to gain further impetus as electric vehicles help reduce emissions to meet the CAFÉ norms and various emissions norms set across the world. Since battery electric vehicles do not have internal combustion engines, they do not require engine oil. They only consume small amounts of greases and other products. This is expected to hamper demand for light vehicle lubricants in the near future.
Synthetic and Semi-synthetic Oil Paving the Way for Future Automotive Lubricants
Currently, mineral engine oil dominates the global automotive lubricants aftermarket due to its reasonable price. However, the market share of semi-synthetic and synthetic engine oils is likely to increase in near future, due to increased product knowledge and higher awareness among consumers. As modern lightweight vehicle engines are put under enormous stress, automakers worldwide are shifting toward lubricant grades with less viscosity to support achieving higher mandated fuel economy standards and emission requirements. This has led to increasing consumption of synthetic and semi-synthetic lubricants in newer cars, and it presents a significant market opportunity for all the aftermarket service providers. Synthetic engine oils are made with a variety of performance additives and synthetic base oils. Unlike mineral base oils, synthetic base oils are engineered with molecules of uniform shape and size and are optimized to consistently perform better than mineral base oils. Synthetic oils offer many advantages for newer and advanced engines. They don’t break down as easily as mineral oils, which means they protect the engine longer from excessive metal-to-metal contact that causes wear. Synthetic engine oils also function better in extreme hot and cold temperature conditions. They are paving the way for next-generation engine technology. The inclination toward use of lower viscosity oils to achieve newer grades such as 0W-20, 0W-30, and still to come 0W-16 requires the use of synthetics. Automakers are demanding even lower viscosity grade lubricants, for example 0W-8, which is possible only with synthetic formulations.
Japanese cars have used 0W-20 grade lubricants for several years, and their U.S. and European counterparts are now following in their footsteps. When the new ILSAC GF-6 specification becomes active in near future, synthetics are expected to play a more prominent role.
Market Bound by Emerging Economies in the Aftermath of Global Recession
Consumers in developed and developing regions have different mobility needs. Continued urbanization is likely to lead them toward car ownership. The global lubricants industry has seen a dramatic rebound since the global economic recession of 2008–2009. One of the key drivers of this rebound is higher demand for lubricants from developing economies. This can be ascribed to the surge in new vehicle sales and rise in number of onroad vehicles in Asia Pacific, Latin America, and Middle East & Africa. Economies of rapidly expanding countries of the market such as China, India, and Brazil are expected to achieve significant growth rates in the near future. This is anticipated to drive the global automotive lubricants aftermarket.
Consolidated market with the top few players accounting for more than 60% of the market share
The global automotive lubricants aftermarket is a highly organized market with top players accounting for majority of market share. Key players operating in the Automotive Lubricants Aftermarket are Royal Dutch Shell plc, ExxonMobil Corporation, BP p.l.c., Chevron Corporation, Total S.A., Sinopec Corporation, Fuchs Lubricants Co., LUKOIL Oil Company, Valvoline, Phillips 66, Bharat Petroleum Corporation Limited, JX Nippon Oil & Energy Corporation, Repsol S.A., Petrobras, Petronas, and Indian Oil Corporation Limited.
1. Preface
1.1. Report Description
1.2. Research Scope
1.3. Market Segmentation
2. Assumptions & Research Methodology
2.1. Assumptions
2.2. Research Methodology
3. Executive Summary
3.1. Global Automotive Lubricants Aftermarket, Revenue (US$ Mn), 2016–2025
3.2. Market Snapshot
4. Market Overview
4.1. Product Overview
4.2. Key Industry Developments
4.3. Market Indicators
4.4. Driver 1-Increase in demand for Automotive Lubricants Aftermarket in Wood & Coil Coatings
4.5. Driver 2-Demand for Automotive Lubricants Aftermarket in Industrial and Architectural Coatings
4.6. Restraints
4.7. Opportunity
4.8. Porter’s Five Forces Analysis
4.9. Value Chain Analysis
4.10. SWOT Analysis
5. Market Segmentation- Product Type Segment Analysis
5.1. Introduction
5.2. Global Automotive Lubricants Aftermarket– Product Type Analysis
5.2.1. Silica, Volume (Tons) & Revenue (US$ Mn), 2016-2025
5.2.2. Wax-based, Volume (Tons) & Revenue (US$ Mn), 2016-2025
5.2.3. Thermoplastic based, Volume (Tons) & Revenue (US$ Mn), 2016-2025
5.3. Market Attractiveness Analysis, by Product Type
6. Market Segmentation- Technology Segment Analysis
6.1. Introduction
6.2. Global Automotive Lubricants Aftermarket– Technology Segment Analysis
6.2.1. Water-based, Volume ( Tons) & Revenue (US$ Mn), 2016-2025
6.2.2. Solvent-based Volume (Tons) & Revenue (US$ Mn), 2016-2025
6.2.3. Others , Volume (Tons) & Revenue (US$ Mn), 2016-2025
6.3. Market Attractiveness Analysis, by Technology Segment
7. Market Segmentation- Application Segment Analysis
7.1. Introduction
7.2. Global Automotive Lubricants Aftermarket– Application Analysis
7.2.1. Industrial , Volume (Tons) & Revenue (US$ Mn), 2016-2025
7.2.1.1. Metal, Volume (Tons) & Revenue (US$ Mn), 2016-2025
7.2.1.2. Paper, Volume (Tons) & Revenue (US$ Mn), 2016-2025
7.2.1.3. Plastics, Volume (Tons) & Revenue (US$ Mn), 2016-2025
7.2.1.4. Printing Ink, Volume (Tons) & Revenue (US$ Mn), 2016-2025
7.2.1.5. Others, Volume (Tons) & Revenue (US$ Mn), 2016-2025
7.2.2. Wood Coatings, Volume (Tons) & Revenue (US$ Mn), 2016-2025
7.2.3. Leather Coatings, Volume (Tons) & Revenue (US$ Mn), 2016-2025
7.2.4. Architectural Coatings, Volume (Tons) & Revenue (US$ Mn), 2016-2025
7.2.5. Others, Volume (Tons) & Revenue (US$ Mn), 2016-2025
7.3. Market Attractiveness Analysis, by Application
8. Global Automotive Lubricants Aftermarket– Regional Analysis
8.1. Global Automotive Lubricants Aftermarket Regional Scenario
8.2. Global Automotive Lubricants Aftermarket– Regional Analysis
8.2.1. North America, Volume (Tons) & Revenue (US$ Mn), 2016-2025
8.2.2. Europe, Volume (Tons) & Revenue (US$ Mn), 2016-2025
8.2.3. Asia Pacific, Volume (Tons) & Revenue (US$ Mn), 2016-2025
8.2.4. Latin America, Volume (Tons) & Revenue (US$ Mn), 2016-2025
8.2.5. Middle East & Africa, Volume (Tons) & Revenue (US$ Mn), 2016-2025
8.3. Market Attractiveness Analysis, by Application
9. North America Automotive Lubricants Aftermarket Snapshot
9.1. Key Findings
9.2. North America Automotive Lubricants Aftermarket Overview
9.3. North America Automotive Lubricants Aftermarket– Product Type Segment Analysis, Volume (Tons) & Revenue (US$ Mn), 2016-2025
9.4. North America Automotive Lubricants Aftermarket– Technology segment Analysis, Volume (Tons) & Revenue (US$ Mn), 2016-2025
9.5. North America Automotive Lubricants Aftermarket– Application Segment Analysis, Volume (Tons) & Revenue (US$ Mn), 2016-2025
9.6. North America Automotive Lubricants Aftermarket– Country/Sub-region Segment Analysis, Volume (Tons) & Revenue (US$ Mn), 2016-2025
9.7. U.S. Automotive Lubricants Aftermarket– Product Type Segment Analysis, Volume (Tons) & Revenue (US$ Mn), 2016-2025
9.8. U.S. Automotive Lubricants Aftermarket– Technology Segment Analysis, Volume (Tons) & Revenue (US$ Mn), 2016-2025
9.9. U.S. Automotive Lubricants Aftermarket– Application Segment Analysis, Volume (Tons) & Revenue (US$ Mn), 2016-2025
9.10. Canada Automotive Lubricants Aftermarket– Product Type Segment Analysis, Volume (Tons) & Revenue (US$ Mn), 2016-2025
9.11. Canada Automotive Lubricants Aftermarket– Technology Segment Analysis, Volume (Tons) & Revenue (US$ Mn), 2016-2025
9.12. Canada Automotive Lubricants Aftermarket– Application Segment Analysis, Volume (Tons) & Revenue (US$ Mn), 2016-2025
9.13. North America Automotive Lubricants Aftermarket Attractiveness
9.14. PEST Analysis-North America
10. Europe Automotive Lubricants Aftermarket Snapshot
10.1. Key Findings
10.2. Europe Automotive Lubricants Aftermarket Overview
10.3. Europe Automotive Lubricants Aftermarket– Product Type Segment Analysis, Volume (Tons) & Revenue (US$ Mn), 2016-2025
10.4. Europe Automotive Lubricants Aftermarket– Technology Segment Analysis, Volume (Tons) & Revenue (US$ Mn), 2016-2025
10.5. Europe Automotive Lubricants Aftermarket– Application Segment Analysis, Volume (Tons) & Revenue (US$ Mn), 2016-2025
10.6. Europe Automotive Lubricants Aftermarket– Country/Sub-region Segment Analysis, Volume (Tons) & Revenue (US$ Mn), 2016-2025
10.7. Germany Automotive Lubricants Aftermarket– Product Type Segment Analysis, Volume (Tons) & Revenue (US$ Mn), 2016-2025
10.8. Germany Automotive Lubricants Aftermarket– Technology Segment Analysis, Volume (Tons) & Revenue (US$ Mn), 2016-2025
10.9. Germany Automotive Lubricants Aftermarket– Application Segment Analysis, Volume (Tons) & Revenue (US$ Mn), 2016-2025
10.10. U.K. Automotive Lubricants Aftermarket– Product Type Segment Analysis, Volume (Tons) & Revenue (US$ Mn), 2016-2025
10.11. U.K. Automotive Lubricants Aftermarket– Technology Segment Analysis, Volume (Tons) & Revenue (US$ Mn), 2016-2025
10.12. U.K. Automotive Lubricants Aftermarket– Application Segment Analysis, Volume (Tons) & Revenue (US$ Mn), 2016-2025
10.13. France Automotive Lubricants Aftermarket– Product Type Segment Analysis, Volume (Tons) & Revenue (US$ Mn), 2016-2025
10.14. France Automotive Lubricants Aftermarket– Technology Segment Analysis, Volume (Tons) & Revenue (US$ Mn), 2016-2025
10.15. Italy Automotive Lubricants Aftermarket– Technology Segment Analysis, Volume (Tons) & Revenue (US$ Mn), 2016-2025
10.16. Italy Automotive Lubricants Aftermarket– Application Segment Analysis, Volume (Tons) & Revenue (US$ Mn), 2016-2025
10.17. Rest of Europe Automotive Lubricants Aftermarket– Product Type Segment Analysis, Volume (Tons) & Revenue (US$ Mn), 2016-2025
10.18. Rest of Europe Automotive Lubricants Aftermarket– Technology Segment Analysis, Volume (Tons) & Revenue (US$ Mn), 2016-2025
10.19. Rest of Europe Automotive Lubricants Aftermarket– Application Segment Analysis, Volume (Tons) & Revenue (US$ Mn), 2016-2025
10.20. Europe Automotive Lubricants Aftermarket Attractiveness
10.21. PEST Analysis-EUROPE
11. Asia Pacific Automotive Lubricants Aftermarket Snapshot
11.1. Key Findings
11.2. Asia Pacific Automotive Lubricants Aftermarket Overview
11.3. Asia Pacific Automotive Lubricants Aftermarket– Product Type Segment Analysis, Volume (Tons) & Revenue (US$ Mn), 2016-2025
11.4. Asia Pacific Automotive Lubricants Aftermarket– Technology Segment Analysis, Volume (Tons) & Revenue (US$ Mn), 2016-2025
11.5. Asia Pacific Automotive Lubricants Aftermarket– Application Segment Analysis, Volume (Tons) & Revenue (US$ Mn), 2016-2025
11.6. Asia Pacific Automotive Lubricants Aftermarket– Country/Sub-region Segment Analysis, Volume (Tons) & Revenue (US$ Mn), 2016-2025
11.7. China Automotive Lubricants Aftermarket– Product Type Segment Analysis, Volume (Tons) & Revenue (US$ Mn), 2016-2025
11.8. China Automotive Lubricants Aftermarket– Technology Segment Analysis, Volume (Tons) & Revenue (US$ Mn), 2016-2025
11.9. China Automotive Lubricants Aftermarket– Application Segment Analysis, Volume (Tons) & Revenue (US$ Mn), 2016-2025
11.10. Japan Automotive Lubricants Aftermarket– Product Type Segment Analysis, Volume (Tons) & Revenue (US$ Mn), 2016-2025
11.11. Japan Automotive Lubricants Aftermarket– Technology Segment Analysis, Volume (Tons) & Revenue (US$ Mn), 2016-2025
11.12. Japan Automotive Lubricants Aftermarket– Application Segment Analysis, Volume (Tons) & Revenue (US$ Mn), 2016-2025
11.13. India Automotive Lubricants Aftermarket– Product Type Segment Analysis, Volume (Tons) & Revenue (US$ Mn), 2016-2025
11.14. India Automotive Lubricants Aftermarket– Technology Segment Analysis, Volume (Tons) & Revenue (US$ Mn), 2016-2025
11.15. India Automotive Lubricants Aftermarket– Application Segment Analysis, Volume (Tons) & Revenue (US$ Mn), 2016-2025
11.16. ASEAN Automotive Lubricants Aftermarket– Product Type Segment Analysis, Volume (Tons) & Revenue (US$ Mn), 2016-2025
11.17. Rest of Asia Pacific Automotive Lubricants Aftermarket– Application Segment Analysis, Volume (Tons) & Revenue (US$ Mn), 2016-2025
11.18. Asia Pacific Automotive Lubricants Aftermarket Attractiveness
11.19. PEST Analysis-Asia Pacific
12. Latin America Automotive Lubricants Aftermarket Snapshot
12.1. Key Findings
12.2. Latin America Automotive Lubricants Aftermarket Overview
12.3. Latin America Automotive Lubricants Aftermarket– Product Type Segment Analysis, Volume (Tons) & Revenue (US$ Mn), 2016-2025
12.4. Latin America Automotive Lubricants Aftermarket– Technology Segment Analysis, Volume (Tons) & Revenue (US$ Mn), 2016-2025
12.5. Latin America Automotive Lubricants Aftermarket– Application Segment Analysis, Volume (Tons) & Revenue (US$ Mn), 2016-2025
12.6. Latin America Automotive Lubricants Aftermarket– Country/Sub-region Segment Analysis, Volume (Tons) & Revenue (US$ Mn), 2016-2025
12.7. Brazil Automotive Lubricants Aftermarket– Product Type Segment Analysis, Volume (Tons) & Revenue (US$ Mn), 2016-2025
12.8. Mexico Automotive Lubricants Aftermarket– Product Type Segment Analysis, Volume (Tons) & Revenue (US$ Mn), 2016-2025
12.9. Mexico Automotive Lubricants Aftermarket– Technology Segment Analysis, Volume (Tons) & Revenue (US$ Mn), 2016-2025
12.10. Mexico Automotive Lubricants Aftermarket– Application Segment Analysis, Volume (Tons) & Revenue (US$ Mn), 2016-2025
12.11. Rest of Latin America Automotive Lubricants Aftermarket– Product Type Segment Analysis, Volume (Tons) & Revenue (US$ Mn), 2016-2025
12.12. Rest of Latin America Automotive Lubricants Aftermarket– Technology Segment Analysis, Volume (Tons) & Revenue (US$ Mn), 2016-2025
12.13. Rest of Latin America Automotive Lubricants Aftermarket– Application Segment Analysis, Volume (Tons) & Revenue (US$ Mn), 2016-2025
12.14. Latin America Automotive Lubricants Aftermarket Attractiveness
12.15. PEST Analysis-Latin America
13. Middle East & Africa Automotive Lubricants Aftermarket Snapshot
13.1. Key Findings
13.2. Middle East & Africa Automotive Lubricants Aftermarket Overview
13.3. Middle East & Africa Automotive Lubricants Aftermarket– Application Segment Analysis, Volume (Tons) & Revenue (US$ Mn), 2016-2025
13.4.Middle East & Africa Automotive Lubricants Aftermarket– Country/Sub-region Segment Analysis, Volume (Tons) & Revenue (US$ Mn), 2016-2025
13.5. Turkey Automotive Lubricants Aftermarket– Product Type Segment Analysis, Volume (Tons) & Revenue (US$ Mn), 2016-2025
13.6. Turkey Automotive Lubricants Aftermarket– Technology Segment Analysis, Volume (Tons) & Revenue (US$ Mn), 2016-2025
13.7. Turkey Automotive Lubricants Aftermarket– Application Segment Analysis, Volume (Tons) & Revenue (US$ Mn), 2016-2025
13.8. South Africa Automotive Lubricants Aftermarket– Product Type Segment Analysis, Volume (Tons) & Revenue (US$ Mn), 2016-2025
13.9. South Africa Automotive Lubricants Aftermarket– Technology Segment Analysis, Volume (Tons) & Revenue (US$ Mn), 2016-2025
13.10. South Africa Automotive Lubricants Aftermarket– Application Segment Analysis, Volume (Tons) & Revenue (US$ Mn), 2016-2025
13.11.Rest of MEA Automotive Lubricants Aftermarket– Product Type Segment Analysis, Volume (Tons) & Revenue (US$ Mn), 2016-2025
13.12. Rest of MEA Automotive Lubricants Aftermarket– Technology Segment Analysis, Volume (Tons) & Revenue (US$ Mn), 2016-2025
13.13. Rest of Middle East & Africa Automotive Lubricants Aftermarket– Application Segment Analysis, Volume (Tons) & Revenue (US$ Mn), 2016-2025
13.14. Middle East & Africa Automotive Lubricants Aftermarket Attractiveness
13.15. PEST Analysis-Middle East & Africa
14. Competitive Landscape
14.1. Competition Matrix
14.2. Product Mapping
14.3. Company Profiles
14.3.1. Evonik Industries AG
14.3.1.1. Company Details (HQ, Foundation Year, Revenue, Employee Strength)
14.3.1.2. Business Overview
14.3.1.3. Strategic Overview
14.3.2. PPG Industries, Inc.
14.3.2.1. Company Details (HQ, Foundation Year, Revenue, Employee Strength)
14.3.2.2. Business Overview
14.3.2.3. Strategic Overview
14.3.3. Huntsman International
14.3.3.1. Company Details (HQ, Foundation Year, Revenue, Employee Strength)
14.3.3.2. Business Overview
14.3.4. W. R. Grace & Co.-Conn.
14.3.4.1. Company Details (HQ, Foundation Year, Revenue, Employee Strength)
14.3.4.2. Business Overview
14.3.4.3. Strategic Overview
14.3.5. J.M. Huber Corporation
14.3.5.1. Company Details (HQ, Foundation Year, Revenue, Employee Strength)
14.3.5.2. Business Overview
14.3.6. Imerys
14.3.6.1. Company Details (HQ, Foundation Year, Revenue, Employee Strength)
14.3.6.2. Business Overview
14.3.6.3. Strategic Overview
14.3.7. Allnex Group
14.3.7.1. Company Details (HQ, Foundation Year, Revenue, Employee Strength)
14.3.7.2. Business Overview
14.3.8. Arkema Group
14.3.8.1. Company Details (HQ, Foundation Year, Revenue, Employee Strength)
14.3.8.2. Business Overview
14.3.8.3. Strategic Overview
14.3.9. Akzo Nobel N.V.
14.3.9.1. Company Details (HQ, Foundation Year, Revenue, Employee Strength)
14.3.9.2. Business Overview
14.3.9.3. Strategic Overview
14.3.10. The Lubrizol Corporation
14.3.10.1.Company Details (HQ, Foundation Year, Revenue, Employee Strength)
14.3.10.2. Business Overview
14.3.10.3. Strategic Overview
14.3.11. PQ Corporation
14.3.11.1. Company Details (HQ, Foundation Year, Revenue, Employee Strength)
14.3.11.2. Business Overview
14.3.12. Axalta Coating Systems Ltd.
14.3.12.1.Company Details (HQ, Foundation Year)
14.3.12.2.Business Overview
14.3.12.3.Strategic Overview
14.3.13. michelman, inc.
14.3.13.1. Company Details (HQ, Foundation Year)
14.3.13.2. Business Overview
14.3.14. Quantum Silicones, LLC
14.3.14.1.Company Details (HQ, Foundation Year)
14.3.14.2. Business Overview
14.3.15. Toyobo Co., Ltd
14.3.15.1.Company Details (HQ, Foundation Year, Revenue, Employee Strength)
14.3.15.2. Business Overview
14.3.15.3. Strategic Overview
List of Tables
Table 01: Global Automotive Lubricants Aftermarket Size (US$ Mn) and Volume (Tons) Forecast, by Product, 2016–2025
Table 02: Global Automotive Lubricants Aftermarket Size (US$ Mn) and Volume (Tons) Forecast, by Technology, 2016–2025
Table 03: Global Automotive Lubricants Aftermarket Size (US$ Mn) and Volume (Tons) Forecast, by Application, 2016–2025
Table 04: Global Automotive Lubricants Aftermarket Size (US$ Mn) and Volume (Tons) Forecast, by Region, 2016–2025
Table 05: North America Automotive Lubricants Aftermarket Size (US$ Mn) and Market Volume (Tons) Forecast, by Product, 2016–2025
Table 06: North America Automotive Lubricants Aftermarket Size (US$ Mn) and Market Volume (Tons) Forecast, by Technology, 2016–2025
Table 07: North America Automotive Lubricants Aftermarket Size (US$ Mn) and Volume (Tons) Forecast, by Application, 2016–2025
Table 08: North America Automotive Lubricants Aftermarket Size (US$ Mn) and Market Volume (Tons) Forecast, by Country, 2016–2025
Table 09: U.S. Automotive Lubricants Aftermarket Size (US$ Mn) and Market Volume (Tons) Forecast, by Product, 2016–2025
Table 10: U.S. Automotive Lubricants Aftermarket Size (US$ Mn) and Market Volume (Tons) Forecast, by Technology, 2016–2025
Table 11: U.S. Automotive Lubricants Aftermarket Size (US$ Mn) and Volume (Tons) Forecast, by Application, 2016–2025
Table 12:Canada Automotive Lubricants Aftermarket Size (US$ Mn) and Market Volume (Tons) Forecast, by Product, 2016–2025
Table 13: Canada Automotive Lubricants Aftermarket Size (US$ Mn) and Market Volume (Tons) Forecast, by Technology, 2016–2025
Table 14: Canada Automotive Lubricants Aftermarket Size (US$ Mn) and Volume (Tons) Forecast, by Application, 2016–2025
Table 15: Europe Automotive Lubricants Aftermarket Size (US$ Mn) and Market Volume (Tons) Forecast, by Product, 2016–2025
Table 16: Europe Automotive Lubricants Aftermarket Size (US$ Mn) and Market Volume (Tons) Forecast, by Technology, 2016–2025
Table 17: Europe Automotive Lubricants Aftermarket Size (US$ Mn) and Volume (Tons) Forecast, by Application, 2016–2025
Table 18: Europe Automotive Lubricants Aftermarket Size (US$ Mn) and Market Volume (Tons) Forecast, by Country, 2016–2025
Table 19: Germany Automotive Lubricants Aftermarket Size (US$ Mn) and Market Volume (Tons) Forecast, by Product, 2016–2025
Table 20: Germany Automotive Lubricants Aftermarket Size (US$ Mn) and Market Volume (Tons) Forecast, by Technology, 2016–2025
Table 21: Germany Automotive Lubricants Aftermarket Size (US$ Mn) and Volume (Tons) Forecast, by Application, 2016–2025
Table 22:U.K. Automotive Lubricants Aftermarket Size (US$ Mn) and Market Volume (Tons) Forecast, by Product, 2016–2025
Table 23: U.K. Automotive Lubricants Aftermarket Size (US$ Mn) and Market Volume (Tons) Forecast, by Technology, 2016–2025
Table 24: U.K. Automotive Lubricants Aftermarket Size (US$ Mn) and Volume (Tons) Forecast, by Application, 2016–2025
Table 25:France Automotive Lubricants Aftermarket Size (US$ Mn) and Market Volume (Tons) Forecast, by Product, 2016–2025
Table 26: France Automotive Lubricants Aftermarket Size (US$ Mn) and Market Volume (Tons) Forecast, by Technology, 2016–2025
Table 27: France Automotive Lubricants Aftermarket Size (US$ Mn) and Volume (Tons) Forecast, by Application, 2016–2025
Table 28:Italy Automotive Lubricants Aftermarket Size (US$ Mn) and Market Volume (Tons) Forecast, by Product, 2016–2025
Table 29: Italy Automotive Lubricants Aftermarket Size (US$ Mn) and Market Volume (Tons) Forecast, by Technology, 2016–2025
Table 30: Italy Automotive Lubricants Aftermarket Size (US$ Mn) and Volume (Tons) Forecast, by Application, 2016–2025
Table 31:Rest of Europe Automotive Lubricants Aftermarket Size (US$ Mn) and Market Volume (Tons) Forecast, by Product, 2016–2025
Table 32: Rest of Europe Automotive Lubricants Aftermarket Size (US$ Mn) and Market Volume (Tons) Forecast, by Technology, 2016–2025
Table 33: Rest of Europe Automotive Lubricants Aftermarket Size (US$ Mn) and Volume (Tons) Forecast, by Application, 2016–2025
Table 34: Asia Pacific Automotive Lubricants Aftermarket Size (US$ Mn) and Market Volume (Tons) Forecast, by Product, 2016–2025
Table 35: Asia Pacific Automotive Lubricants Aftermarket Size (US$ Mn) and Market Volume (Tons) Forecast, by Technology, 2016–2025
Table 36: Asia Pacific Automotive Lubricants Aftermarket Size (US$ Mn) and Volume (Tons) Forecast, by Application, 2016–2025
Table 37: Asia Pacific Automotive Lubricants Aftermarket Size (US$ Mn) and Market Volume (Tons) Forecast, by Country, 2016–2025
Table 38: China Automotive Lubricants Aftermarket Size (US$ Mn) and Market Volume (Tons) Forecast, by Product, 2016–2025
Table 39: China Automotive Lubricants Aftermarket Size (US$ Mn) and Market Volume (Tons) Forecast, by Technology, 2016–2025
Table 40: China Automotive Lubricants Aftermarket Size (US$ Mn) and Volume (Tons) Forecast, by Application, 2016–2025
Table 41:Japan Automotive Lubricants Aftermarket Size (US$ Mn) and Market Volume (Tons) Forecast, by Product, 2016–2025
Table 42: Japan Automotive Lubricants Aftermarket Size (US$ Mn) and Market Volume (Tons) Forecast, by Technology, 2016–2025
Table 43: Japan Automotive Lubricants Aftermarket Size (US$ Mn) and Volume (Tons) Forecast, by Application, 2016–2025
Table 44:India Automotive Lubricants Aftermarket Size (US$ Mn) and Market Volume (Tons) Forecast, by Product, 2016–2025
Table 45: India Automotive Lubricants Aftermarket Size (US$ Mn) and Market Volume (Tons) Forecast, by Technology, 2016–2025
Table 46: India Automotive Lubricants Aftermarket Size (US$ Mn) and Volume (Tons) Forecast, by Application, 2016–2025
Table 47:ASEAN Automotive Lubricants Aftermarket Size (US$ Mn) and Market Volume (Tons) Forecast, by Product, 2016–2025
Table 48: ASEAN Automotive Lubricants Aftermarket Size (US$ Mn) and Market Volume (Tons) Forecast, by Technology, 2016–2025
Table 49: ASEAN Automotive Lubricants Aftermarket Size (US$ Mn) and Volume (Tons) Forecast, by Application, 2016–2025
Table 50:Rest of Asia Pacific Automotive Lubricants Aftermarket Size (US$ Mn) and Market Volume (Tons) Forecast, by Product, 2016–2025
Table 51: Rest of Asia Pacific Automotive Lubricants Aftermarket Size (US$ Mn) and Market Volume (Tons) Forecast, by Technology, 2016–2025
Table 52: Rest of Asia Pacific Automotive Lubricants Aftermarket Size (US$ Mn) and Volume (Tons) Forecast, by Application, 2016–2025
Table 53: Latin America Automotive Lubricants Aftermarket Size (US$ Mn) and Market Volume (Tons) Forecast, by Product, 2016–2025
Table 54: Latin America Automotive Lubricants Aftermarket Size (US$ Mn) and Market Volume (Tons) Forecast, by Technology, 2016–2025
Table 55: Latin America Automotive Lubricants Aftermarket Size (US$ Mn) and Volume (Tons) Forecast, by Application, 2016–2025
Table 56: Latin America Automotive Lubricants Aftermarket Size (US$ Mn) and Market Volume (Tons) Forecast, by Country, 2016–2025
Table 57: Brazil Automotive Lubricants Aftermarket Size (US$ Mn) and Market Volume (Tons) Forecast, by Product, 2016–2025
Table 58: Brazil Automotive Lubricants Aftermarket Size (US$ Mn) and Market Volume (Tons) Forecast, by Technology, 2016–2025
Table 59: Brazil Automotive Lubricants Aftermarket Size (US$ Mn) and Volume (Tons) Forecast, by Application, 2016–2025
Table 60:Mexico Automotive Lubricants Aftermarket Size (US$ Mn) and Market Volume (Tons) Forecast, by Product, 2016–2025
Table 61: Mexico Automotive Lubricants Aftermarket Size (US$ Mn) and Market Volume (Tons) Forecast, by Technology, 2016–2025
Table 62: Mexico Automotive Lubricants Aftermarket Size (US$ Mn) and Volume (Tons) Forecast, by Application, 2016–2025
Table 63:Rest of Latin America Automotive Lubricants Aftermarket Size (US$ Mn) and Market Volume (Tons) Forecast, by Product, 2016–2025
Table 64: Rest of Latin America Automotive Lubricants Aftermarket Size (US$ Mn) and Market Volume (Tons) Forecast, by Technology, 2016–2025
Table 65: Rest of Latin America Automotive Lubricants Aftermarket Size (US$ Mn) and Volume (Tons) Forecast, by Application, 2016–2025
Table 66: Middle East & Africa Automotive Lubricants Aftermarket Size (US$ Mn) and Market Volume (Tons) Forecast, by Product, 2016–2025
Table 67: Middle East & Africa Automotive Lubricants Aftermarket Size (US$ Mn) and Market Volume (Tons) Forecast, by Technology, 2016–2025
Table 68: Middle East & Africa Automotive Lubricants Aftermarket Size (US$ Mn) and Volume (Tons) Forecast, by Application, 2016–2025
Table 69: Middle East & Africa Automotive Lubricants Aftermarket Size (US$ Mn) and Market Volume (Tons) Forecast, by Country, 2016–2025
Table 70: GCC Automotive Lubricants Aftermarket Size (US$ Mn) and Market Volume (Tons) Forecast, by Product, 2016–2025
Table 71: GCC Automotive Lubricants Aftermarket Size (US$ Mn) and Market Volume (Tons) Forecast, by Technology, 2016–2025
Table 72: GCC Automotive Lubricants Aftermarket Size (US$ Mn) and Volume (Tons) Forecast, by Application, 2016–2025
Table 73:South Africa Automotive Lubricants Aftermarket Size (US$ Mn) and Market Volume (Tons) Forecast, by Product, 2016–2025
Table 74: South Africa Automotive Lubricants Aftermarket Size (US$ Mn) and Market Volume (Tons) Forecast, by Technology, 2016–2025
Table 75: South Africa Automotive Lubricants Aftermarket Size (US$ Mn) and Volume (Tons) Forecast, by Application, 2016–2025
Table 76:Rest of Middle East & Africa Automotive Lubricants Aftermarket Size (US$ Mn) and Market Volume (Tons) Forecast, by Product, 2016–2025
Table 77: Rest of Middle East & Africa Automotive Lubricants Aftermarket Size (US$ Mn) and Market Volume (Tons) Forecast, by Technology, 2016–2025
Table 78: Rest of Middle East & Africa Automotive Lubricants Aftermarket Size (US$ Mn) and Volume (Tons) Forecast, by Application, 2016–2025
List of Figures
Figure 01: Global Automotive Lubricants Aftermarket Size (US$ Mn) Forecast, 2016–2025
Figure 02: Global Automotive Lubricants Aftermarket Volume (Tons) Forecast, 2016–2025
Figure 03: Global Automotive Lubricants Aftermarket Value Share, by Product (2016)
Figure 04: Global Automotive Lubricants Aftermarket, by Technology (2016)
Figure 05: Global Automotive Lubricants Aftermarket, by Application (2016)
Figure 06: Global Automotive Lubricants Aftermarket, Value Share Analysis, by Product, 2016 and 2025
Figure 07: Global Automotive Lubricants Aftermarket Attractiveness Analysis, by Product, 2016
Figure 08: Global Automotive Lubricants Aftermarket, Value Share Analysis, by Technology, 2016 and 2025
Figure 09: Global Automotive Lubricants Aftermarket Attractiveness Analysis, by Technology, 2016
Figure 10: Global Automotive Lubricants Aftermarket, Value Share Analysis, by Application, 2016 and 2025
Figure 11: Global Automotive Lubricants Aftermarket Attractiveness Analysis, by Application, 2016
Figure 12: Global Automotive Lubricants Aftermarket Value Share Analysis, by Region, 2016 and 2025
Figure 13: Global Automotive Lubricants Aftermarket Attractiveness Analysis, by Region
Figure 14: North America Automotive Lubricants Aftermarket Size (US$ Mn) and Volume (Tons) Forecast, 2016–2025
Figure 15: North America Automotive Lubricants Aftermarket Size and Volume Y-o-Y Growth Projections, 2016–2025
Figure 16: North America Automotive Lubricants Aftermarket Value Share Analysis, by Product, 2016 and 2025
Figure 17: North America Automotive Lubricants Aftermarket, Market Value Share Analysis, by Technology, 2016 and 2025
Figure 18: North America Automotive Lubricants Aftermarket, Market Value Share Analysis, by Application, 2016 and 2025
Figure 19: North America Automotive Lubricants Aftermarket Value Share Analysis, by Country, 2016 and 2025
Figure 20: North America Automotive Lubricants Aftermarket Attractiveness, by Product
Figure 21: North America Automotive Lubricants Aftermarket Attractiveness, by Technology
Figure 22: North America Automotive Lubricants Aftermarket Attractiveness, by Application
Figure 23: North America Automotive Lubricants Aftermarket Attractiveness, by Country
Figure 24: Europe Automotive Lubricants Aftermarket Size (US$ Mn) and Volume (Tons) Forecast, 2016–2025
Figure 25: Europe Automotive Lubricants Aftermarket Size and Volume, Y-o-Y Growth Projection, 2016–2025
Figure 26: Europe Automotive Lubricants Aftermarket, Market Value Share Analysis, by Product, 2016 and 2025
Figure 27: Europe Automotive Lubricants Aftermarket, Market Value Share Analysis, by Technology, 2016 and 2025
Figure 28: Europe Automotive Lubricants Aftermarket, Market Value Share Analysis, by Application, 2016 and 2025
Figure 29: Europe Automotive Lubricants Aftermarket Value Share Analysis, by Country, 2016 and 2025
Figure 30: Europe Automotive Lubricants Aftermarket Attractiveness, by Product
Figure 31: Europe Automotive Lubricants Aftermarket Attractiveness, by Technology
Figure 32: Europe Automotive Lubricants Aftermarket Attractiveness, by Application
Figure 33: Europe Automotive Lubricants Aftermarket Attractiveness, by Country
Figure 34: Asia Pacific Automotive Lubricants Aftermarket Size (US$ Mn) and Volume (Tons) Forecast, 2016–2025
Figure 35: Asia Pacific Automotive Lubricants Aftermarket Size and Volume, Y-o-Y Growth Projection, 2016–2025
Figure 36: Asia Pacific Automotive Lubricants Aftermarket, Market Value Share Analysis, by Product, 2016 and 2025
Figure 37: Asia Pacific Automotive Lubricants Aftermarket, Market Value Share Analysis, by Technology, 2016 and 2025
Figure 38: Asia Pacific Automotive Lubricants Aftermarket, Market Value Share Analysis, by Application, 2016 and 2025
Figure 39: Asia Pacific Automotive Lubricants Aftermarket Value Share Analysis, by Country and Sub-region, 2016 and 2025
Figure 40: Asia Pacific Automotive Lubricants Aftermarket Attractiveness, by Product
Figure 41: Asia Pacific Automotive Lubricants Aftermarket Attractiveness, by Technology
Figure 42: Asia Pacific Automotive Lubricants Aftermarket Attractiveness, by Application
Figure 43: Asia Pacific Automotive Lubricants Aftermarket Attractiveness, by Country
Figure 44: Latin America Automotive Lubricants Aftermarket Size (US$ Mn) and Volume (Tons) Forecast, 2016–2025
Figure 45: Latin America Automotive Lubricants Aftermarket Size and Volume Y-o-Y Growth Projections, 2016–2025
Figure 46: Latin America Automotive Lubricants Aftermarket Value Share Analysis, by Product, 2016 and 2025
Figure 47: Latin America Automotive Lubricants Aftermarket Value Share Analysis, by Technology, 2016 and 2025
Figure 48: Latin America Automotive Lubricants Aftermarket Value Share Analysis, by Application, 2016 and 2025
Figure 49: Latin America Automotive Lubricants Aftermarket Value Share Analysis by Country, 2016 and 2025
Figure 50: Latin America Automotive Lubricants Aftermarket Attractiveness, by Product
Figure 51: Latin America Automotive Lubricants Aftermarket Attractiveness, by Technology
Figure 52: Latin America Automotive Lubricants Aftermarket Attractiveness, by Application
Figure 53: Latin America Automotive Lubricants Aftermarket Attractiveness, by Country
Figure 54: Middle East & Africa Automotive Lubricants Aftermarket Size (US$ Mn) and Volume (Tons) Forecast, 2016–2025
Figure 55: Middle East & Africa Automotive Lubricants Aftermarket Size and Volume Y-o-Y Growth Projections, 2016–2025
Figure 56: Middle East & Africa Automotive Lubricants Aftermarket Value Share Analysis, by Product, 2016 and 2025
Figure 57: Middle East & Africa Automotive Lubricants Aftermarket Value Share Analysis, by Technology, 2016 and 2025
Figure 58: Middle East & Africa Automotive Lubricants Aftermarket Value Share Analysis, by Application, 2016 and 2025
Figure 59: Middle East & Africa Automotive Lubricants Aftermarket Value Share Analysis, by Country, 2016 and 2025
Figure 60: Middle East & Africa Automotive Lubricants Aftermarket Attractiveness, by Product
Figure 61: Middle East & Africa Automotive Lubricants Aftermarket Attractiveness, by Technology
Figure 62: Middle East & Africa Automotive Lubricants Aftermarket Attractiveness, by Application
Figure 63: Middle East & Africa Automotive Lubricants Aftermarket Attractiveness, by Country
Figure 64: Automotive Lubricants Aftermarket Share Analysis, by Company (2016)
Copyright © Transparency Market Research, Inc. All Rights reserved
Trust Online

Automotive Lubricants After Market