
Reports
Reports
Clutch is a mechanical device that is used for engagement and disengagement of transmission from the driving shaft to the driven shaft. The primary function of the clutch is to transmit the torque from the engine side to the drivetrain. The clutch operates quietly and mitigates the drive-related vibration during its operation. Several friction materials are utilized to manufacture a clutch in order to ensure smooth engagement of gears, offer resistance, and providing strength. Organic friction materials are commonly used as friction material for clutch facing, as they offer a perfect combination of smooth engagement, wear resistance, and cost-effectiveness, as compared to others friction materials.
Dual clutch transmission and automated manual transmission are gaining popularity among car manufacturers as these systems offer all the convenience of the conventional automatic transmission, but at a lower price and without hampering fuel efficiency. These factors are likely to drive the demand for automotive clutch considerably during the forecast period.
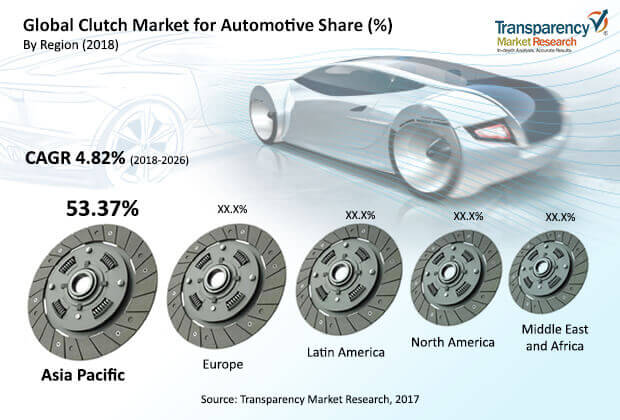
Increase in demand for SUVs, crossovers, compact SUVs, and premium cars across the globe, especially in countries in Asia is a primary factor that is estimated to drive the clutch market during the forecast period. Increase in industrialization, which is boosting the logistics industry, expansion of the IT industry, especially in metropolitan areas, increased population, and migration toward urban areas for better job opportunities, thereby augmenting daily commutation are all driving the production of commercial vehicles. Heavy commercial vehicles have been witnessing the adoption of automatic transmission owing to several advantages such as fuel economy and easier driving training for drivers. These factors are likely to boost the overall market during the forecast period. Increased disposable income and spending capacity of the public, primarily in developing countries, on account of significant revenue opportunities, have propelled the demand for vehicles that are forming the critical necessity for commutation. However, increase in automatic transmission vehicles and electric vehicles are likely to hamper the clutch market for automotive during the forecast period. The global clutch market for automotive is expected to expand at a CAGR of about 5% between 2018 and 2026.
Dry clutch type segment dominates the automotive clutch market presently, and it is expected to remain the same during the forecast period.
Dry clutch is the most used type of clutch in all vehicles due to its advantages over wet clutch such as high coefficient of friction, reduction in transmission power losses and ability to handle more power than the wet clutch. The clutch market can be split into manual transmission and automatic transmission segments. Expect North America penetration of manual transmission is largely present across the globe which is expected to drive the market of automotive clutch during forecast period. Growing dual clutch transmission and automated manual transmission owing its advantages such as competitive cost as compared to automatic transmission, higher fuel efficiency, and better driving experience are likely to boost the segment during forecast period. Rise in popularity of adventurous activities among the youth population has fueled the preference toward compact SUVs and vehicles with off-roading capabilities. This, in turn, has propelled the demand for clutch integration, thereby driving the market. Demand for SUVs and premium car vehicles is anticipated to drive the clutch market during the forecast period.
The dry clutch segment held a major share of the clutch market for automotive in 2017. Most vehicles are equipped with the dry clutch system, as it is inexpensive and provides better engagement on good condition roads. However, the dry clutch system has limitations such as it wears out faster than wet clutches and tends to generate considerable noise sometimes. The wet clutch is immersed in oil and hence, it offers smooth clutch engagement. The wet clutch is also utilized for higher torque application.
Ceramic material also used for clutch facing and it consists of copper, iron, tin bronze, and graphite. Ceramic materials can withstand considerable heat and hence, they are employed in continuous repeated engagement and disengagement applications. Ceramic clutches wear more rapidly than organic clutches, as they absorb more heat than organic material.
Crucial players in the clutch market are expected to benefit from the formation of strategic alliances with global players in the clutch market. The market witnesses the presence of key players that have strong global presence and firm establishments, which are equally coupled with diverse product portfolios. Prominent players operating in the global clutch market for automotive include ZF Friedrichshafen AG, BorgWarner Inc., Schaeffler Technologies AG & Co. KG, EXEDY Corporation, FTE Automotive, Aisin Seiki, F.C.C. Co., Ltd., and Valeo. Companies are focusing on mergers and acquisitions with regional automotive clutch manufacturers in order to expand their businesses globally. BorgWarner is a major manufacturer and has expertise in manufacturing of DualTronic clutch technology. BorgWarner holds a prominent position in the clutch market for automotive, as compared to other major manufacturers.
1. Preface
1.1. Report Scope and Market Segmentation
1.2. Research Highlights
1.3. Research Objectives
1.4. Key Questions Answered
2. Assumptions and Research Methodology
2.1. Report Assumptions
2.2. Abbreviations Used
2.3. Research Methodology
3. Executive Summary
3.1. Global Clutch Market for Automotive Size, by Market Value (US$ Mn) and Market Volume (Million Units), by Region
4. Market Overview
4.1. Introduction
4.2. Market Indicator
4.3. Drivers and Restraints Snapshot Analysis
4.3.1. Drivers
4.3.2. Restraints
4.3.3. Opportunities
4.3.4. Porter’s Analysis
4.3.5. Value Chain Analysis
4.3.6. SWOT Analysis
4.3.7. Price Trend Analysis
5. Global Clutch Market for Automotive Analysis and Forecasts
5.1. North America
5.2. Europe
5.3. Asia Pacific
5.4. Middle East & Africa
5.5. Latin America
6. Global Clutch Market for Automotive Analysis and Forecasts, by Type
6.1. Introduction and Definition
6.2. Key Findings
6.3. Market Size (US$ Mn) Forecast, by Type
6.4. Clutch Market for Automotive Analysis, by Type
6.5. Clutch Market for Automotive Attractiveness Analysis, by Type
7. Global Clutch Market for Automotive Analysis and Forecasts, by Transmission Type
7.1. Introduction and Definition
7.2. Key Findings
7.3. Market Size (US$ Mn) Forecast, by Transmission Type
7.4. Clutch Market for Automotive Analysis, by Transmission Type
7.5. Clutch Market for Automotive Attractiveness Analysis, by Transmission Type
8. Global Clutch Market for Automotive Analysis and Forecasts, by Material Type
8.1. Introduction and Definition
8.2. Key Findings
8.3. Market Size (US$ Mn) Forecast, by Material Type
8.4. Clutch Market for Automotive Analysis, by Material Type
8.5. Clutch Market for Automotive Attractiveness Analysis, by Material type
9. Global Clutch Market for Automotive Analysis and Forecasts, by vehicle Type
9.1. Introduction and Definition
9.2. Key Findings
9.3. Market Size (US$ Mn) Forecast, by Vehicle Type
9.4. Clutch Market for Automotive Analysis, by Vehicle Type
9.5. Clutch Market for Automotive Attractiveness Analysis, by Vehicle type
10. Global Clutch Market for Automotive Analysis and Forecasts, by Sales Channel
10.1. Introduction and Definition
10.2. Key Findings
10.3. Market Size (US$ Mn) Forecast, by Sales Channel
10.4. Clutch Market for Automotive Analysis, by Sales Channel
10.5. Clutch Market for Automotive Attractiveness Analysis, by Sales Channel
11. Global Clutch Market for Automotive Analysis, by Region
11.1. Key Findings
11.2. Market Size (US$ Mn) Forecast, by Region
11.3. Clutch Market for Automotive Attractiveness Analysis, by Region
12. North America Clutch Market for Automotive Analysis
12.1. Key Findings
12.2. North America Clutch Market for Automotive Overview
12.3. North America Market Value Share Analysis, by Type
12.4. North America Market Forecast, by Type
12.4.1. Dry Clutch, 2018–2026
12.4.2. Wet Clutch, 2018–2026
12.5. North America Market Forecast, by Transmission Type
12.5.1. Manual Transmission , 2018–2026
12.5.2. Automatic Transmission, 2018–2026
12.5.2.1. Dual Clutch Transmission
12.5.2.2. Automated Manual Transmission
12.6. North America Market Value Share Analysis, by Material type
12.7. North America Market Forecast, by Material Type
12.7.1. Organic Material, 2018–2026
12.7.2. Ceramic Material, 2018–2026
12.7.3. Others ( Kevlar & Feramic ), 2018–2026
12.8. North America Market Value Share Analysis, by Vehicle Type
12.9. North America Market Forecast, by Vehicle Type
12.9.1. Passenger vehicle, 2018–2026
12.9.2. Commercial Vehicle, 2018–2026
12.10. North America Market Value Share Analysis, by Sales Channel
12.11. North America Market Forecast, by Sales Channel
12.11.1. OEM, 2018–2026
12.11.2. Aftermarket, 2018–2026
12.12. North America Market Value Share Analysis, by Country
12.13. North America Market Forecast, by Country
12.13.1. U.S., 2018–2026
12.13.2. Canada, 2018–2026
12.14. North America Market Analysis, by Country
12.15. U.S. Market Forecast, by Type
12.15.1. Dry Clutch, 2018–2026
12.15.2. Wet Clutch, 2018–2026
12.16. U.S. Market Forecast, by Transmission Type
12.16.1. Manual Transmission, 2018–2026
12.16.2. Automatic Transmission, 2018–2026
12.16.2.1. Dual Clutch Transmission 2018–2026
12.16.2.2. Automated Manual Transmission 2018–2026
12.17. U.S. Market Forecast, by Material Type
12.17.1. Organic Material, 2018–2026
12.17.2. Ceramic Material, 2018–2026
12.17.3. Others ( Kevlar & Feramic ), 2018–2026
12.18. U.S. Market Forecast, by Vehicle Type
12.18.1. Passenger Vehicle, 2018–2026
12.18.2. Commercial Vehicle, 2018–2026
12.19. Canada Market Forecast, by Type
12.19.1. Dry Clutch, 2018–2026
12.19.2. Wet Clutch, 2018–2026
12.20. Canada Market Forecast, by Transmission Type
12.20.1. Manual Transmission, 2018–2026
12.20.2. Automatic Transmission, 2018–2026
12.20.2.1. Dual Clutch Transmission 2018–2026
12.20.2.2. Automated Manual Transmission 2018–2026
12.21. Canada Market Forecast, by Material Type
12.21.1. Organic Material, 2018–2026
12.21.2. Ceramic Material, 2018–2026
12.21.3. Others ( Kevlar & Feramic ), 2018–2026
12.22. Canada Market Forecast, by Vehicle Type
12.22.1. Passenger Vehicle
12.22.2. Commercial Vehicle
12.23. PEST Analysis
13. Europe Clutch Market for Automotive Analysis
13.1. Key Findings
13.2. Europe Clutch Market for Automotive Overview
13.3. Europe Market Value Share Analysis, by Type
13.4. Europe Market Forecast, by Type
13.4.1. Dry Clutch, 2018–2026
13.4.2. Wet Clutch, 2018–2026
13.5. Europe Market Forecast, by Transmission Type
13.5.1. Manual Transmission, 2018–2026
13.5.2. Automatic Transmission, 2018–2026
13.5.2.1. Dual Clutch Transmission 2018–2026
13.5.2.2. Automated Manual Transmission 2018–2026
13.6. Europe Market Value Share Analysis, by Material Type
13.7. Europe Market Forecast, by Material
13.7.1. Organic Material, 2018–2026
13.7.2. Ceramic Material, 2018–2026
13.7.3. Others ( Kevlar & Feramic ), 2018–2026
13.8. Europe Market Value Share Analysis, by Vehicle Type
13.9. Europe Market Forecast, by Vehicle
13.9.1. Passenger Vehicle, 2018–2026
13.9.2. Commercial Vehicle, 2018–2026
13.10. Europe Market Value Share Analysis, by Sales Channel
13.11. Europe Market Forecast, by Sales Channel
13.11.1. OEM, 2018–2026
13.11.2. Aftermarket, 2018–2026
13.12. Europe Market Value Share Analysis, by Country/Sub-region
13.13. Europe Market Forecast, by Country/Sub-region
13.13.1. Germany, 2018–2026
13.13.2. U.K., 2018–2026
13.13.3. France, 2018–2026
13.13.4. Italy, 2018–2026
13.13.5. Spain, 2018–2026
13.13.6. Rest of Europe, 2018–2026
13.14. Europe Market Analysis, by Country/Sub-region
13.15. Germany Market Forecast, by Type
13.15.1. Dry Clutch, 2018–2026
13.15.2. Wet Clutch, 2018–2026
13.16. Germany Market Forecast, by Transmission Type
13.16.1. Manual Transmission, 2018–2026
13.16.2. Automatic Transmission, 2018–2026
13.16.2.1. Dual Clutch Transmission 2018–2026
13.16.2.2. Automated Manual Transmission 2018–2026
13.17. Germany Market Forecast, by Material
13.17.1. Organic Material, 2018–2026
13.17.2. Ceramic Material, 2018–2026
13.17.3. Others ( Kevlar & Feramic ), 2018–2026
13.18. Germany Market Forecast, by Vehicle
13.18.1. Passenger Vehicle, 2018–2026
13.18.2. Commercial Vehicle, 2018–2026
13.19. U.K. Market Forecast, by Type
13.19.1. Dry Clutch, 2018–2026
13.19.2. Wet Clutch, 2018–2026
13.20. U.K. Market Forecast, by Transmission Type
13.20.1. Manual Transmission, 2018–2026
13.20.2. Automatic Transmission, 2018–2026
13.21. U.K. Market Forecast, by Material
13.21.1. Organic Material, 2018–2026
13.21.2. Ceramic Material, 2018–2026
13.21.3. Others ( Kevlar & Feramic ), 2018–2026
13.22. U.K. Market Forecast, by Vehicle
13.22.1. Passenger Vehicle, 2018–2026
13.22.2. Commercial Vehicle, 2018–2026
13.23. France Market Forecast, by Type
13.23.1. Dry Clutch, 2018–2026
13.23.2. Wet Clutch, 2018–2026
13.24. France Market Forecast, by Transmission Type
13.24.1. Manual Transmission, 2018–2026
13.24.2. Automatic Transmission, 2018–2026
13.24.2.1. Dual Clutch Transmission 2018–2026
13.24.2.2. Automated Manual Transmission 2018–2026
13.25. France Market Forecast, by Material
13.25.1. Organic Material, 2018–2026
13.25.2. Ceramic Material, 2018–2026
13.25.3. Others ( Kevlar & Feramic ), 2018–2026
13.26. France Market Forecast, by Vehicle
13.26.1. Passenger Vehicle, 2018–2026
13.26.2. Commercial Vehicle, 2018–2026
13.27. Italy Market Forecast, by Type
13.27.1. Dry Clutch, 2018–2026
13.27.2. Wet Clutch, 2018–2026
13.28. Italy Market Forecast, by Transmission Type
13.28.1. Manual Transmission, 2018–2026
13.28.2. Automatic Transmission, 2018–2026
13.28.2.1. Dual Clutch Transmission 2018–2026
13.28.2.2. Automated Manual Transmission 2018–2026
13.29. Italy Market Forecast, by Material
13.29.1. Organic Material, 2018–2026
13.29.2. Ceramic Material, 2018–2026
13.29.3. Others ( Kevlar & Feramic ), 2018–2026
13.30. Italy Market Forecast, by Vehicle
13.30.1. Passenger vehicle, 2018–2026
13.30.2. Commercial Vehicle, 2018–2026
13.31. Spain Market Forecast, by Type
13.31.1. Dry Clutch, 2018–2026
13.31.2. Wet Clutch, 2018–2026
13.32. Spain Market Forecast, by Transmission Type
13.32.1. Manual Transmission, 2018–2026
13.32.2. Automatic Transmission, 2018–2026
13.32.2.1. Dual Clutch Transmission 2018–2026
13.32.2.2. Automated Manual Transmission 2018–2026
13.33. Spain Market Forecast, by Material
13.33.1. Organic Material, 2018–2026
13.33.2. Ceramic Material, 2018–2026
13.33.3. Others ( Kevlar & Feramic ), 2018–2026
13.34. Spain Market Forecast, by Vehicle
13.34.1. Passenger vehicle, 2018–2026
13.34.2. Commercial Vehicle, 2018–2026
13.35. Rest Of Europe Market Forecast, by Type
13.35.1. Dry Clutch, 2018–2026
13.35.2. Wet Clutch, 2018–2026
13.36. Rest of Europe Market Forecast, by Transmission Type
13.36.1. Manual Transmission, 2018–2026
13.36.2. Automatic Transmission, 2018–2026
13.36.2.1. Dual Clutch Transmission 2018–2026
13.36.2.2. Automated Manual Transmission 2018–2026
13.37. Rest of Europe Market Forecast, by Material
13.37.1. Organic Material, 2018–2026
13.37.2. Ceramic Material
13.37.3. Others ( Kevlar & Feramic ), 2018–2026
13.38. Rest of Europe Market Forecast, by Vehicle
13.38.1. Passenger vehicle, 2018–2026
13.38.2. Commercial Vehicle, 2018–2026
13.39. PEST Analysis
14. Asia Pacific Clutch Market for Automotive Analysis
14.1. Key Findings
14.2. Asia Pacific Clutch Market for Automotive Overview
14.3. Asia Pacific Market Value Share Analysis, by Type
14.4. Asia Pacific Market Forecast, by Type
14.4.1. Dry Clutch, 2018–2026
14.4.2. Wet Clutch, 2018–2026
14.5. Asia Pacific Market Forecast, by Transmission Type
14.5.1. Manual Transmission, 2018–2026
14.5.2. Automatic Transmission, 2018–2026
14.5.2.1. Dual Clutch Transmission 2018–2026
14.5.2.2. Automated Manual Transmission 2018–2026
14.6. Asia Pacific Market Value Share Analysis, by Material
14.7. Asia Pacific Market Forecast, by Vehicle
14.7.1. Organic Material, 2018–2026
14.7.2. Ceramic Material, 2018–2026
14.7.3. Others ( Kevlar & Feramic ), 2018–2026
14.8. Asia Pacific Market Value Share Analysis, by Vehicle
14.9. Asia Pacific Market Forecast, by Vehicle
14.9.1. Passenger Vehicle 2018–2026
14.9.2. Commercial Vehicle, 2018–2026
14.10. Asia Pacific Market Value Share Analysis, by Sales Channel
14.11. Asia Pacific Market Forecast, by Sales Channel
14.11.1. OEM, 2017-2025
14.11.2. Aftermarket, 2017-2025
14.12. Asia Pacific Market Value Share Analysis, by Country/Sub-region
14.13. Asia Pacific Market Forecast, by Country/Sub-region
14.13.1. China, 2018–2026
14.13.2. India, 2018–2026
14.13.3. Japan, 2018–2026
14.13.4. ASEAN, 2018–2026
14.13.5. Rest of Asia Pacific, 2018–2026
14.14. Asia Pacific Market Analysis, by Country/Sub-region
14.15. China Market Forecast, by Type
14.15.1. Dry Clutch, 2018–2026
14.15.2. Wet Clutch, 2018–2026
14.16. China Market Forecast, by Transmission Type
14.16.1. Manual Transmission, 2018–2026
14.16.2. Automatic Transmission, 2018–2026
14.16.2.1. Dual Clutch Transmission 2018–2026
14.16.2.2. Automated Manual Transmission 2018–2026
14.17. China Market Forecast, by Material
14.17.1. Organic Material, 2018–2026
14.17.2. Ceramic Material, 2018–2026
14.17.3. Others ( Kevlar & Feramic ), 2018–2026
14.18. China Market Forecast, by Vehicle Type
14.18.1. Passenger Vehicle, 2018–2026
14.18.2. Commercial Vehicle, 2018–2026
14.19. India Market Forecast, by Type
14.19.1. Dry Clutch, 2018–2026
14.19.2. Wet Clutch, 2018–2026
14.20. India Market Forecast, by Transmission Type
14.20.1. Manual Transmission, 2018–2026
14.20.2. Automatic Transmission, 2018–2026
14.20.2.1. Dual Clutch Transmission 2018–2026
14.20.2.2. Automated Manual Transmission 2018–2026
14.21. India Market Forecast, by Material
14.21.1. Organic Material, 2018–2026
14.21.2. Ceramic Material, 2018–2026
14.21.3. Others ( Kevlar & Feramic ), 2018–2026
14.22. India Market Forecast, by Vehicle Type
14.22.1. Passenger Vehicle, 2018–2026
14.22.2. Commercial Vehicle, 2018–2026
14.23. Japan Market Forecast, by Type
14.23.1. Dry Clutch, 2018–2026
14.23.2. Wet Clutch, 2018–2026
14.24. Japan Market Forecast, by Transmission Type
14.24.1. Manual Transmission, 2018–2026
14.24.2. Automatic Transmission, 2018–2026
14.24.2.1. Dual Clutch Transmission 2018–2026
14.24.2.2. Automated Manual Transmission 2018–2026
14.25. Japan Market Forecast, by Material
14.25.1. Organic Material, 2018–2026
14.25.2. Ceramic Material, 2018–2026
14.25.3. Others ( Kevlar & Feramic ), 2018–2026
14.26. Japan Market Forecast, by Vehicle Type
14.26.1. Passenger Vehicle, 2018–2026
14.26.2. Commercial Vehicle, 2018–2026
14.27. ASEAN Market Forecast, by Type
14.27.1. Dry Clutch, 2018–2026
14.27.2. Wet Clutch, 2018–2026
14.28. ASEAN Market Forecast, by Transmission Type
14.28.1. Manual Transmission, 2018–2026
14.28.2. Automatic Transmission, 2018–2026
14.28.2.1. Dual Clutch Transmission 2018–2026
14.28.2.2. Automated Manual Transmission 2018–2026
14.29. ASEAN Market Forecast, by Material
14.29.1. Organic Material, 2018–2026
14.29.2. Ceramic Material, 2018–2026
14.29.3. Others ( Kevlar & Feramic ), 2018–2026
14.30. ASEAN Market Forecast, by Vehicle Type
14.30.1. Passenger Vehicle, 2018–2026
14.30.2. Commercial Vehicle, 2018–2026
14.31. Rest of Asia Pacific Market Forecast, by Type
14.31.1. Dry Clutch, 2018–2026
14.31.2. Wet Clutch, 2018–2026
14.32. Rest of Asia Pacific Market Forecast, by Transmission Type
14.32.1. Manual Transmission, 2018–2026
14.32.2. Automatic Transmission, 2018–2026
14.32.2.1. Dual Clutch Transmission 2018–2026
14.32.2.2. Automated Manual Transmission 2018–2026
14.33. Rest of Asia Pacific Market Forecast, by Material
14.33.1. Organic Material, 2018–2026
14.33.2. Ceramic Material, 2018–2026
14.33.3. Others ( Kevlar & Feramic ), 2018–2026
14.34. Rest of Asia Pacific Market Forecast, by Vehicle Type
14.34.1. Passenger Vehicle, 2018–2026
14.34.2. Commercial Vehicle, 2018–2026
14.35. PEST Analysis
15. Middle East & Africa Clutch Market for Automotive Analysis
15.1. Key Findings
15.2. Middle East & Africa Clutch Market for Automotive Overview
15.3. Middle East & Africa Market Value Share Analysis, by Type
15.4. Middle East & Africa Market Forecast, by Type
15.4.1. Dry Clutch, 2018–2026
15.4.2. Wet Clutch, 2018–2026
15.5. Middle East & Africa Market Forecast, by Transmission Type
15.5.1. Manual Transmission, 2018–2026
15.5.2. Automatic Transmission, 2018–2026
15.5.2.1. Dual Clutch Transmission 2018–2026
15.5.2.2. Automated Manual Transmission 2018–2026
15.6. Middle East & Africa Market Value Share Analysis, by Material
15.7. Middle East & Africa Market Forecast, by Material
15.7.1. Organic Material, 2018–2026
15.7.2. Ceramic Material, 2018–2026
15.7.3. Others ( Kevlar & Feramic ), 2018–2026
15.8. Middle East & Africa Market Value Share Analysis, by Vehicle
15.9. Middle East & Africa Market Forecast, by Vehicle Type
15.9.1. Passenger Vehicle, 2018–2026
15.9.2. Commercial Vehicle, 2018–2026
15.10. Middle East & Africa Market Value Share Analysis, by Sales Channel
15.11. Middle East & Africa Market Forecast, by Sales Channel
15.11.1. OEM, 2018–2026
15.11.2. Aftermarket, 2018–2026
15.12. Middle East & Africa Market Value Share Analysis, by Country/Sub-region
15.13. Middle East & Africa Market Forecast, by Country/Sub-region
15.13.1. GCC, 2018–2026
15.13.2. South Africa, 2018–2026
15.13.3. Rest of Middle East & Africa, 2018–2026
15.14. Middle East & Africa Market Analysis, by Country/Sub-region
15.15. GCC Market Forecast, by Type
15.15.1. Dry Clutch, 2018–2026
15.15.2. Wet Clutch, 2018–2026
15.16. GCC Market Forecast, by Transmission Type
15.16.1. Manual Transmission, 2018–2026
15.16.2. Automatic Transmission, 2018–2026
15.16.2.1. Dual Clutch Transmission 2018–2026
15.16.2.2. Automated Manual Transmission 2018–2026
15.17. GCC Market Forecast, by Material
15.17.1. Organic Material, 2018–2026
15.17.2. Ceramic Material, 2018–2026
15.17.3. Others ( Kevlar & Feramic ), 2018–2026
15.18. GCC Market Forecast, by Vehicle Type
15.18.1. Passenger Vehicle, 2018–2026
15.18.2. Commercial Vehicle, 2018–2026
15.19. South Africa Market Forecast, by Type
15.19.1. Dry Clutch, 2018–2026
15.19.2. Wet Clutch, 2018–2026
15.20. South Africa Market Forecast, by Transmission Type
15.20.1. Manual Transmission, 2018–2026
15.20.2. Automatic Transmission, 2018–2026
15.20.2.1. Dual Clutch Transmission 2018–2026
15.20.2.2. Automated Manual Transmission 2018–2026
15.21. South Africa Market Forecast, by Material
15.21.1. Organic Material, 2018–2026
15.21.2. Ceramic Material, 2018–2026
15.21.3. Others ( Kevlar & Feramic ), 2018–2026
15.22. South Africa Market Forecast, by Vehicle Type
15.22.1. Passenger Vehicle, 2018–2026
15.22.2. Commercial Vehicle, 2018–2026
15.23. Rest of Middle East & Africa Market Forecast, by Type
15.23.1. Dry Clutch, 2018–2026
15.23.2. Wet Clutch, 2018–2026
15.24. Rest of Middle East & Africa Market Forecast, by Transmission Type
15.24.1. Manual Transmission, 2018–2026
15.24.2. Automatic Transmission, 2018–2026
15.24.2.1. Dual Clutch Transmission 2018–2026
15.24.2.2. Automated Manual Transmission 2018–2026
15.25. Rest of Middle East & Africa Market Forecast, by Material
15.25.1. Organic Material, 2018–2026
15.25.2. Ceramic Material, 2018–2026
15.25.3. Others, 2017-2025
15.26. Rest of Middle East & Africa Market Forecast, by Vehicle Type
15.26.1. Passenger Vehicle, 2018–2026
15.26.2. Commercial Vehicle, 2018–2026
15.27. PEST Analysis
16. Latin America Clutch Market for Automotive Analysis
16.1. Key Findings
16.2. Latin America Clutch Market for Automotive Overview
16.3. Latin America Market Value Share Analysis, by Type
16.4. Latin America Market Forecast, by Type
16.4.1. Dry Clutch, 2018–2026
16.4.2. Wet Clutch, 2018–2026
16.5. Latin America Market Value Share Analysis, by Transmission Type
16.6. Latin America Market Forecast, by Transmission Type
16.6.1. Manual Transmission, 2018–2026
16.6.2. Automatic Transmission, 2018–2026
16.6.2.1. Dual Clutch Transmission 2018–2026
16.6.2.2. Automated Manual Transmission 2018–2026
16.7. Latin America Market Value Share Analysis, by Material
16.8. Latin America Market Forecast, by Material
16.8.1. Organic Material, 2018–2026
16.8.2. Ceramic Material, 2018–2026
16.8.3. Others ( Kevlar & Feramic ), 2018–2026
16.9. Latin America Market Value Share Analysis, by Vehicle Type
16.10. Latin America Market Forecast, by Vehicle Type
16.10.1. Passenger Vehicle 2017-2025
16.10.2. Commercial Vehicle 2017-2025
16.11. Latin America Market Value Share Analysis, by Sales Channel
16.12. Latin America Market Forecast, by Sales Channel
16.12.1. OEM, 2018–2026
16.12.2. Aftermarket, 2018–2026
16.13. Latin America Market Value Share Analysis, by Country/Sub-region
16.14. Latin America Market Forecast, by Country/Sub-region
16.14.1. Brazil, 2018–2026
16.14.2. Mexico, 2018–2026,
16.14.3. Rest of Latin America, 2018–2026
16.15. Latin America Market Analysis, by Country/Sub-region
16.16. Brazil Market Forecast, by Type
16.16.1. Dry Clutch, 2018–2026
16.16.2. Wet Clutch, 2018–2026
16.17. Brazil Market Forecast, by Transmission Type
16.17.1. Manual Transmission, 2018–2026
16.17.2. Automatic Transmission, 2018–2026
16.17.2.1. Dual Clutch Transmission 2018–2026
16.17.2.2. Automated Manual Transmission 2018–2026
16.18. Brazil Market Forecast, by Material
16.18.1. Organic Material, 2018–2026
16.18.2. Ceramic Material, 2018–2026
16.18.3. Others ( Kevlar & Feramic ), 2018–2026
16.19. Brazil Market Forecast, by Vehicle Type
16.19.1. Passenger Vehicle, 2018–2026
16.19.2. Commercial Vehicle, 2018–2026
16.20. Mexico Market Forecast, by Type
16.20.1. Dry Clutch, 2018–2026
16.20.2. Wet Clutch, 2018–2026
16.21. Mexico Market Forecast, by Transmission
16.21.1. Manual Transmission, 2018–2026
16.21.2. Automatic Transmission, 2018–2026
16.21.2.1. Dual Clutch Transmission 2018–2026
16.21.2.2. Automated Manual Transmission 2018–2026
16.22. Mexico Market Forecast, by Material
16.22.1. Organic Material, 2018–2026
16.22.2. Ceramic Material, 2018–2026
16.22.3. Others ( Kevlar & Feramic ), 2018–2026
16.23. Mexico Market Forecast, by Vehicle Type
16.23.1. Passenger Vehicle, 2018–2026
16.23.2. Commercial Vehicle, 2018–2026
16.24. Rest of Latin America Forecast, by Type
16.24.1. Dry Clutch, 2018–2026
16.24.2. Wet Clutch, 2018–2026
16.25. Rest of Latin America Forecast, by Transmission
16.25.1. Manual Transmission, 2018–2026
16.25.2. Automatic Transmission, 2018–2026
16.25.2.1. Dual Clutch Transmission 2018–2026
16.25.2.2. Automated Manual Transmission 2018–2026
16.26. Rest of Latin America Forecast, by Material
16.26.1. Organic Material, 2018–2026
16.26.2. Ceramic Material, 2018–2026
16.26.3. Others ( Kevlar & Feramic ), 2018–2026
16.27. Rest of Latin America Forecast, by Vehicle Type
16.27.1. Passenger Vehicle, 2018–2026
16.27.2. Commercial Vehicle, 2018–2026
16.28. PEST Analysis
17. Company Profiles
17.1. Market Share Analysis, by Company
17.2. Competition Matrix
17.3. Company Profiles: Key Players
17.3.1. Schaeffler AG
17.3.1.1. Company Overview
17.3.1.2. Financial Overview
17.3.1.3. Business Strategy
17.3.1.4. Recent Developments
17.3.2. BorgWarner Inc.
17.3.2.1. Company Overview
17.3.2.2. Financial Overview
17.3.2.3. Business Strategy
17.3.2.4. Recent Developments
17.3.3. ZF Friedrichshafen AG
17.3.3.1. Company Overview
17.3.3.2. Financial Overview
17.3.3.3. Business Strategy
17.3.3.4. Recent Developments
17.3.4. AISIN SEIKI
17.3.4.1. Company Overview
17.3.4.2. Financial Overview
17.3.4.3. Business Strategy
17.3.4.4. Recent Developments
17.3.5. EXEDY Corporation
17.3.5.1. Company Overview
17.3.5.2. Financial Overview
17.3.5.3. Business Strategy
17.3.5.4. Recent Developments
17.3.6. FTE automotive
17.3.6.1. Company Overview
17.3.6.2. Financial Overview
17.3.6.3. Business Strategy
17.3.6.4. Recent Developments
17.3.7. AMS Automotive
17.3.7.1. Company Overview
17.3.7.2. Financial Overview
17.3.7.3. Business Strategy
17.3.7.4. Recent Developments
17.3.8. F.C.C. Co., Ltd.
17.3.8.1. Company Overview
17.3.8.2. Financial Overview
17.3.8.3. Business Strategy
17.3.8.4. Recent Developments
17.3.9. Valeo
17.3.9.1. Company Overview
17.3.9.2. Financial Overview
17.3.9.3. Business Strategy
17.3.9.4. Recent Developments
17.3.10. Setco Automotive Ltd
17.3.10.1. Company Overview
17.3.10.2. Financial Overview
17.3.10.3. Business Strategy
17.3.10.4. Recent Developments
17.3.11. Robert Bosch GmbH
17.3.11.1. Company Overview
17.3.11.2. Financial Overview
17.3.11.3. Business Strategy
17.3.11.4. Recent Developments
18. Primary Key Insights
List of Tables
Table 1: Global Automotive Clutch Market Volume (Million Units) Forecast, by Transmission, 2017–2026
Table 2: Global Automotive Clutch Market Size (US$ Mn) Forecast, by Transmission, 2017–2026
Table 3: Global Automotive Clutch Market Volume (Million Units) Forecast, by Clutch Type, 2017–2026
Table 4: Global Automotive Clutch Market Size (US$ Mn) Forecast, by Clutch Type, 2017–2026
Table 5: Global Automotive Clutch Market Volume (Million Units) Forecast, by Material Type, 2017–2026
Table 6: Global Automotive Clutch Market Size (US$ Mn) Forecast, by Material Type, 2017–2026
Table 7: Global Automotive Clutch Market Volume (Million Units) and Forecast, by Vehicle Type, 2017–2026
Table 8: Global Automotive Clutch Market Size (USD Mn) and Forecast, by Vehicle Type, 2017–2026
Table 9: Global Automotive Clutch Market Volume (Million Units) and Forecast, by Sales Channel, 2018–2026
Table 10: Global Automotive Clutch Market Size (USD Mn) and Forecast, by Sales Channel, 2017–2026
Table 11: Global Automotive Clutch Market Size (US$ Mn) Forecast, by Region, 2017–2026
Table 12: Global Automotive Clutch Market Volume (Mn Units) Forecast, by Region, 2017–2026
Table 13: North America Automotive Clutch Market Size (US$ Mn) Forecast, by Transmission, 2017–2026
Table 14: North America Automotive Clutch Market Volume (Million Units) Forecast, by Transmission, 2017–2026
Table 15: North America Automotive Clutch Market Size (US$ Mn) Forecast, by Clutch Type, 2017–2026
Table 16: North America Automotive Clutch Market Volume (Mn Units) Forecast, by Clutch Type, 2017–2026
Table 17: North America Automotive Clutch Market Size (US$ Mn) Forecast, by Material Type, 2017–2026
Table 18: North America Automotive Clutch Market Volume (Mn Units) Forecast, by Material Type, 2017–2026
Table 19: North America Automotive Clutch Market Size (US$ Mn) Forecast, by Sales Channel, 2017–2026
Table 20: North America Automotive Clutch Market Volume (Mn Units) Forecast, by Sales Channel, 2017–2026
Table 21: North America Automotive Clutch Market Size (US$ Mn) Forecast, by Vehicle Type, 2017–2026
Table 22: North America Automotive Clutch Market Volume (Million Units) Forecast, by Vehicle Type, 2017–2026
Table 23: North America Automotive Clutch Market Size (US$ Mn) Forecast, by Country, 2017–2026
Table 24: North America Automotive Clutch Market Volume (Million Units) Forecast, by Country, 2017–2026
Table 25: U.S. Automotive Clutch Market Size (US$ Mn) Forecast, by Transmission, 2017–2026
Table 26: U.S. Automotive Clutch Market Volume (Million Units) Forecast, by Transmission, 2017–2026
Table 27: U.S. Automotive Clutch Market Size (US$ Mn) Forecast, by Clutch Type, 2017–2026
Table 28: U.S. Automotive Clutch Market Volume (Million Units) Forecast, by Clutch Type, 2017–2026
Table 29: U.S. Automotive Clutch Market Size (US$ Mn) Forecast, by Material Type, 2017–2026
Table 30: U.S. Automotive Clutch Market Volume (Million Units) Forecast, by Material Type, 2017–2026
Table 31: U.S. Automotive Clutch Market Size (US$ Mn) Forecast, by Vehicle Type, 2017–2026
Table 32: U.S. Automotive Clutch Market Volume (Million Units) Forecast, by Vehicle Type, 2017–2026
Table 33: Canada Automotive Clutch Market Size (US$ Mn) Forecast, by Transmission, 2017–2026
Table 34: Canada Automotive Clutch Market Volume (Mn Units) Forecast, by Transmission, 2017–2026
Table 35: Canada Automotive Clutch Market Size (US$ Mn) Forecast, by Clutch Type, 2017–2026
Table 36: Canada Automotive Clutch Market Volume (Units) Forecast, by Clutch Type, 2017–2026
Table 37: Canada Automotive Clutch Market Size (US$ Mn) Forecast, by Material Type, 2017–2026
Table 38: Canada Automotive Clutch Market Volume (Units) Forecast, by Material Type, 2017–2026
Table 39: Canada Automotive Clutch Market Size (US$ Mn) Forecast, by Vehicle Type, 2017–2026
Table 40: Canada Automotive Clutch Market Volume (Million Units) Forecast, by Vehicle Type, 2017–2026
Table 41: Europe Automotive Clutch Market Size (US$ Mn) Forecast, by Transmission, 2017–2026
Table 42: Europe Automotive Clutch Market Volume (Million Units) Forecast, by Transmission, 2017–2026
Table 43: Europe Automotive Clutch Market Size (US$ Mn) Forecast, by Clutch Type, 2017–2026
Table 44: Europe Automotive Clutch Market Volume (Million Units) Forecast, by Clutch Type, 2017–2026
Table 45: Europe Automotive Clutch Market Size (US$ Mn) Forecast, by Material Type, 2017–2026
Table 46: Europe Automotive Clutch Market Volume (Million Units) Forecast, by Material Type, 2017–2026
Table 47: Europe Automotive Clutch Market Size (US$ Mn) Forecast, by Sales Channel, 2017–2026
Table 48: Europe Automotive Clutch Market Volume (Million Units) Forecast, by Sales Channel, 2017–2026
Table 49: Europe Automotive Clutch Market Size (US$ Mn) Forecast, by Vehicle Type, 2017–2026
Table 50: Europe Automotive Clutch Market Volume (Million Units) Forecast, by Vehicle Type, 2017–2026
Table 51: Europe Automotive Clutch Market Size (US$ Mn) Forecast, by Country/Sub-region, 2017–2026
Table 52: Europe Automotive Clutch Market Volume (Million Units) Forecast, by Country/Sub-region, 2017–2026
Table 53: Germany Automotive Clutch Market Size (US$ Mn) Forecast, by Transmission, 2017–2026
Table 54: Germany Automotive Clutch Market Volume (Million Units) Forecast, by Transmission, 2017–2026
Table 55: Germany Automotive Clutch Market Size (US$ Mn) Forecast, by Clutch Type, 2017–2026
Table 56: Germany Automotive Clutch Market Volume (Million Units) Forecast, by Clutch Type, 2017–2026
Table 57: Germany Automotive Clutch Market Size (US$ Mn) Forecast, by Material Type, 2017–2026
Table 58: Germany Automotive Clutch Market Volume (Million Units) Forecast by Material Type, 2017–2026
Table 59: Germany Automotive Clutch Market Size (US$ Mn) Forecast, by Vehicle Type, 2017–2026
Table 60: Germany Automotive Clutch Market Volume (Million Units) Forecast, by Vehicle Type, 2017–2026
Table 61: U.K. Automotive Clutch Market Size (US$ Mn) Forecast, by Transmission, 2017–2026
Table 62: U.K. Automotive Clutch Market Volume (Million Units) Forecast, by Transmission, 2017–2026
Table 63: U.K. Automotive Clutch Market Size (US$ Mn) Forecast, by Clutch Type, 2017–2026
Table 64: U.K. Automotive Clutch Market Volume (Million Units) Forecast, by Clutch Type, 2017–2026
Table 65: U.K. Automotive Clutch Market Size (US$ Mn) Forecast, by Material Type, 2017–2026
Table 66: U.K. Automotive Clutch Market Volume (Million Units) Forecast, by Material Type, 2017–2026
Table 67: U.K. Automotive Clutch Market Size (US$ Mn) Forecast, by Vehicle Type, 2017–2026
Table 68: U.K. Automotive Clutch Market Volume (Million Units) Forecast, by Vehicle Type, 2017–2026
Table 69: France Automotive Clutch Market Size (US$ Mn) Forecast, by Transmission, 2017–2026
Table 70: France Automotive Clutch Market Volume (Million Units) Forecast, by Transmission, 2017–2026
Table 71: France Automotive Clutch Market Size (US$ Mn) Forecast, by Clutch Type, 2017–2026
Table 72: France Automotive Clutch Market Volume (Million Units) Forecast, by Clutch Type, 2017–2026
Table 73: France Automotive Clutch Market Size (US$ Mn) Forecast, by Material Type, 2017–2026
Table 74: France Automotive Clutch Market Volume (Million Units) Forecast, by Material Type, 2017–2026
Table 75: France Automotive Clutch Market Size (US$ Mn) Forecast, by Vehicle Type, 2017–2026
Table 76: France Automotive Clutch Market Volume (Million Units) Forecast, by Vehicle Type, 2017–2026
Table 77: Italy Automotive Clutch Market Size (US$ Mn) Forecast, by Transmission, 2017–2026
Table 78: Italy Automotive Clutch Market Volume (Million Units) Forecast, by Transmission, 2017–2026
Table 79: Italy Automotive Clutch Market Size (US$ Mn) Forecast, by Clutch Type, 2017–2026
Table 80: Italy Automotive Clutch Market Volume (Million Units) Forecast, by Clutch Type, 2017–2026
Table 81: Italy Automotive Clutch Market Size (US$ Mn) Forecast, by Material Type, 2017–2026
Table 82: Italy Automotive Clutch Market Volume (Million Units) Forecast, by Material Type, 2017–2026
Table 83: Italy Automotive Clutch Market Size (US$ Mn) Forecast, by Vehicle Type, 2017–2026
Table 84: Italy Automotive Clutch Market Volume (Millions Units) Forecast, by Vehicle Type, 2017–2026
Table 85: Spain Automotive Clutch Market Size (US$ Mn) Forecast, by Transmission, 2017–2026
Table 86: Spain Automotive Clutch Market Volume (Million Units) Forecast, by Transmission, 2017–2026
Table 87: Spain Automotive Clutch Market Size (US$ Mn) Forecast, by Clutch Type, 2017–2026
Table 88: Spain Automotive Clutch Market Volume (Million Units) Forecast, by Clutch Type, 2017–2026
Table 89: Spain Automotive Clutch Market Size (US$ Mn) Forecast, by Material Type, 2017–2026
Table 90: Spain Automotive Clutch Market Volume (Million Units) Forecast, by Material Type, 2017–2026
Table 91: Spain Automotive Clutch Market Size (US$ Mn) Forecast, by Vehicle Type, 2017–2026
Table 92: Spain Automotive Clutch Market Volume (Million Units) Forecast, by Vehicle Type, 2017–2026
Table 93: Rest of Europe Automotive Clutch Market Size (US$ Mn) Forecast, by Transmission, 2017–2026
Table 94: Rest of Europe Automotive Clutch Market Volume (Millions Units) Forecast, by Transmission, 2017–2026
Table 95: Rest of Europe Automotive Clutch Market Size (US$ Mn) Forecast, by Clutch, 2017–2026
Table 96: Rest of Europe Automotive Clutch Market Volume (Millions Units) Forecast, by Clutch Type, 2017–2026
Table 97: Rest of Europe Automotive Clutch Market Size (US$ Mn) Forecast, by Material Type, 2017–2026
Table 98: Rest of Europe Automotive Clutch Market Volume (Millions Units) Forecast, by Material Type, 2017–2026
Table 99: Rest of Europe Automotive Clutch Market Size (US$ Mn) Forecast, by Vehicle Type, 2017–2026
Table 100: Rest of Europe Automotive Clutch Market Volume (Million Units) Forecast, by Vehicle Type, 2017–2026
Table 101: Asia Pacific Automotive Clutch Market Size (US$ Mn) Forecast, by Transmission, 2017–2026
Table 102: Asia Pacific Automotive Clutch Market Volume (Million Units) Forecast, by Transmission, 2017–2026
Table 103: Asia Pacific Automotive Clutch Market Size (US$ Mn) Forecast, by Clutch Type, 2017–2026
Table 104: Asia Pacific Automotive Clutch Market Volume (Million Units) Forecast, by Clutch Type, 2017–2026
Table 105: Asia Pacific Automotive Clutch Market Size (US$ Mn) Forecast, by Material Type, 2017–2026
Table 106: Asia Pacific Automotive Clutch Market Volume (Million Units) Forecast, by Material Type, 2017–2026
Table 107: Asia Pacific Automotive Clutch Market Size (US$ Mn) Forecast, by Sales Channel Type, 2017–2026
Table 108: Asia Pacific Automotive Clutch Market Volume (Million Units) Forecast, by Sales Channel, 2017–2026
Table 109: Asia Pacific Automotive Clutch Market Size (US$ Mn) Forecast, by Vehicle Type, 2017–2026
Table 110: Asia Pacific Automotive Clutch Market Volume (Million Units) Forecast, by Vehicle Type, 2017–2026
Table 111: Asia Pacific Automotive Clutch Market Size (US$ Mn) Forecast, by Country/Sub-region, 2017–2026
Table 112: Asia Pacific Automotive Clutch Market, by Volume (Million Units) Forecast, by Country/Sub-region, 2017–2026
Table 113: China Automotive Clutch Market Size (US$ Mn) Forecast, by Transmission, 2017–2026
Table 114: China Automotive Clutch Market Volume (Million Units) Forecast, by Transmission, 2017–2026
Table 115: China Automotive Clutch Market Size (US$ Mn) Forecast, by Clutch Type, 2017–2026
Table 116: China Automotive Clutch Market Volume (Million Units) Forecast, by Clutch Type, 2017–2026
Table 117: China Automotive Clutch Market Size (US$ Mn) Forecast, by Material Type, 2017–2026
Table 118: China Automotive Clutch Market Volume (Million Units) Forecast, by Material Type, 2017–2026
Table 119: China Automotive Clutch Market Size (US$ Mn) Forecast, by Vehicle Type, 2017–2026
Table 120: China Automotive Clutch Market Volume (Million Units) Forecast, by Vehicle Type, 2017–2026
Table 121: India Automotive Clutch Market Size (US$ Mn) Forecast, by Transmission, 2017–2026
Table 122: India Automotive Clutch Market Volume (Million Units) Forecast, by Transmission, 2017–2026
Table 123: India Automotive Clutch Market Size (US$ Mn) Forecast, by Clutch Type, 2017–2026
Table 124: India Automotive Clutch Market Volume (Million Units) Forecast, by Clutch Type, 2017–2026
Table 125: India Automotive Clutch Market Size (US$ Mn) Forecast, by Material Type, 2017–2026
Table 126: India Automotive Clutch Market Volume (Million Units) Forecast, by Material Type, 2017–2026
Table 127: India Automotive Clutch Market Size (US$ Mn) Forecast, by Vehicle Type, 2017–2026
Table 128: India Automotive Clutch Market Volume (Million Units) Forecast, by Vehicle Type, 2017–2026
Table 129: Japan Automotive Clutch Market Size (US$ Mn) Forecast, by Transmission, 2017–2026
Table 130: Japan Automotive Clutch Market Volume (Million Units) Forecast, by Transmission, 2017–2026
Table 131: Japan Automotive Clutch Market Size (US$ Mn) Forecast, by Clutch Type, 2017–2026
Table 132: Japan Automotive Clutch Market Volume (Million Units) Forecast, by Clutch Type, 2017–2026
Table 133: Japan Automotive Clutch Market Size (US$ Mn) Forecast, by Material Type, 2017–2026
Table 134: Japan Automotive Clutch Market Volume (Million Units) Forecast, by Material Type, 2017–2026
Table 135: Japan Automotive Clutch Market Size (US$ Mn) Forecast, by Vehicle Type, 2017–2026
Table 136: Japan Automotive Clutch Market Volume (Million Units) Forecast, by Vehicle Type, 2017–2026
Table 137: ASEAN Automotive Clutch Market Size (US$ Mn) Forecast, by Transmission, 2017–2026
Table 138: ASEAN Automotive Clutch Market Volume (Million Units) Forecast, by Transmission, 2017–2026
Table 139: ASEAN Automotive Clutch Market Size (US$ Mn) Forecast, by Clutch Type, 2017–2026
Table 140: ASEAN Automotive Clutch Market Volume (Million Units) Forecast, by Clutch Type, 2017–2026
Table 141: ASEAN Automotive Clutch Market Size (US$ Mn) Forecast, by Material Type, 2017–2026
Table 142: ASEAN Automotive Clutch Market Volume (Million Units) Forecast, by Material Type, 2017–2026
Table 143: ASEAN Automotive Clutch Market Size (US$ Mn) Forecast, by Vehicle Type, 2017–2026
Table 144: ASEAN Automotive Clutch Market Volume (Million Units) Forecast, by Vehicle Type, 2017–2026
Table 145: Rest of Asia Pacific Automotive Clutch Market Size (US$ Mn) Forecast, by Transmission, 2017–2026
Table 146: Rest of Asia Pacific Automotive Clutch Market Volume (Million Units) Forecast, by Transmission, 2017–2026
Table 147: Rest of Asia Pacific Automotive Clutch Market Size (US$ Mn) Forecast, by Clutch Type, 2017–2026
Table 148: Rest of Asia Pacific Automotive Clutch Market Volume (Million Units) Forecast, by Clutch Type, 2017–2026
Table 149: Rest of Asia Pacific Automotive Clutch Market Size (US$ Mn) Forecast, by Material Type, 2017–2026
Table 150: Rest of Asia Pacific Automotive Clutch Market Volume (Million Units) Forecast, by Material Type, 2017–2026
Table 151: Rest of Asia Pacific Automotive Clutch Market Size (US$ Mn) Forecast, by Vehicle Type, 2017–2026
Table 152: Rest of Asia Pacific Automotive Clutch Market Volume (Million Units) Forecast, by Vehicle Type, 2017–2026
Table 111: Middle East & Africa Automotive Clutch Market Size (US$ Mn) Forecast, by Transmission, 2017–2026
Table 112: Middle East & Africa Automotive Clutch Market Volume (Million Units) Forecast, by Transmission, 2017–2026
Table 153: Middle East & Africa Automotive Clutch Market Size (US$ Mn) Forecast, by Clutch Type, 2017–2026
Table 154: Middle East & Africa Automotive Clutch Market Volume (Million Units) Forecast, by Clutch Type, 2017–2026
Table 155: Middle East & Africa Automotive Clutch Market Size (US$ Mn) Forecast, by Clutch Type, 2017–2026
Table 156: Middle East & Africa Automotive Clutch Market Volume (Million Units) Forecast, by Clutch Type, 2017–2026
Table 157: Middle East & Africa Automotive Clutch Market Size (US$ Mn) Forecast, by Sales Channel, 2017–2026
Table 158: Middle East & Africa Automotive Clutch Market Volume (Million Units) Forecast, by Sales Channel, 2017–2026
Table 159: Middle East & Africa Automotive Clutch Market Size (US$ Mn) Forecast, by Vehicle Type, 2017–2026
Table 160: Middle East & Africa Automotive Clutch Market Volume (Million Units) Forecast, by Vehicle Type, 2017–2026
Table 161: Middle East & Africa Automotive Clutch Market Size (US$ Mn) Forecast, by Country/Sub-region, 2017–2026
Table 162: Middle East & Africa Automotive Clutch Market Volume (Million Units) Forecast, by Country/Sub-region, 2017–2026
Table 163: GCC Automotive Clutch Market Size (US$ Mn) Forecast, by Transmission, 2017–2026
Table 164: GCC Automotive Clutch Market Volume (Million Units) Forecast, by Transmission, 2017–2026
Table 165: GCC Automotive Clutch Market Size (US$ Mn) Forecast, by Clutch Type, 2017–2026
Table 166: GCC Automotive Clutch Market Volume (Million Units) Forecast, by Clutch Type, 2017–2026
Table 167: GCC Automotive Clutch Market Size (US$ Mn) Forecast, by Material Type, 2017–2026
Table 168: GCC Automotive Clutch Market Volume (Million Units) Forecast, by Material Type, 2017–2026
Table 169: GCC Automotive Clutch Market Size (US$ Mn) Forecast, by Vehicle Type, 2017–2026
Table 170: GCC Automotive Clutch Market Volume (Million Units) Forecast, by Vehicle Type, 2017–2026
Table 171: South Africa Automotive Clutch Market Size (US$ Mn) Forecast, by Transmission, 2017–2026
Table 172: South Africa Automotive Clutch Market Volume (Million Units) Forecast, by Transmission, 2017–2026
Table 173: South Africa Automotive Clutch Market Size (US$ Mn) Forecast, by Clutch Type, 2017–2026
Table 174: South Africa Automotive Clutch Market Volume (Million Units) Forecast, by Clutch Type, 2017–2026
Table 175: South Africa Automotive Clutch Market Size (US$ Mn) Forecast, by Material Type, 2017–2026
Table 176: South Africa Automotive Clutch Market Volume (Million Units) Forecast, by Material Type, 2017–2026
Table 177: South Africa Automotive Clutch Market Size (US$ Mn) Forecast, by Vehicle Type, 2017–2026
Table 178: South Africa Automotive Clutch Market Volume (Million Units) Forecast, by Vehicle Type, 2017–2026
Table 179: Rest of MEA Automotive Clutch Market Size (US$ Mn) Forecast, by Transmission, 2017–2026
Table 180: Rest of MEA Automotive Clutch Market Volume (Million Units) Forecast, by Transmission, 2017–2026
Table 181: Rest of MEA Automotive Clutch Market Size (US$ Mn) Forecast, by Clutch Type, 2017–2026
Table 182: Rest of MEA Automotive Clutch Market Volume (Million Units) Forecast, by Clutch Type, 2017–2026
Table 183: Rest of MEA Automotive Clutch Market Size (US$ Mn) Forecast, by Material Type, 2017–2026
Table 184: Rest of MEA Automotive Clutch Market Volume (Million Units) Forecast, by Material Type, 2017–2026
Table 185: Rest of MEA Automotive Clutch Market Size (US$ Mn) Forecast, by Vehicle Type, 2017–2026
Table 186: Rest of MEA Automotive Clutch Market Volume (Million Units) Forecast, by Vehicle Type, 2017–2026
Table 187: Latin America Automotive Clutch Market Size (US$ Mn) Forecast, by Transmission, 2017–2026
Table 188: Latin America Automotive Clutch Market Volume (Million Units) Forecast, by Transmission, 2017–2026
Table 189: Latin America Automotive Clutch Market Size (US$ Mn) Forecast, by Clutch Type, 2017–2026
Table 190: Latin America Automotive Clutch Market Volume (Million Units) Forecast, by Clutch Type, 2017–2026
Table 191: Latin America Automotive Clutch Market Size (US$ Mn) Forecast, by Material Type, 2017–2026
Table 192: Latin America Automotive Clutch Market Volume (Million Units) Forecast, by Material Type, 2017–2026
Table 193: Latin America Automotive Clutch Market Size (US$ Mn) Forecast, by Sales Channel, 2017–2026
Table 194: Latin America Automotive Clutch Market Volume (Million Units) Forecast, by Sales Channel, 2017–2026
Table 195: Latin America Automotive Clutch Market Size (US$ Mn) Forecast, by Vehicle Type, 2017–2026
Table 196: Latin America Automotive Clutch Market Volume (Million Units) Forecast, by Vehicle Type, 2017–2026
Table 197: Latin America Automotive Clutch Market Size (US$ Mn) Forecast, by Country/Sub-region, 2017–2026
Table 198: Latin America Automotive Clutch Market Volume (Million Units) Forecast, by Country and Sub-Regions, 2017–2026
Table 199: Mexico Automotive Clutch Market Size (US$ Mn) Forecast, by Transmission, 2017–2026
Table 200: Mexico Automotive Clutch Market Volume (Million Units) Forecast, by Transmission, 2017–2026
Table 201: Mexico Automotive Clutch Market Size (US$ Mn) Forecast, by Clutch, 2017–2026
Table 202: Mexico Automotive Clutch Market Volume (Million Units) Forecast, by Clutch, 2017–2026
Table 203: Mexico Automotive Clutch Market Size (US$ Mn) Forecast, by Material, 2017–2026
Table 204: Mexico Automotive Clutch Market Volume (Million Units) Forecast, by Material, 2017–2026
Table 205: Mexico Automotive Clutch Market Size (US$ Mn) Forecast, by Vehicle Type, 2017–2026
Table 206: Mexico Automotive Clutch Market Volume (Million Units) Forecast, by Vehicle Type, 2017–2026
Table 207: Brazil Automotive Clutch Market Size (US$ Mn) Forecast, by Transmission, 2017–2026
Table 208: Brazil Automotive Clutch Market Volume (Million Units) Forecast, by Transmission, 2017–2026
Table 209: Brazil Automotive Clutch Market Size (US$ Mn) Forecast, by Clutch Type, 2017–2026
Table 210: Brazil Automotive Clutch Market Volume (Million Units) Forecast, by Clutch Type, 2017–2026
Table 211: Brazil Automotive Clutch Market Size (US$ Mn) Forecast, by Material Type, 2017–2026
Table 212: Brazil Automotive Clutch Market Volume (Million Units) Forecast, by Material Type, 2017–2026
Table 213: Brazil Automotive Clutch Market Size (US$ Mn) Forecast, by Vehicle Type, 2017–2026
Table 214: Brazil Automotive Clutch Market Volume (Million Units) Forecast, by Vehicle Type, 2017–2026
Table 215: Rest of Latin America Automotive Clutch Market Size (US$ Mn) Forecast, by Transmission, 2017–2026
Table 216: Rest of Latin America Automotive Clutch Market Volume (Million Units) Forecast, by Transmission, 2017–2026
Table 217: Rest of Latin America Automotive Clutch Market Size (US$ Mn) Forecast, by Clutch Type, 2017–2026
Table 218: Rest of Latin America Automotive Clutch Market Volume (Million Units) Forecast, by Clutch Type, 2017–2026
Table 219: Rest of Latin America Automotive Clutch Market Size (US$ Mn) Forecast, by Material Type, 2017–2026
Table 220: Rest of Latin America Automotive Clutch Market Volume (Million Units) Forecast, by Material Type, 2017–2026
Table 221: Rest of Latin America Automotive Clutch Market Size (US$ Mn) Forecast, by Vehicle Type, 2017–2026
Table 222: Rest of Latin America Automotive Clutch Market Volume (Million Units) Forecast, by Vehicle Type, 2017–2026
List of Figures
Figure 1: Global Automotive Clutch Market Snapshot
Figure 2: Global Automotive Clutch Market Size (US$ Mn) and (Million Units) Forecast, 2017–2026
Figure 3: Global Automotive Clutch Market, Y-o-Y Growth (%), 2017–2026
Figure 4: Global Automotive Clutch Market Value Share Analysis (US$ Mn), by Transmission, 2017 and 2026
Figure 5: Global Manual Transmission Segment Volume (Million Units) Value (US$ Mn) Forecast, 2017–2026
Figure 6: Global Automatic Transmission Segment Volume (Million Units) Value (US$ Mn) Forecast, 2017–2026
Figure 7: Global Dual Clutch Transmission Segment Volume (Million Units) Value (US$ Mn) Forecast, 2017–2026
Figure 8: Global Automated Manual Transmission Segment Volume (Million Units) Value (US$ Mn) Forecast, 2017–2026
Figure 9: Global Transmission Others Segment, by Volume (Million Units) & Value (US$ Mn) Forecast 2017–2026
Figure 10: Global Automotive Clutch Market Attractiveness Analysis, by Transmission
Figure 11: Global Automotive Clutch Market Value Share Analysis, by Clutch Type, 2017 and 2026
Figure 12: Global Dry clutch Segment Volume (Million Units) Value (US$ Mn) Forecast, 2017–2026
Figure 13: Global Wet Clutch Segment Volume (Million Units) Value (US$ Mn) Forecast, 2017–2026
Figure 14: Global Automotive Clutch Market Attractiveness Analysis, by Clutch Type
Figure 15: Global Automotive Clutch Market Value Share Analysis (US$ Mn), by Material Type, 2017 and 2026
Figure 16: Global Organic Material Segment Volume (Million Units) Value (US$ Mn) Forecast, 2017–2026
Figure 17: Global Ceramic Material Segment Volume (Million Units) Value (US$ Mn) Forecast, 2017–2026
Figure 18: Global Transmission Segment, by Volume (Million Units) & Value (US$ Mn) Forecast 2017–2026
Figure 19: Global Automotive Clutch Market Attractiveness Analysis, by Material Type
Figure 20: Global Automotive Clutch Market Value Share Analysis, by Vehicle Type, 2017 and 2026
Figure 21: Global Passenger Vehicle Segment, by Volume (Million Units) & Value (US$ Mn) Forecast 2017–2026
Figure 22: Global Commercial Vehicle Segment, by Volume (Million Units) & Value (US$ Mn) Forecast 2017–2026
Figure 23: Global Automotive Clutch Market Attractiveness Analysis, by Vehicle Type
Figure 24: Global Automotive Clutch Market Value Share Analysis, by Sales Channel Type, 2017 and 2026
Figure 25: Global OEM Segment, by Volume (Million Units) & Value (US$ Mn) Forecast 2017–2026
Figure 26: Global Aftermarket Segment, by Volume (Million Units) & Value (US$ Mn) Forecast 2017–2026
Figure 27: Global Automotive Clutch Market Attractiveness Analysis, by Sales Channel
Figure 28: Global Automotive Clutch Market Value Share Analysis, by Region, 2017 and 2026
Figure 29: Global Automotive Clutch Market Attractiveness Analysis, by Region
Figure 30: North America Automotive Clutch Market Size (US$ Mn) and Volume (Million Units) Forecast, 2017–2026
Figure 31: North America Automotive Clutch Market Attractiveness Analysis, by Country
Figure 32: North America Automotive Clutch Market Value Share Analysis, by Transmission, 2017 and 2026
Figure 33: North America Automotive Clutch Market Value Share Analysis, by Clutch Type, 2017 and 2026
Figure 34: North America Automotive Clutch Market Value Share Analysis, by Material Type, 2017 and 2026
Figure 35: North America Automotive Clutch Market Value Share Analysis, by Sales Channel, 2017 and 2026
Figure 36: North America Automotive Clutch Market Value Share Analysis, by Vehicle Type, 2017 and 2026
Figure 37: North America Automotive Clutch Market Value Share Analysis, by Country, 2017 and 2026
Figure 38: North America Market Attractiveness Analysis, by Transmission
Figure 39: North America Market Attractiveness Analysis, by Vehicle Type
Figure 40: North America Automotive Clutch Market Attractiveness Analysis, by Clutch Type
Figure 41: North America Automotive Clutch Market Attractiveness Analysis, by Material Type
Figure 42: North America Automotive Clutch Market Attractiveness Analysis, by sales Channel
Figure 43: Europe Automotive Clutch Market Size (US$ Mn) and Volume (Million Units) Forecast, 2017–2026
Figure 44: Europe Automotive Clutch Market Attractiveness Analysis, by Country/Sub-region
Figure 45: Europe Automotive Clutch Market Value Share Analysis, by Transmission, 2017 and 2026
Figure 46: Europe Automotive Clutch Market Value Share Analysis, by Clutch Type, 2017 and 2026
Figure 47: Europe Automotive Clutch Market Value Share Analysis, by Material Type, 2017 and 2026
Figure 48: Europe Automotive Clutch Market Value Share Analysis, by Sales Channel, 2017 and 2026
Figure 49: Europe Automotive Clutch Market Value Share Analysis, by Vehicle Type, 2017 and 2026
Figure 50: Europe Automotive Clutch Market Value Share Analysis, by Country/Sub-region, 2017 and 2026
Figure 51: Europe Automotive Clutch Market Attractiveness Analysis, by Transmission
Figure 52: Europe Automotive Clutch Market Attractiveness Analysis, by Clutch Type
Figure 53: Europe Automotive Clutch Market Attractiveness Analysis, by Material Type
Figure 54: Europe Automotive Clutch Market Attractiveness Analysis, by Vehicle Type
Figure 55: Asia Pacific Automotive Clutch Market Size (US$ Mn) and Volume (Million Units) Forecast, 2017–2026
Figure 56: Asia Pacific Automotive Clutch Market Attractiveness Analysis, by Country/Sub-region
Figure 57: Asia Pacific Automotive Clutch Market Value Share Analysis, by Transmission, 2017 and 2026
Figure 58: Asia Pacific Automotive Clutch Market Value Share Analysis, by Clutch Type, 2017 and 2026
Figure 59: Asia Pacific Automotive Clutch Market Value Share Analysis, by Material Type, 2017 and 2026
Figure 60: Asia Pacific Automotive Clutch Market Value Share Analysis, by Sales Channel, 2017 and 2026
Figure 61: Asia Pacific Automotive Clutch Market Value Share Analysis, by Vehicle Type, 2017 and 2026
Figure 62: Asia Pacific Automotive Clutch Market Value Share Analysis, by Country/Sub-region, 2017 and 2026
Figure 63: Asia Pacific Automotive Clutch Market Attractiveness Analysis, by Transmission
Figure 64: Asia Pacific Automotive Clutch Market Attractiveness Analysis, by Clutch Type
Figure 65: Asia Pacific Automotive Clutch Market Attractiveness Analysis, by Material Type
Figure 66: Asia Pacific Automotive Clutch Market Attractiveness Analysis, by Vehicle Type
Figure 67: Middle East & Africa Automotive Clutch Market Size (US$ Mn) and Volume (Million Units) Forecast, 2017–2026
Figure 68: Middle East & Africa Automotive Clutch Market Attractiveness Analysis, by Country/Sub-region
Figure 69: Middle East & Africa Automotive Clutch Market Value Share Analysis, by Transmission, 2017 and 2026
Figure 70: Middle East & Africa Automotive Clutch Market Value Share Analysis, by Clutch Type, 2017 and 2026
Figure 71: Middle East & Africa Automotive Clutch Market Value Share Analysis, by Material Type, 2017 and 2026
Figure 72: Middle East & Africa Automotive Clutch Market Value Share Analysis, by Sales Channel, 2017 and 2026
Figure 73: Middle East & Africa Automotive Clutch Market Value Share Analysis, by Vehicle Type, 2017 and 2026
Figure 74: Middle East & Africa Automotive Clutch Market Value Share Analysis, by Country/Sub-region, 2017 and 2026
Figure 75: Middle East and Africa Automotive Clutch Market Attractiveness Analysis, by Transmission
Figure 76: Middle East and Africa Automotive Clutch Market Attractiveness Analysis, by Clutch Type
Figure 77: Middle East and Africa Automotive Clutch Market Attractiveness Analysis, by Material Type
Figure 78: Middle East and Africa Automotive Clutch Market Attractiveness Analysis, by Sales Channel
Figure 79: Middle East & Africa Automotive Clutch Market Attractiveness Analysis, by Vehicle Type
Figure 80: Latin America Automotive Clutch Market Size (US$ Mn) and Volume (Million Units) Forecast, 2017–2026
Figure 81: Latin America Automotive Clutch Market Attractiveness Analysis, by Country/Sub-region
Figure 82: Latin America Automotive Clutch Market Value Share Analysis, by Transmission, 2017 and 2026
Figure 83: Latin America Automotive Clutch Market Value Share Analysis, by Clutch Type, 2017 and 2026
Figure 84: Latin America Automotive Clutch Market Value Share Analysis, by Material Type, 2017 and 2026
Figure 85: Latin America Automotive Clutch Market Value Share Analysis, by Sales Channel, 2017 and 2026
Figure 86: Latin America Automotive Clutch Market Value Share Analysis, by Vehicle Type, 2017 and 2026
Figure 87: Latin America Automotive Clutch Market Value Share Analysis, by Country/Sub-region, 2017 and 2026
Figure 88: Latin America Automotive Clutch Market Attractiveness Analysis, by Vehicle Types
Figure 89: Latin America Automotive Clutch Market Attractiveness Analysis, by Transmission
Figure 90: Latin America Automotive Clutch Market Attractiveness Analysis, by Material Type
Figure 91: Latin America Automotive Clutch Market Attractiveness Analysis, by Clutch Type
Figure 92: Latin America Automotive Clutch Market Attractiveness Analysis, by Sales Channel
Copyright © Transparency Market Research, Inc. All Rights reserved
Trust Online

Clutch Market