
Reports
Reports
Surfactants Market – An Overview
Organic compounds, derived from oleo chemical raw materials or petrochemical raw materials, the surface active agents or surfactants are use for thro properties such as foaming/defoaming, solvency, dispersion, and emulsification. Besides, its lubricity also adds to its popularity. Known to be extensively used in personal care products, these are superior cleaners. Additionally, these are also used in paints and coatings, and emulsion and polymerization.
Over the forecast period of 2015 to 2024, the surfactants market in the Asia Pacific is sett to chart a moderate yet solid growth rate, helping create new opportunities and generate a higher market worth.
Factors – trends and drivers – that are deemed significant in the market are elaborated upon below.
Asia Pacific Surfactants Market: Overview
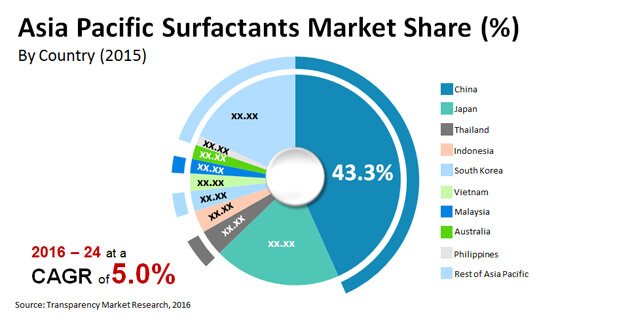
Surfactants or surface active agents are organic compounds that are manufactured using petrochemical raw materials such as ethylene and benzene or oleo-chemical raw materials such as coconut oil or palm oil. Surfactants are primarily used for their properties such as emulsification, dispersion, solvency, foaming/de-foaming and lubricity of water-based compositions. Owing to these reasons, surfactants are being used in a wide range of personal care products, paints and coatings, and emulsion polymerization. The research report states that the Asia Pacific surfactants market was valued at US$4.1 bn in 2015 and is expected to be worth US$6.3 bn by the end of 2024. Between the forecast years of 2016 and 2024, the overall market is expected to surge at a CAGR of 5.0%.
Growing Demand for Beauty Products Ensures Steady Uptake of Surfactants in Asia Pacific Market
The Asia Pacific surfactants market is expected to benefit from the flourishing personal care industry and the increasing demand for emulsion polymerization. The growing concerns pertaining to beauty, hygiene, and aesthetics have led to a skyrocketing demand for surfactants in the personal care industry in Asia Pacific. The regional market is also being fueled due to improving per capita incomes of consumers, changing lifestyles, and rise in the standard of living. Furthermore, the upstream integration with raw material suppliers and the expanding geographical reach is also expected to offer lucrative opportunities to manufacturers of emulsion polymers.
On the basis of product type, the Asia Pacific surfactant market is segmented into cationic, anionic, non ionic, and amphoteric product types. The non ionic surfactants held a dominant share in the overall market in 2015 in terms of volume. This segment accounted for nearly 30% of the overall market in 2015 due to their increasing adoption in the production of agrochemicals, paints and coatings, and concrete. During the forecast period, cationic and amphoteric surfactants are also expected to show steady growth as they have a higher purity and are thus expensive than their counterparts.
China Poised to Dominate Asia Pacific Surfactants Market as Key Consumer and Producer
The Asia Pacific surfactants market is segmented in countries such as China, India, Japan, Thailand, South Korea, Indonesia, Malaysia, Vietnam, Philippines, South Korea, and Australia. Of these, China is expected to dominate the Asia Pacific surfactants market. As of 2015, China accounted for a share of about 45% in the overall market in terms of volume. The phenomenal demand for and production of paints and coatings has put China in the lead. Japan followed this lead closely as it has been assessed to be the leading market for personal care products across the globe. The improving per capita incomes in Asia Pacific, emerging economies, and rising chemicals industry is expected to boost the demand for surfactants in these countries throughout the forecast period.
Key players operating in the global surfactants market ADM, Akzo Nobel N. V., Galaxy Surfactants, Dow Chemical, BASF S.E, Huntsman Corporation, Lonza Group, Evonik Industries, P & G Chemicals, Clariant International Ltd., and Stepan Company. The competition in the Asia Pacific surfactants market is quite fragmented. Companies are expected to focus on expanding their facilities and working on product innovation to ensure that they stay ahead of the competition. Most of these players are also expected to focus on development of bio-based surfactants as consumers are realizing the adverse effects of using chemical ones.
1. Preface
1.1. Report Scope and Market Segmentation
1.2. Research Highlights
2. Assumptions and Research Methodology
2.1. Assumptions and Acronyms Used
2.2. Research Methodology
3. Executive Summary
3.1. Market Size, Indicative (US$ Mn)
3.2. Top Trends
4. Market Overview
4.1. Surfactants Market Overview
4.2. Market Indicators
4.3. Drivers and Restraints Analysis
4.3.1. Drivers
4.3.2. Restraints
4.3.3. Opportunities
4.4. Asia Pacific Surfactants Market Price Range Analysis, 2015
4.5. Porter’s Analysis
4.5.1. Threat of Substitutes
4.5.2. Bargaining Power of Buyers
4.5.3. Bargaining Power of Suppliers
4.5.4. Threat of New Entrants
4.5.5. Degree of Competition
4.6. Value Chain Analysis
5. Surfactants Market Analysis, by Product
5.1. Key Findings
5.2. Introduction
5.3. Surfactants Market Value Share Analysis, by Product
5.4. Surfactants Market Forecast, by Product
5.4.1. Cationic, 2015 – 2024
5.4.2. Anionic, 2015 – 2024
5.4.3. Amphoteric, 2015 – 2024
5.4.4. Non ionic, 2015 – 2024
5.4.5. Others, 2015 – 2024
6. Surfactants Market Analysis, by Application
6.1. Key Findings
6.2. Introduction
6.3. Surfactants Market Value Share Analysis, by Application
6.4. Surfactants Market Forecast, by Application
6.4.1. Personal Care, 2015 – 2024
6.4.2. Oilfield Chemicals, 2015 – 2024
6.4.3. Paints & Coatings, 2015 – 2024
6.4.4. Emulsion Polymerization, 2015 – 2024
6.4.5. Agrochemicals, 2015 – 2024
6.4.6. Concrete Additives, 2015 – 2024
7. Surfactants Market Analysis, by Country
7.1. Key Findings
7.2. Surfactants Market Value Share Analysis, by Country
7.3. Surfactants Market Forecast, by Country
7.3.1. China
7.3.2. Japan
7.3.3. Indonesia
7.3.4. Malaysia
7.3.5. Thailand
7.3.6. Vietnam
7.3.7. Philippines
7.3.8. South Korea
7.3.9. Australia
7.4. Market Attractiveness Analysis, by Country
8. South Korea Surfactants Market Analysis
8.1. Key Findings
8.2. South Korea Surfactants Market Value Share Analysis, by Product
8.3. South Korea Surfactants Market Forecast, by Product
8.3.1. Cationic, 2015 – 2024
8.3.2. Anionic, 2015 – 2024
8.3.3. Amphoteric, 2015 – 2024
8.3.4. Non ionic, 2015 – 2024
8.3.5. Others, 2015 – 2024
8.4. South Korea Surfactants Market Value Share Analysis, by Application
8.5. South Korea Surfactants Market Forecast, by Application
8.5.1. Personal Care, 2015 – 2024
8.5.2. Oilfield Chemicals, 2015 – 2024
8.5.3. Paints & Coatings, 2015 – 2024
8.5.4. Emulsion Polymerization, 2015 – 2024
8.5.5. Agrochemicals, 2015 – 2024
8.5.6. Concrete Additives, 2015 – 2024
8.6. South Korea Market Outlook, By Application
8.6.1. Personal Care
8.6.2. Oilfield Chemicals
8.6.3. Paints & Coatings
8.6.4. Emulsion Polymerization
8.6.5. Agrochemicals
8.6.6. Concrete Additives
9. Japan Surfactants Market Analysis
9.1. Key Findings
9.2. Japan Surfactants Market Value Share Analysis, by Product
9.3. Japan Surfactants Market Forecast, by Product
9.3.1. Cationic, 2015 – 2024
9.3.2. Anionic, 2015 – 2024
9.3.3. Amphoteric, 2015 – 2024
9.3.4. Non ionic, 2015 – 2024
9.3.5. Others, 2015 – 2024
9.4. Japan Surfactants Market Value Share Analysis, by Application
9.5. Japan Surfactants Market Forecast, by Application
9.5.1. Personal Care, 2015 – 2024
9.5.2. Oilfield Chemicals, 2015 – 2024
9.5.3. Paints & Coatings, 2015 – 2024
9.5.4. Emulsion Polymerization, 2015 – 2024
9.5.5. Agrochemicals, 2015 – 2024
9.5.6. Concrete Additives, 2015 – 2024
9.6. Japan Market Outlook, By Application
9.6.1. Personal Care
9.6.2. Oilfield Chemicals
9.6.3. Paints & Coatings
9.6.4. Emulsion Polymerization
9.6.5. Agrochemicals
9.6.6. Concrete Additives
10. China Surfactants Market Analysis
10.1. Key Findings
10.2. China Surfactants Market Value Share Analysis, by Product
10.3. China Surfactants Market Forecast, by Product
10.3.1. Cationic, 2015 – 2024
10.3.2. Anionic, 2015 – 2024
10.3.3. Amphoteric, 2015 – 2024
10.3.4. Non ionic, 2015 – 2024
10.3.5. Others, 2015 – 2024
10.4. China Surfactants Market Value Share Analysis, by Application
10.5. China Surfactants Market Forecast, by Application
10.5.1. Personal Care, 2015 – 2024
10.5.2. Oilfield Chemicals, 2015 – 2024
10.5.3. Paints & Coatings, 2015 – 2024
10.5.4. Emulsion Polymerization, 2015 – 2024
10.5.5. Agrochemicals, 2015 – 2024
10.5.6. Concrete Additives, 2015 – 2024
10.6. China Market Outlook, By Application
10.6.1. Personal Care
10.6.2. Oilfield Chemicals
10.6.3. Paints & Coatings
10.6.4. Emulsion Polymerization
10.6.5. Agrochemicals
10.6.6. Concrete Additives
11. Indonesia Surfactants Market Analysis
11.1. Key Findings
11.2. Indonesia Surfactants Market Value Share Analysis, by Product
11.3. Indonesia Surfactants Market Forecast, by Product
11.3.1. Cationic, 2015 – 2024
11.3.2. Anionic, 2015 – 2024
11.3.3. Amphoteric, 2015 – 2024
11.3.4. Non ionic, 2015 – 2024
11.3.5. Others, 2015 – 2024
11.4. Indonesia Surfactants Market Value Share Analysis, by Application
11.5. Indonesia Surfactants Market Forecast, by Application
11.5.1. Personal Care, 2015 – 2024
11.5.2. Oilfield Chemicals, 2015 – 2024
11.5.3. Paints & Coatings, 2015 – 2024
11.5.4. Emulsion Polymerization, 2015 – 2024
11.5.5. Agrochemicals, 2015 – 2024
11.5.6. Concrete Additives, 2015 – 2024
11.6. Indonesia Market Outlook, By Application
11.6.1. Personal Care
11.6.2. Oilfield Chemicals
11.6.3. Paints & Coatings
11.6.4. Emulsion Polymerization
11.6.5. Agrochemicals
11.6.6. Concrete Additives
12. South Korea Surfactants Market Analysis
12.1. Key Findings
12.2. Malaysia Surfactants Market Value Share Analysis, by Product
12.3. Malaysia Surfactants Market Forecast, by Product
12.3.1. Cationic, 2015 – 2024
12.3.2. Anionic, 2015 – 2024
12.3.3. Amphoteric, 2015 – 2024
12.3.4. Non ionic, 2015 – 2024
12.3.5. Others, 2015 – 2024
12.4. Malaysia Surfactants Market Value Share Analysis, by Application
12.5. Malaysia Surfactants Market Forecast, by Application
12.5.1. Personal Care, 2015 – 2024
12.5.2. Oilfield Chemicals, 2015 – 2024
12.5.3. Paints & Coatings, 2015 – 2024
12.5.4. Emulsion Polymerization, 2015 – 2024
12.5.5. Agrochemicals, 2015 – 2024
12.5.6. Concrete Additives, 2015 – 2024
12.6. Malaysia Market Outlook, By Application
12.6.1. Personal Care
12.6.2. Oilfield Chemicals
12.6.3. Paints & Coatings
12.6.4. Emulsion Polymerization
12.6.5. Agrochemicals
12.6.6. Concrete Additives
13. Thailand Surfactants Market Analysis
13.1. Key Findings
13.2. Thailand Surfactants Market Value Share Analysis, by Product
13.3. Thailand Surfactants Market Forecast, by Product
13.3.1. Cationic, 2015 – 2024
13.3.2. Anionic, 2015 – 2024
13.3.3. Amphoteric, 2015 – 2024
13.3.4. Non ionic, 2015 – 2024
13.3.5. Others, 2015 – 2024
13.4. Thailand Surfactants Market Value Share Analysis, by Application
13.5. Thailand Surfactants Market Forecast, by Application
13.5.1. Personal Care, 2015 – 2024
13.5.2. Oilfield Chemicals, 2015 – 2024
13.5.3. Paints & Coatings, 2015 – 2024
13.5.4. Emulsion Polymerization, 2015 – 2024
13.5.5. Agrochemicals, 2015 – 2024
13.5.6. Concrete Additives, 2015 – 2024
13.6. Thailand Market Outlook, By Application
13.6.1. Personal Care
13.6.2. Oilfield Chemicals
13.6.3. Paints & Coatings
13.6.4. Emulsion Polymerization
13.6.5. Agrochemicals
13.6.6. Concrete Additives
14. Vietnam Surfactants Market Analysis
14.1. Key Findings
14.2. Vietnam Surfactants Market Value Share Analysis, by Product
14.3. Vietnam Surfactants Market Forecast, by Product
14.3.1. Cationic, 2015 – 2024
14.3.2. Anionic, 2015 – 2024
14.3.3. Amphoteric, 2015 – 2024
14.3.4. Non ionic, 2015 – 2024
14.3.5. Others, 2015 – 2024
14.4. Vietnam Surfactants Market Value Share Analysis, by Application
14.5. Vietnam Surfactants Market Forecast, by Application
14.5.1. Personal Care, 2015 – 2024
14.5.2. Oilfield Chemicals, 2015 – 2024
14.5.3. Paints & Coatings, 2015 – 2024
14.5.4. Emulsion Polymerization, 2015 – 2024
14.5.5. Agrochemicals, 2015 – 2024
14.5.6. Concrete Additives, 2015 – 2024
14.6. Vietnam Market Outlook, By Application
14.6.1. Personal Care
14.6.2. Oilfield Chemicals
14.6.3. Paints & Coatings
14.6.4. Emulsion Polymerization
14.6.5. Agrochemicals
14.6.6. Concrete Additives
15. Australia Surfactants Market Analysis
15.1. Key Findings
15.2. Australia Surfactants Market Value Share Analysis, by Product
15.3. Australia Surfactants Market Forecast, by Product
15.3.1. Cationic, 2015 – 2024
15.3.2. Anionic, 2015 – 2024
15.3.3. Amphoteric, 2015 – 2024
15.3.4. Non ionic, 2015 – 2024
15.3.5. Others, 2015 – 2024
15.4. Australia Surfactants Market Value Share Analysis, by Application
15.5. Australia Surfactants Market Forecast, by Application
15.5.1. Personal Care, 2015 – 2024
15.5.2. Oilfield Chemicals, 2015 – 2024
15.5.3. Paints & Coatings, 2015 – 2024
15.5.4. Emulsion Polymerization, 2015 – 2024
15.5.5. Agrochemicals, 2015 – 2024
15.5.6. Concrete Additives, 2015 – 2024
15.6. Australia Market Outlook, By Application
15.6.1. Personal Care
15.6.2. Oilfield Chemicals
15.6.3. Paints & Coatings
15.6.4. Emulsion Polymerization
15.6.5. Agrochemicals
15.6.6. Concrete Additives
16. Philippines Surfactants Market Analysis
16.1. Key Findings
16.2. Philippines Surfactants Market Value Share Analysis, by Product
16.3. Philippines Surfactants Market Forecast, by Product
16.3.1. Cationic, 2015 – 2024
16.3.2. Anionic, 2015 – 2024
16.3.3. Amphoteric, 2015 – 2024
16.3.4. Non ionic, 2015 – 2024
16.3.5. Others, 2015 – 2024
16.4. Philippines Surfactants Market Value Share Analysis, by Application
16.5. Philippines Surfactants Market Forecast, by Application
16.5.1. Personal Care, 2015 – 2024
16.5.2. Oilfield Chemicals, 2015 – 2024
16.5.3. Paints & Coatings, 2015 – 2024
16.5.4. Emulsion Polymerization, 2015 – 2024
16.5.5. Agrochemicals, 2015 – 2024
16.5.6. Concrete Additives, 2015 – 2024
16.6. Philippines Market Outlook, By Application
16.6.1. Personal Care
16.6.2. Oilfield Chemicals
16.6.3. Paints & Coatings
16.6.4. Emulsion Polymerization
16.6.5. Agrochemicals
16.6.6. Concrete Additives
17. Competition Landscape
17.1. Company Profiles
17.1.1. The Dow Chemical Company
17.1.1.1. Company Description
17.1.1.2. Business Overview
17.1.1.3. SWOT Analysis
17.1.1.4. Financial Details
17.1.1.5. Strategic Overview
17.1.2. Archer Daniels Midland Company
17.1.2.1. Company Description
17.1.2.2. Business Overview
17.1.2.3. SWOT Analysis
17.1.2.4. Financial Details
17.1.2.5. Strategic Overview
17.1.3. Akzo Nobel N.V.
17.1.3.1. Company Description
17.1.3.2. Business Overview
17.1.3.3. Strategic Overview
17.1.4. Galaxy Surfactants Limited
17.1.4.1. Company Description
17.1.4.2. Business Overview
17.1.4.3. SWOT Analysis
17.1.4.4. Financial Details
17.1.4.5. Strategic Overview
17.1.5. BASF SE
17.1.5.1. Company Description
17.1.5.2. Business Overview
17.1.5.3. SWOT Analysis
17.1.5.4. Financial Details
17.1.5.5. Strategic Overview
17.1.6. Huntsman Corporation
17.1.6.1. Company Description
17.1.6.2. Business Overview
17.1.6.3. Strategic Overview
17.1.7. Evonik Industries AG
17.1.7.1. Company Description
17.1.7.2. Business Overview
17.1.7.3. Strategic Overview
17.1.8. P&G Chemicals
17.1.8.1. Company Description
17.1.8.2. Business Overview
17.1.8.3. Strategic Overview
17.1.9. Lonza Group
17.1.9.1. Company Description
17.1.9.2. Business Overview
17.1.9.3. Strategic Overview
17.1.10. Clariant
17.1.10.1. Company Description
17.1.10.2. Business Overview
17.1.10.3. Strategic Overview
17.1.11. Stepan Company
17.1.11.1. Company Description
17.1.11.2. Business Overview
17.1.11.3. Strategic Overview
List of Tables
Table 1 Asia Pacific Surfactants Market Size (US$ Mn) and Volume (Tons) Forecast, by Product Type, 2015–2024
Table 2 Asia Pacific Surfactants Market Size (US$ Mn) and Volume (Tons) Forecast, by Application, 2015–2024
Table 3 Asia Pacific Surfactants Market Size (US$ Mn) and Volume (Tons) Forecast, by Application, 2015–2024
Table 4 Asia Pacific Surfactants Market Size (US$ Mn) and Volume (Tons) Forecast, by Country, 2015–2024
Table 5 Asia Pacific Surfactants Market Size (US$ Mn) and Volume (Tons) Forecast, by Country, 2015–2024
Table 6 South Korea Surfactants Market Size (US$ Mn) and Volume (Tons) Forecast, by Product Type, 2015–2024
Table 7 South Korea Surfactants Market Size (US$ Mn) and Volume (Tons) Forecast, by Application, 2015–2024
Table 8 Japan Surfactants Market Size (US$ Mn) and Volume (Tons) Forecast, by Product Type, 2015–2024
Table 9 Japan Surfactants Market Size (US$ Mn) and Volume (Tons) Forecast, by Application, 2015–2024
Table 10 China Surfactants Market Size (US$ Mn) and Volume (Tons) Forecast, by Product Type, 2015–2024
Table 11 China Surfactants Market Size (US$ Mn) and Volume (Tons) Forecast, by Application, 2015–2024
Table 12 China Surfactants Market Size (US$ Mn) and Volume (Tons) Forecast, by Application, 2015–2024
Table 13 Indonesia Surfactants Market Size (US$ Mn) and Volume (Tons) Forecast, by Product Type, 2015–2024
Table 14 Indonesia Surfactants Market Size (US$ Mn) and Volume (Tons) Forecast, by Application, 2015–2024
Table 15 Indonesia Surfactants Market Size (US$ Mn) and Volume (Tons) Forecast, By Application, 2015–2024
Table 16 Malaysia Surfactants Market Size (US$ Mn) and Volume (Tons) Forecast, by Product Type, 2015–2024
Table 17 Malaysia Surfactants Market Size (US$ Mn) and Volume (Tons) Forecast, by Application, 2015–2024
Table 18 Malaysia Surfactants Market Size (US$ Mn) and Volume (Tons) Forecast, by Application, 2015–2024
Table 19 Thailand Surfactants Market Size (US$ Mn) and Volume (Tons) Forecast, by Product Type, 2015–2024
Table 20 Thailand Surfactants Market Size (US$ Mn) and Volume (Tons) Forecast, by Application, 2015–2024
Table 21 Thailand Surfactants Market Size (US$ Mn) and Volume (Tons) Forecast, by Application, 2015–2024
Table 22 Vietnam Surfactants Market Size (US$ Mn) and Volume (Tons) Forecast, By Product Type, 2015–2024
Table 23 Vietnam Surfactants Market Size (US$ Mn) and Volume (Tons ) Forecast, By Application, 2015–2024
Table 24 Vietnam Surfactants Market Size (US$ Mn) and Volume (Tons ) Forecast, By Application, 2015–2024
Table 25 Australia Surfactants Market Size (US$ Mn) and Volume (Tons) Forecast, by Product Type, 2015–2024
Table 26 Australia Surfactants Market Size (US$ Mn) and Volume (Tons) Forecast, by Application, 2015–2024
Table 27 Australia Surfactants Market Size (US$ Mn) and Volume (Tons) Forecast, by Application, 2015–2024
Table 28 Philippines Surfactants Market Size (US$ Mn) and Volume (Tons) Forecast, By Product Type, 2015–2024
Table 29 Philippines Surfactants Market Size (US$ Mn) and Volume (Tons ) Forecast, By Application, 2015–2024
Table 30 Philippines Surfactants Market Size (US$ Mn) and Volume (Tons ) Forecast, By Application, 2015–2024
List of Figures
Figure 1 Asia Pacific Surfactants Market
Figure 2 Cationic Surfactants Price (US$/Ton) Analysis, 2015
Figure 3 Anionic Surfactants Price (US$/Ton) Analysis, 2015
Figure 4 Non-ionic Surfactants Price (US$/Ton) Analysis, 2015
Figure 5 Amphoteric Surfactants Price (US$/Ton) Analysis, 2015
Figure 6 Asia Pacific Market Value Share Analysis, by Product Type, 2015 and 2024
Figure 7 Surfactants Market, for Cationic Surfactants
Figure 8 Surfactants Market, for Anionic Surfactants
Figure 9 Surfactants Market, for Non-ionic Surfactants
Figure 10 Surfactants Market, for Amphoteric Surfactants
Figure 11 Asia Pacific Market Value Share Analysis, by Application, 2015 and 2024
Figure 12 Asia Pacific Surfactants Market, by Personal Care
Figure 13 Asia Pacific Surfactants Market, by Oilfield Chemicals
Figure 14 Asia Pacific Surfactants Market, by Paints & Coatings
Figure 15 Asia Pacific Surfactants Market, by Emulsion Polymerization
Figure 16 Asia Pacific Surfactants Market, by Agrochemicals
Figure 17 Asia Pacific Surfactants Market, by Concrete Additives
Figure 18 Asia Pacific Market Value Share Analysis, by Country, 2015 and 2024
Figure 19 Asia Pacific Surfactants Market Attractiveness Analysis, by Country
Figure 20 South Korea Surfactants Market Value Share Analysis, by Product Type, 2015 and 2024
Figure 21 South Korea Surfactants Market Value Share Analysis, by Application, 2015 and 2024
Figure 22 Japan Surfactants Market Value Share Analysis, by Product Type, 2015 and 2024
Figure 23 Japan Surfactants Market Value Share Analysis, by Application, 2015 and 2024
Figure 24 China Surfactants Market Value Share Analysis, by Product Type, 2015 and 2024
Figure 25 China Surfactants Market Value Share Analysis, by Application, 2015 and 2024
Figure 26 Indonesia Market Value Share Analysis, by Product Type, 2015 and 2024
Figure 27 Indonesia Market Value Share Analysis, by Application, 2015 and 2024
Figure 28 Malaysia Surfactants Market Value Share Analysis, by Product Type, 2015 and 2024
Figure 29 Malaysia Surfactants Market Value Share Analysis, by Application, 2015 and 2024
Figure 30 Thailand Surfactants Market Value Share Analysis, by Product Type, 2015 and 2024
Figure 31 Thailand Surfactants Market Value Share Analysis, by Application, 2015 and 2024
Figure 32 Vietnam Market Value Share Analysis By Product Type, 2015 and 2024
Figure 33 Vietnam Market Value Share Analysis By Application, 2015 and 2024
Figure 34 Australia Surfactants Market Value Share Analysis, by Product Type, 2015 and 2024
Figure 35 Australia Surfactants Market Value Share Analysis, by Application, 2015 and 2024
Figure 36 Philippines Market Value Share Analysis By Product Type, 2015 and 2024
Figure 37 Philippines Market Value Share Analysis By Application, 2015 and 2024
Copyright © Transparency Market Research, Inc. All Rights reserved
Trust Online

Asia Pacific Surfactants Market