
Reports
Reports
Global Anhydrous Aluminum Chloride Market: Snapshot
The leading factor augmenting the growth rate of the global anhydrous aluminum chloride market currently, is the steady and sure growth in the demand and production of dyestuff and pigments. This demand is apparently much higher in Asia Pacific than other regions. The demand for anhydrous aluminum chloride across the world is also being driven by its increasing scope of use in the industries of consumer goods, pharmaceuticals, and especially cosmetics. However, the global anhydrous aluminum chloride market is being restricted in its growth by factors such as the growing concern regarding manufacturing emissions and their consequences on the environmental health. Steps are being taken to avoid breaching regulatory constraints for the same, but at the cost of increased maintenance efforts and prices.
The global anhydrous aluminum chloride market was valued at US$683.9 mn in 2015. It is projected to expand at a CAGR of 3.3% within a forecast period from 2016 to 2024. By the end of 2024, this market’s revenue is estimated to reach US$912.3 mn.
Dyestuff and Pigment Makers Show Spike in Anhydrous Aluminum Chloride Demand
The global anhydrous aluminum chloride market has been segmented on the basis of form, into powder and granules. Anhydrous aluminum chloride granules are widely used in various key applications of the market and are therefore showing a far greater rate of increase in production over powders. Thus, granules are expected to keep leading the global anhydrous aluminum chloride market on the basis of form.
Based on applications, the market has been segmented into dyestuff & pigments, hydrocarbon resins, pharmaceuticals, fumed alumina, and flavors & fragrances. The segment of dyestuff and pigments is the leading application of anhydrous aluminum chloride due to their broad spectrum of use in the production of ethyl benzene and common dyes. Anhydrous aluminum chloride is heavily used in the dyestuff industry as a catalyst for the production of pigments and derivatives of anthraquinone. By volume, the dyestuff and pigments segment held over 24% of the global anhydrous aluminum chloride market in 2015.
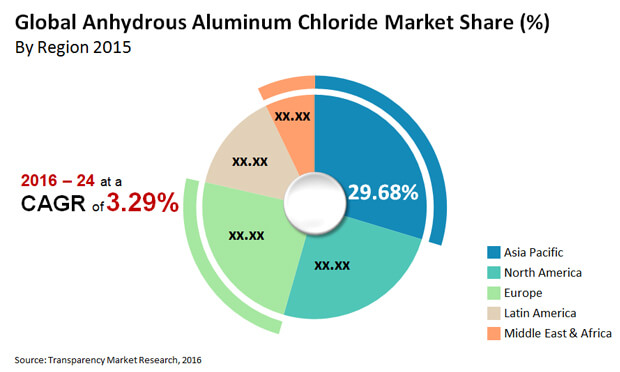
APAC to Continue Surge in Anhydrous Aluminum Chloride Demand
Asia Pacific held the leading share in the global anhydrous aluminum chloride market for 2015 in terms of both growth rate and volume consumed. The Asia Pacific rise in demand is primarily attributed to the increasing demand for pharmaceuticals and consumer goods in China and India, the two highly promising countries of the world in terms of industrial evolution rate and increase in consumption and product demand. By volume, Asia Pacific held more than 44% of the global anhydrous aluminum chloride market in 2015. It is also expected to lead the global scenario for anhydrous aluminum chloride in terms of growth rate expansion over the coming years.
Europe constituted a significant share in this market’s revenue in 2015. However, Europe is expected to show a marginal decrease in consumption levels over the coming years given the current recovery phase of this region’s economy. The Middle East & Africa region is an attractive market as well, driven by the increasing developments in the pharmaceutical and petrochemical industries.
The global anhydrous aluminum chloride market is highly fragmented in nature and the leaders of the market do not hold significantly high shares outside of their core regions of operations. As of 2015 the leading players in the global anhydrous aluminum chloride market included BASF SE, Gulbrandsen, Aditya Birla Chemicals, Gujarat Alkalies & Chemicals Ltd., Nippon Light Metal Company Ltd., and Base Metal Group.
Anhydrous Aluminum Chloride Market to Gain Impetus from Rising Demand for Dyestuffs and Pigments
The increasing popularity and demand for pigments and dyestuffs is likely to boost the growth of the global anhydrous aluminum chloride market. The interest for anhydrous aluminum chloride across the world is likewise being driven by its expanding extent of utilization in the enterprises of purchaser products, drugs, and particularly beautifiers. Be that as it may, the worldwide anhydrous aluminum chloride market is being limited in its development by components, for example, the developing concern with respect to assembling emanations and their outcomes on the natural wellbeing. Steps are being taken to try not to break administrative requirements for the equivalent, yet at the expense of expanded upkeep endeavors and costs.
The developing interest for colors and shades from arising economies-like China, India, Vietnam, South Korea, and other Southeast Asian nations are probably going to drive the anhydrous aluminum chloride market during the estimate time frame. Additionally, China, Japan, and India are significant makers and buyers of pesticides, drug medications, beautifiers, and metallurgy in APAC.
The worldwide anhydrous aluminum chloride market might be enjoying some real success on the influx of a few helpful elements, yet there are a couple of impediments that are hosing the market's impact in a measured way. One of the chief obstructions is the developing fear of the item' utilize dependent on a few unsafe discharges delivered during assembling and their unfortunate consequences for the climate. The support costs are very high with regards to requiring monstrous exertion needed by labor to put a cover on the emanations. Numerous legislatures have thought of exacting guidelines and guidelines, which may be a developing block to the worldwide anhydrous aluminum market with respect to its development rate. The material is very poisonous to human on the off chance that it is accidently ingested or breathed in, and may likewise cause skin consumes and aggravation. The present circumstance is relied upon to change in future as the strength in this market improves, wherein a portion of the guidelines could turn out to be less severe. With better material taking care of procedures being created, the wellbeing and ecological dangers could likewise be decreased.
1. Preface
1.1. Report Scope and Market Segmentation
1.2. Research Highlights
2. Assumptions and Research Methodology
2.1. Assumptions and Acronyms Used
2.2. Research Methodology
3. Executive Summary
3.1. Market Size, Global Anhydrous Aluminum Chloride Market (US$ Mn)
3.2. Key Trends
3.3. Regional Overview, 2015 & Top 3 Product Share, 2015- 2024
4. Market Overview
4.1. Product Overview
4.2. Market Indicators
4.3. Key Industry Developments
4.4. Aluminum and Chlorine Markets Overview
4.5. Market Dynamics
4.5.1. Drivers
4.5.2. Restraints
4.5.3. Key Opportunities
4.6. Anhydrous Aluminum Chloride Market: Global Supply & Demand Scenario
4.7. Anhydrous Aluminum Chloride – Imports and Exports Analysis, 2013–2015
4.7.1. Imports Analysis for HS Code 282732 (Tons), 2013–2015
4.7.2. Exports Analysis for HS Code 282732 (Tons), 2013–2015
4.8. Porter’s Analysis
4.8.1. Threat of Substitutes
4.8.2. Bargaining Power of Buyers
4.8.3. Bargaining Power of Suppliers
4.8.4. Threat of New Entrants
4.8.5. Degree of Competition
4.9. Value Chain Analysis
4.10. Anhydrous Aluminum Chloride Market Outlook
4.11. Global Anhydrous Aluminum Chloride Market Analysis and Forecast, 2015–2024
4.12. Aluminum Price Trend Analysis, 2011–2015
5. Global Anhydrous Aluminum Chloride Market Analysis, by Form
5.1. Introduction
5.2. Key Findings
5.3. Key Trends
5.4. Anhydrous Aluminum Chloride Market Analysis, by Form
5.5. Anhydrous Aluminum Chloride Market Attractiveness Analysis, by Form
6. Global Anhydrous Aluminum Chloride Market Analysis by application
6.1. Introduction
6.2. Key Findings
6.3. Key Trends
6.4. Anhydrous Aluminum Chloride Market Analysis, by Application
6.5. Anhydrous Aluminum Chloride Market Attractiveness Analysis, by Application
7. Global Anhydrous Aluminum Chloride Market Analysis and Forecasts, by Region
7.1. Global Anhydrous Aluminum Chloride Market Scenario, by Region, 2015
7.2. Key Findings
7.3. Key Trends
7.4. Anhydrous Aluminum Chloride Market Attractiveness Analysis, by Region
8. North America Anhydrous Aluminum Chloride Market Analysis
8.1. Key Findings
8.2. North America Anhydrous Aluminum Chloride Market Size (US$ Mn) and Volume (Tons) Forecast, by Form, 2015–2024
8.3. North America Anhydrous Aluminum Chloride Market Size (US$ Mn) and Volume (Tons) Forecast, by Application, 2015–2024
8.4. North America Anhydrous Aluminum Chloride Market Attractiveness Overview
8.5. U.S. Anhydrous Aluminum Chloride Market Analysis
8.6. Canada Anhydrous Aluminum Chloride Market Analysis
8.7. Market Trends
9. Europe Anhydrous Aluminum Chloride Market Analysis
9.1. Key Findings
9.2. Market Trends- Policies & Regulations
9.3. Europe Anhydrous Aluminum Chloride Market Size (US$ Mn) and Volume (Tons) Forecast, by Form, 2015–2024
9.4. Europe Anhydrous Aluminum Chloride Market Size (US$ Mn) and Volume (Tons) Forecast, by Application, 2015–2024
9.5. Europe Anhydrous Aluminum Chloride Market Attractiveness Overview
9.6. Germany Anhydrous Aluminum Chloride Market Analysis
9.7. France Anhydrous Aluminum Chloride Market Analysis
9.8. U.K. Anhydrous Aluminum Chloride Market Analysis
9.9. Italy Anhydrous Aluminum Chloride Market Analysis
9.10. Spain Anhydrous Aluminum Chloride Market Analysis
9.11. Rest of Europe Anhydrous Aluminum Chloride Market Analysis
9.12. Market Trends
10. Asia-Pacific Anhydrous Aluminum Chloride Market Analysis
10.1. Key Findings
10.2. Market Trends- Policies & Regulations
10.3. Asia Pacific Anhydrous Aluminum Chloride Market Size (US$ Mn) and Volume (Tons) Forecast, by Form, 2015–2024
10.4. Asia Pacific Anhydrous Aluminum Chloride Market Size (US$ Mn) and Volume (Tons) Forecast, by Application, 2015–2024
10.5. Asia Pacific Anhydrous Aluminum Chloride Market Attractiveness Overview
10.6. India Anhydrous Aluminum Chloride Market Analysis
10.7. Japan Anhydrous Aluminum Chloride Market Analysis
10.8. ASEAN Anhydrous Aluminum Chloride Market Analysis
10.9. Rest of Asia Pacific Anhydrous Aluminum Chloride Market Analysis
10.10. Market Trends
11. Latin America Anhydrous Aluminum Chloride Market Analysis
11.1. Key Findings
11.2. Latin America Anhydrous Aluminum Chloride Market Size (US$ Mn) and Volume (Tons) Forecast, by Form, 2015–2024
11.3. Latin America Anhydrous Aluminum Chloride Market Size (US$ Mn) and Volume (Tons) Forecast, by Application, 2015–2024
11.4. Latin America Anhydrous Aluminum Chloride Market Attractiveness Overview
11.4.1. Brazil Anhydrous Aluminum Chloride Market Analysis
11.4.2. Mexico Anhydrous Aluminum Chloride Market Analysis
11.4.3. Rest of Latin America Anhydrous Aluminum Chloride Market Analysis
11.4.4. Market Trends
12. Middle East & Africa Anhydrous Aluminum Chloride Market Analysis
12.1. Key Findings
12.2. Middle East & Africa Anhydrous Aluminum Chloride Market Size (US$ Mn) and Volume (Tons) Forecast, by Type, 2015–2024
12.3. Middle East & Africa Anhydrous Aluminum Chloride Market Size (US$ Mn) and Volume (Tons) Forecast, by Origin, 2015–2024
12.4. Middle East & Africa Anhydrous Aluminum Chloride Market Attractiveness Overview
12.4.1. GCC Anhydrous Aluminum Chloride Market Analysis
12.4.2. Egypt Anhydrous Aluminum Chloride Market Analysis
12.4.3. South Africa of Latin America Anhydrous Aluminum Chloride Market Analysis
12.4.4. Rest of Middle East & Africa Anhydrous Aluminum Chloride Market Analysis
13. Competition Landscape
13.1. Competition Matrix
13.2. Anhydrous Aluminum Chloride Market Share Analysis, by Company (2015)
13.3. Company Profiles
13.3.1. BASF SE
13.3.1.1. Company Description
13.3.1.2. Business Overview
13.3.1.3. Financial Details
13.3.1.4. SWOT
13.3.1.5. Strategic Overview
13.3.1.6. Recent Development
13.3.2. Aditya Birla Chemicals
13.3.2.1. Company Description
13.3.2.2. Business Overview
13.3.2.3. Financial Details
13.3.2.4. SWOT
13.3.2.5. Strategic Overview
13.3.2.6. Recent development
13.3.3. Gujarat Alkalies & Chemicals Ltd.
13.3.3.1. Company Description
13.3.3.2. Business Overview
13.3.3.3. Financial Details
13.3.3.4. SWOT
13.3.3.5. Strategic Overview
13.3.3.6. Recent Development
13.3.4. Gulbrandsen
13.3.4.1. Company Description
13.3.4.2. Business Overview
13.3.4.3. Financial Details
13.3.4.4. SWOT
13.3.4.5. Strategic Overview
13.3.4.6. Recent Development
13.3.5. Nippon Light Metal Co.
13.3.5.1. Company Description
13.3.5.2. Business Overview
13.3.5.3. Financial Details
13.3.5.4. SWOT
13.3.5.5. Strategic Overview
13.3.5.6. Recent development
13.3.6. Base Metal Group
13.3.6.1. Company Description
13.3.6.2. Business Overview
13.3.6.3. Financial Details
13.3.6.4. SWOT
13.3.6.5. Strategic Overview
13.3.6.6. Recent Development
13.3.7. Chemtex Specialty Limited
13.3.7.1. Company Description
13.3.7.2. Business Overview
13.3.7.3. Financial Details
13.3.7.4. SWOT
13.3.7.5. Strategic Overview
13.3.7.6. Recent Development
13.3.8. Weifang JS trading co., Ltd
13.3.9. Company Description
13.3.9.1. Business Overview
13.3.9.2. Financial Details
13.3.9.3. SWOT
13.3.9.4. Strategic Overview
13.3.9.5. Recent Development
13.3.10. Seabert Chemicals Pvt. Ltd.
13.3.10.1. Company Description
13.3.10.2. Business Overview
13.3.10.3. Financial Details
13.3.10.4. SWOT
13.3.10.5. Strategic Overview
13.3.10.6. Recent Development
13.3.11. SOMATCO
13.3.11.1. Company Description
13.3.11.2. Business Overview
13.3.11.3. Financial Details
13.3.11.4. SWOT
13.3.11.5. Strategic Overview
13.3.11.6. Recent Development
13.3.12. Umiya Group of Companies
13.3.12.1. Company Description
13.3.12.2. Business Overview
13.3.12.3. Financial Details
13.3.12.4. SWOT
13.3.12.5. Strategic Overview
13.3.12.6. Recent Development
13.3.13. NIKE CHEMICAL INDIA
13.3.13.1. Company Description
13.3.13.2. Business Overview
13.3.13.3. Financial Details
13.3.13.4. SWOT
13.3.13.5. Strategic Overview
13.3.13.6. Recent Development
13.3.14. Anmol Chloro Chem
13.3.14.1. Company Description
13.3.14.2. Business Overview
13.3.14.3. Financial Details
13.3.14.4. SWOT
13.3.14.5. Strategic Overview
13.3.14.6. Recent Development
13.3.15. Upra Chem Pvt. Ltd.
13.3.15.1. Company Description
13.3.15.2. Business Overview
13.3.15.3. Financial Details
13.3.15.4. SWOT
13.3.15.5. Strategic Overview
13.3.15.6. Recent Development
13.3.16. AVI-CHEM INDUSTRIES
13.3.16.1. Company Description
13.3.16.2. Business Overview
13.3.16.3. Financial Details
13.3.16.4. SWOT
13.3.16.5. Strategic Overview
13.3.16.6. Recent Development
13.3.17. PRAKASH CHEMICALS AGENCIES PVT. LTD.
13.3.17.1. Company Description
13.3.17.2. Business Overview
13.3.17.3. Financial Details
13.3.17.4. SWOT
13.3.17.5. Strategic Overview
13.3.17.6. Recent Development
Key Takeaways
List of Tables
Table 1: Global Anhydrous Aluminum Chloride Market Size (US$ Mn) and Volume (Tons) Forecast, by Form, 2015–2024
Table 2: Anhydrous Aluminum Chloride Market, Form Comparison Matrix
Table 3: Global Anhydrous Aluminum Chloride Market Size (US$ Mn) and Volume (Tons) Forecast, by Application, 2015–2024
Table 4: Global Anhydrous Aluminum Chloride Market Size (US$ Mn) and Volume (Tons) Forecast, by Application, 2015–2024
Table 5: Application Comparison Matrix
Table 6: Global Anhydrous Aluminum Chloride Market Size (US$ Mn) and Volume (Tons) Forecast, by Region, 2015–2024
Table 7: North America Anhydrous Aluminum Chloride Market Size (US$ Mn) and Volume (Tons) Forecast, by Form, 2015–2024
Table 8: North America Anhydrous Aluminum Chloride Market Size (US$ Mn) and Volume (Tons) Forecast, by Application, 2015–2024
Table 9: North America Anhydrous Aluminum Chloride Market Size (US$ Mn) and Volume (Tons) Forecast, by Application, 2015–2024
Table 10: North America Agricultural Adjuvants Market Size (US$ Mn) and Volume (Tons) Forecast, by Country, 2015–2024
Table 11: Europe Anhydrous Aluminum Chloride Market Size (US$ Mn) and Volume (Tons) Forecast, by Form, 2015–2024
Table 12: Europe Anhydrous Aluminum Chloride Market Size (US$ Mn) and Volume (Tons) Forecast, by Application, 2015–2024
Table 13: Europe Anhydrous Aluminum Chloride Market Size (US$ Mn) and Volume (Tons) Forecast, by Application, 2015–2024
Table 14: Europe Agricultural Adjuvants Market Size (US$ Mn) and Volume (Tons) Forecast, by Country, 2015–2024
Table 15: Asia Pacific Anhydrous Aluminum Chloride Market Size (US$ Mn) and Volume (Tons) Forecast, by Form, 2015–2024
Table 16: Asia Pacific Anhydrous Aluminum Chloride Market Size (US$ Mn) and Volume (Tons) Forecast, by Application, 2015–2024
Table 17: Asia Pacific Anhydrous Aluminum Chloride Market Size (US$ Mn) and Volume (Tons) Forecast, by Application, 2015–2024
Table 18: APAC Anhydrous Aluminum Chloride Market Size (US$ Mn) and Volume (Tons) Forecast, by Country, 2015–202 4
Table 19: Latin America Anhydrous Aluminum Chloride Market Size (US$ Mn) and Volume (Tons) Forecast, by Form, 2015–2024
Table 20: Latin America Anhydrous Aluminum Chloride Market Size (US$ Mn) and Volume (Tons) Forecast, by Application, 2015–2024
Table 21: Latin America Anhydrous Aluminum Chloride Market Size (US$ Mn) and Volume (Tons) Forecast, by Application, 2015–2024
Table 22: Latin America Anhydrous Aluminum Chloride Market Size (US$ Mn) and Volume (Tons) Forecast, by Country, 2015–2024
Table 23: Middle East & Africa Anhydrous Aluminum Chloride Market Size (US$ Mn) and Volume (Tons) Forecast, by Form, 2015–2024
Table 24: Middle East & Africa Anhydrous Aluminum Chloride Market Size (US$ Mn) and Volume (Tons) Forecast, by Application, 2015–2024
Table 25: Middle East & Africa Anhydrous Aluminum Chloride Market Size (US$ Mn) and Volume (Tons) Forecast, by Application, 2015–2024
Table 26: MEA Anhydrous Aluminum Chloride Market Size (US$ Mn) and Volume (Tons) Forecast, by Country, 2015–2024
Table 27: GCC Anhydrous Aluminum Chloride Market Size (US$ Mn) and Volume (Tons) Forecast, by Country, 2015–2024
Table 28: GCC Anhydrous Aluminum Chloride Market Size (US$ Mn) and Volume (Tons) Forecast, by Country, 2015–2024
List of Figures
Figure 1: Global Anhydrous Aluminum Chloride Market Size, by Market Value (US$ Mn) and Market Value Share
Figure 2: Regional Overview, 2015
Figure 3: Share held by Top 3 Applications, 2015–2024
Figure 4: Global Anhydrous Aluminum Chloride Market Size (US$ Mn) and Volume (Tons) Forecast, 2015–2024
Figure 5: Global Anhydrous Aluminum Chloride Prices (US$ Mn/Kilo Ton)
Figure 7: Global Anhydrous Aluminum Chloride Market Value Share Analysis, by Form, 2015 and 2024
Figure 8: By Form (Powder), 2015–2024 (Tons) (US$ Mn)
Figure 9: By Form (Granules), 2015–2024 (Tons) (US$ Mn)
Figure 10: Anhydrous Aluminum Chloride Market Attractiveness Analysis, by Form, 2015
Figure 11: Global Anhydrous Aluminum Chloride Market Value Share Analysis, by Application, 2015 and 2024
Figure 12: Global Anhydrous Aluminum Chloride Market Analysis (Tons) (US$ Mn), by Dyestuff & Pigments, 2015–2024
Figure 13: Global Anhydrous Aluminum Chloride Market Analysis (Tons) (US$ Mn), by Hydrocarbon Resins, 2015–2024
Figure 14: Global Anhydrous Aluminum Chloride Market Analysis (Tons) (US$ Mn), by Pharmaceuticals, 2015–2024
Figure 15: Global Anhydrous Aluminum Chloride Market Analysis (Tons) (US$ Mn), by Fumed Alumina, 2015–2024
Figure 16: Global Anhydrous Aluminum Chloride Market Analysis (Tons) (US$ Mn), by Flavors & Fragrances, 2015–2024
Figure 17: Global Anhydrous Aluminum Chloride Market Analysis (Tons) (US$ Mn), by Others, 2015–2024
Figure 19: Global Anhydrous Aluminum Chloride Market Attractiveness Analysis, by Application, 2015
Figure 18: Anhydrous Aluminum Chloride Market Attractiveness Analysis, by Region, 2015
Figure 19: North America Anhydrous Aluminum Chloride Market Size (US$ Mn) and Volume (Tons) Forecast, by Powder, 2015–2024
Figure 20: North America Anhydrous Aluminum Chloride Market Size (US$ Mn) and Volume (Tons) Forecast, by Granules, 2015–2024
Figure 21: North America Anhydrous Aluminum Chloride Market Size (US$ Mn) and Volume (Tons) Forecast, by Dyestuff & Pigments, 2015–2024
Figure 22: North America Anhydrous Aluminum Chloride Market Size (US$ Mn) and Volume (Tons) Forecast, by Hydrocarbon Resins, 2015–2024
Figure 23: North America Anhydrous Aluminum Chloride Market Size (US$ Mn) and Volume (Tons) Forecast, by Pharmaceuticals, 2015–2024
Figure 24: North America Anhydrous Aluminum Chloride Market Size (US$ Mn) and Volume (Tons) Forecast, by Fumed Alumina, 2015–2024
Figure 25: North America Anhydrous Aluminum Chloride Market Size (US$ Mn) and Volume (Tons) Forecast, by Flavors & Fragrances, 2015–2024
Figure 26: North America Anhydrous Aluminum Chloride Market Size (US$ Mn) and Volume (Tons) Forecast, by Others, 2015–2024
Figure 27: North America Market Attractiveness Analysis, by Country, 2015
Figure 28: North America Market Attractiveness Analysis, by Form, 2015
Figure 29: North America Market Attractiveness Analysis, by Application, 2015
Figure 30: Europe Anhydrous Aluminum Chloride Market Size (US$ Mn) and Volume (Tons) Forecast, by Powder, 2015–2024
Figure 31: Europe Anhydrous Aluminum Chloride Market Size (US$ Mn) and Volume (Tons) Forecast, by Granules, 2015–2024
Figure 32: Europe Anhydrous Aluminum Chloride Market Size (US$ Mn) and Volume (Tons) Forecast, by Dyestuff & Pigments, 2015–2024
Figure 33: Europe Anhydrous Aluminum Chloride Market Size (US$ Mn) and Volume (Tons) Forecast, by Hydrocarbon Resins, 2015–2024
Figure 34: Europe Anhydrous Aluminum Chloride Market Size (US$ Mn) and Volume (Tons) Forecast, by Pharmaceuticals, 2015–2024
Figure 35: Europe Anhydrous Aluminum Chloride Market Size (US$ Mn) and Volume (Tons) Forecast, by Fumed Alumina, 2015–2024
Figure 36: Europe Anhydrous Aluminum Chloride Market Size (US$ Mn) and Volume (Tons) Forecast, by Flavors & Fragrances, 2015–2024
Figure 37: Europe Anhydrous Aluminum Chloride Market Size (US$ Mn) and Volume (Tons) Forecast, by Others, 2015–2024
Figure 38: Europe Anhydrous Aluminum Chloride Market Attractiveness Analysis, by Country, 2015
Figure 39: Europe Anhydrous Aluminum Chloride Market Attractiveness Analysis, by Form, 2015
Figure 40: Europe Anhydrous Aluminum Chloride Market Attractiveness Analysis, by Application, 2015
Figure 41: Asia Pacific Anhydrous Aluminum Chloride Market Size (US$ Mn) and Volume (Tons) Forecast, by Powder, 2015–2024
Figure 42: Asia Pacific Anhydrous Aluminum Chloride Market Size (US$ Mn) and Volume (Tons) Forecast, by Granules, 2015–2024
Figure 43: Asia Pacific Anhydrous Aluminum Chloride Market Size (US$ Mn) and Volume (Tons) Forecast, by Dyestuff & Pigments, 2015–2024
Figure 44: Asia Pacific Anhydrous Aluminum Chloride Market Size (US$ Mn) and Volume (Tons) Forecast, by Hydrocarbon Resins, 2015–2024
Figure 45: Asia Pacific Anhydrous Aluminum Chloride Market Size (US$ Mn) and Volume (Tons) Forecast, by Pharmaceuticals, 2015–2024
Figure 46: Asia Pacific Anhydrous Aluminum Chloride Market Size (US$ Mn) and Volume (Tons) Forecast, by Fumed Alumina, 2015–2024
Figure 47: Asia Pacific Anhydrous Aluminum Chloride Market Size (US$ Mn) and Volume (Tons) Forecast, by Flavors & Fragrances, 2015–2024
Figure 48: Asia Pacific Anhydrous Aluminum Chloride Market Size (US$ Mn) and Volume (Tons) Forecast, by Others, 2015–2024
Figure 49: Asia Pacific Anhydrous Aluminum Chloride Market Attractiveness Analysis, by Country, 2015
Figure 50: Asia Pacific Anhydrous Aluminum Chloride Market Attractiveness Analysis, by Form, 2015
Figure 51: Asia Pacific Anhydrous Aluminum Chloride Market Attractiveness Analysis, by Application, 2015
Figure 52: Latin America Anhydrous Aluminum Chloride Market Size (US$ Mn) and Volume (Tons) Forecast, by Powder, 2015–2024
Figure 53: Latin America Anhydrous Aluminum Chloride Market Size (US$ Mn) and Volume (Tons) Forecast, by Granules, 2015–2024
Figure 54: Latin America Anhydrous Aluminum Chloride Market Size (US$ Mn) and Volume (Tons) Forecast, by Dyestuff and Pigments, 2015–2024
Figure 55: Latin America Anhydrous Aluminum Chloride Market Size (US$ Mn) and Volume (Tons) Forecast, by Hydrocarbon Resins, 2015–2024
Figure 56: Latin America Anhydrous Aluminum Chloride Market Size (US$ Mn) and Volume (Tons) Forecast, by Pharmaceuticals, 2015–2024
Figure 57: Latin America Anhydrous Aluminum Chloride Market Size (US$ Mn) and Volume (Tons) Forecast, by Fumed Alumina, 2015–2024
Figure 58: Latin America Anhydrous Aluminum Chloride Market Size (US$ Mn) and Volume (Tons) Forecast, by Flavors and Fragrances, 2015–2024
Figure 59: Latin America Anhydrous Aluminum Chloride Market Size (US$ Mn) and Volume (Tons) Forecast, by Others, 2015–2024
Figure 60: Latin America Market Attractiveness Analysis, by Country, 2015
Figure 61: Latin America Market Attractiveness Analysis, by Form, 2015
Figure 62: Latin America Market Attractiveness Analysis, by Application, 2015
Figure 63: Middle East & Africa Anhydrous Aluminum Chloride Market Size (US$ Mn) and Volume (Tons) Forecast, by Powder, 2015–2024
Figure 64: Middle East & Africa Anhydrous Aluminum Chloride Market Size (US$ Mn) and Volume (Tons) Forecast, by Granules, 2015–2024
Figure 65: Middle East & Africa Anhydrous Aluminum Chloride Market Size (US$ Mn) and Volume (Tons) Forecast, by Dyestuff & Pigments, 2015–2024
Figure 66: Middle East & Africa Anhydrous Aluminum Chloride Market Size (US$ Mn) and Volume (Tons) Forecast, by Hydrocarbon Resins, 2015–2024
Figure 67: Middle East & Africa Anhydrous Aluminum Chloride Market Size (US$ Mn) and Volume (Tons) Forecast, by Pharmaceuticals, 2015–2024
Figure 68: Middle East & Africa Anhydrous Aluminum Chloride Market Size (US$ Mn) and Volume (Tons) Forecast, by Fumed Alumina, 2015–2024
Figure 69: Middle East & Africa Anhydrous Aluminum Chloride Market Size (US$ Mn) and Volume (Tons) Forecast, by Flavors & Fragrances, 2015–2024
Figure 70: Middle East & Africa Anhydrous Aluminum Chloride Market Size (US$ Mn) and Volume (Tons) Forecast, by Others, 2015–2024
Figure 71: Middle East & Africa Anhydrous Aluminum Chloride Market Attractiveness Analysis, by Country, 2015
Figure 72: Middle East & Africa Anhydrous Aluminum Chloride Market Attractiveness Analysis, by Form, 2015
Figure 73: Middle East & Africa Anhydrous Aluminum Chloride Market Attractiveness Analysis, by Application, 2015
Figure 74: Global Anhydrous Aluminum Chloride Market Value Share Analysis, by Company (2015)
Copyright © Transparency Market Research, Inc. All Rights reserved
Trust Online

Anhydrous Aluminum Chloride Market