
Reports
Reports
In recent years, the packaging industry has witnessed a tremendous increase in demand for different products due to change in consumer habits and the introduction of new & innovative products embedded with advanced packaging technologies. Companies are investing heavily in research and development activities to develop products with distinguishable characteristics. Consumer inclination towards convenience products such as packaged food, has resulted in the development of products with advanced packaging technologies that offer longer shelf life through gas absorption and scavenging systems. Across the globe, active packaging is gaining traction for food packaging applications due to its properties that enhance shelf life and the ability to reflect properties of contained food on the packaging. Embedding advanced packaging technologies such as freshness and temperature indicators on food packaging products by a large number of brand owners all over the world, is helping them acquire more customers and gain a competitive advantage in the packaged food industry. Leading packaging companies are collaborating with technology providers to develop advanced packaging technologies for their products. Global food and beverages companies are showing immense interest in adopting packaging solutions with advanced packaging technologies.
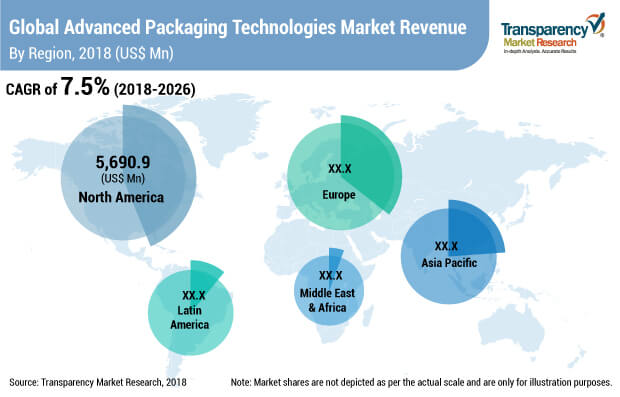
The global demand for advanced packaging technologies is largely fulfilled by the manufacturers present in major countries of Europe and North America regions. It has been noticed that the consumers in these regions have shown great interest in the adoption of products with advanced packaging technologies. According to TMR, more than 30% of the consumers are willing to pay a higher cost for products with the advanced packaging technologies. Consumer inclination towards products with smart packaging solutions and high-barrier properties is creating a wave in the packaging industry which, in turn, is responsible for the high growth in the advanced packaging technologies market. The advanced packaging technologies market is expected to grow at a CAGR value of 7.5%, during the forecast period.
Innovation and new product launches in the global advanced packaging technologies market are the major factors that are being considered by leading packaging manufacturers. Brand owners are rethinking their strategies and planning to launch new products with advanced packaging technologies. Such initiatives are responsible for embarking new products in the advanced packaging technologies market. Brand owners think that products with advanced packaging technologies will create brand differentiation at the point of sale.
On the basis of end use, the advanced packaging technologies market is segmented into Food, Beverages, Pharmaceuticals, Industrial & Chemicals, Cosmetics & Personal Care, Agriculture, and Others. Food segment in the advanced packaging technologies market is further sub-segmented into Meat, Poultry, and Seafood, Fruits & Vegetables, Ready-to-Eat Meals, Dairy Foods, Bakery & Confectionary, Frozen Foods, and Cereals.
The North American region accounts for the largest market share in terms of production of packaging products, with advanced packaging technologies, in both categories i.e. active and smart & intelligent packaging. The U.S. is expected to account for the largest market share in the North American advanced packaging technologies market. However, Canada is expected to witness higher CAGR value of 7.2% during the forecast period. European region occupies the second spot in the global advanced packaging technologies market in terms of both revenue generation and consumption. Germany and Italy are the main production hubs for products embedded with advanced packaging technologies in Europe. Both of these countries export a large proportion of its production to the U.S., China, ASEAN, India, Korea, and Japan. In the Asia-Pacific region, Japan accounts for the second largest market share due to the high consumption of the products with advanced packaging technologies in the country. A large number of advanced packaging manufacturers have already established a good presence in the Japanese market. However, the demand for advanced packaging technologies in Japan is increasing but at a slower rate than other countries in the Asia-Pacific region. Major technology providers such as EVRYTHNG Limited, Selinko SA, Digimarc Corporation, Prime Vision AG, and Waterio Ltd. are collaborating with packaging companies in the region to develop products with advanced packaging technologies and leverage opportunities generated from the high demand for such packaging solutions in the region.
Leading packaging companies such as Tetrapak and Huhtamaki are also planning to launch new products with advanced packaging technologies in the developing countries of the Asia-Pacific and Latin America regions. Countries in the MEA region also offer untapped growth opportunities in the global advanced packaging technologies market.
Some of the key players in the global advanced packaging technologies market include PakSense, Inc, Landec Corporation, Sealed Air Corporation, Bemis Company, Inc, Crown Holdings, Inc., Amcor Limited, 3M Company, Timestrip UK Ltd., Cryolog S.A., Vitsab International AB, Varcode, Ltd., LCR Hallcrest LLC.:, Thin Film Electronics ASA, CCL Industries Inc., Temptime Corporation, Multisorb Technologies, Inc., Coveris Holdings S.A., and others.
1. Executive Summary
1.1. Market Overview
1.2. Market Analysis
1.3. TMR Analysis and Recommendations
1.4. Opportunity Analysis
2. Market Introduction
2.1. Market Taxonomy
2.2. Market Definition
3. Market Background
3.1. Global Active, Smart, and Intelligent Packaging Market Overview
3.2. Technology Roadmap
3.3. Packaging Manufacturers’ Perspective on Advanced Packaging Technologies
3.4. Advanced Packaging: Consumer Sentiment Analysis
3.5. Nanotechnology in Packaging: Short and Long Term Outlook
3.6. Macro-Economic Indicators and Correlation Analysis
3.7. Forecast Factors – Relevance & Impact
3.8. Porter’s Five Forces Analysis for Top 5 Countries
3.9. PESTLE Analysis for Key Countries
3.10. Value Chain Analysis
3.10.1. Key Participants
3.10.1.1. Raw Material Supplier
3.10.1.2. Technology Providers
3.10.1.3. Packaging Manufacturer
3.10.1.4. End Users
3.10.2. Profitability Margin
3.11. Market Dynamics
3.11.1. Drivers
3.11.1.1. Supply Side
3.11.1.2. Demand Side
3.11.2. Restraints
3.11.3. Opportunities
3.11.4. Trends
4. Market Analysis
4.1. Market Value (US$ Mn) and Volume (Mn Units) Analysis & Forecast
4.2. Y-o-Y Growth Projections
4.3. Absolute $ Opportunity Analysis
5. Global Advanced Packaging Technologies Market Analysis and Forecast, by Technology
5.1. Section Summary
5.2. Introduction
5.2.1. Market Share and BPS Analysis, by Technology
5.2.2. Y-o-Y Growth Comparison, by Technology
5.3. Market Value (US$ Mn) and Volume (Mn Units) Forecast, by Technology
5.3.1. Active Packaging
5.3.1.1. Active Scavenging Systems
5.3.1.1.1. Oxygen Scavengers
5.3.1.1.2. Moisture Scavengers
5.3.1.1.3. Ethylene Absorbers
5.3.1.2. Active Releasing Systems
5.3.1.2.1. Antioxidant Releasers
5.3.1.2.2. Carbon Dioxide Emitters
5.3.1.3. Modified Atmosphere Packages (MAP)
5.3.1.4. Temperature Control Packaging
5.3.1.5. Anti-Corrosion Films
5.3.2. Smart and Intelligent Packaging
5.3.2.1. Time-Temperature Indicators (TTI)
5.3.2.2. Freshness Indicators
5.3.2.3. Oxygen and Carbon Dioxide Indicators
5.3.2.4. RFID
5.3.2.5. Others
5.4. Market Attractiveness Analysis, by Technology
6. Global Advanced Packaging Technologies Market Analysis, by End Use
6.1. Section Summary
6.2. Introduction
6.2.1. Market Share and BPS Analysis, by End Use
6.2.2. Y-o-Y Growth Comparison, by End Use
6.3. Market Value (US$ Mn) and Volume (Mn Units) Forecast, by End Use
6.3.1. Food
6.3.1.1. Meat, Poultry and Seafood
6.3.1.2. Fruits and Vegetables
6.3.1.3. Ready-to-Eat Meals
6.3.1.4. Dairy Foods
6.3.1.5. Bakery and Confectionery
6.3.1.6. Frozen Foods
6.3.1.7. Cereals
6.3.2. Beverages
6.3.2.1. Alcoholic Beverages
6.3.2.2. Non-Alcoholic Beverages
6.3.3. Pharmaceuticals
6.3.4. Industrial & Chemicals
6.3.5. Cosmetics & Personal Care
6.3.6. Agriculture
6.3.7. Others
6.4. Market Attractiveness Analysis by End Use
7. Global Advanced Packaging Technologies Market Analysis, by Region
7.1. Section Summary
7.2. Introduction
7.2.1. Y-o-Y Growth Projections, by Region
7.2.2. Basis Point Share (BPS) Analysis, by Region
7.3. Market Value (US$ Mn) and Volume (Mn Units) Forecast, by Region
7.3.1. North America
7.3.2. Latin America
7.3.3. Europe
7.3.4. APAC
7.3.5. Middle East & Africa
7.4. Market Attractiveness Analysis by Region
8. North America Advanced Packaging Technologies Market Analysis
8.1. Introduction
8.1.1. Basis Point Share (BPS) Analysis by Country
8.1.2. Y-o-Y Growth Projections by Country
8.2. Pricing Analysis
8.3. North America Advanced Packaging Technologies Market Value (US$ Mn) and Volume (Mn Units) Forecast, by Country
8.3.1. U.S.
8.3.2. Canada
8.4. Market Value (US$ Mn) and Volume (Mn Units) Forecast, by Technology
8.4.1. Active Packaging
8.4.1.1. Active Scavenging Systems
8.4.1.1.1. Oxygen Scavengers
8.4.1.1.2. Moisture Scavengers
8.4.1.1.3. Ethylene Absorbers
8.4.1.2. Active Releasing Systems
8.4.1.2.1. Antioxidant Releasers
8.4.1.2.2. Carbon Dioxide Emitters
8.4.1.3. Modified Atmosphere Packages (MAP)
8.4.1.4. Temperature Control Packaging
8.4.1.5. Anti-Corrosion Films
8.4.2. Smart and Intelligent Packaging
8.4.2.1. Time-Temperature Indicators (TTI)
8.4.2.2. Freshness Indicators
8.4.2.3. Oxygen and Carbon Dioxide Indicators
8.4.2.4. RFID
8.4.2.5. Others
8.5. Market Value (US$ Mn) and Volume (Mn Units) Forecast, by End Use
8.5.1. Food
8.5.1.1. Meat, Poultry and Seafood
8.5.1.2. Fruits and Vegetables
8.5.1.3. Ready-to-Eat Meals
8.5.1.4. Dairy Foods
8.5.1.5. Bakery and Confectionery
8.5.1.6. Frozen Foods
8.5.1.7. Cereals
8.5.2. Beverages
8.5.2.1. Alcoholic Beverages
8.5.2.2. Non-Alcoholic Beverages
8.5.3. Pharmaceuticals
8.5.4. Industrial & Chemicals
8.5.5. Cosmetics & Personal Care
8.5.6. Agriculture
8.5.7. Others
8.6. Key Market Participants - Intensity Mapping
8.7. Drivers and Restraints: Impact Analysis
9. Latin America Advanced Packaging Technologies Market Analysis
9.1. Introduction
9.1.1. Basis Point Share (BPS) Analysis by Country
9.1.2. Y-o-Y Growth Projections by Country
9.2. Pricing Analysis
9.3. Latin America Advanced Packaging Technologies Market Value (US$ Mn) and Volume (Mn Units) Forecast, by Country
9.3.1. Brazil
9.3.2. Mexico
9.3.3. Argentina
9.3.4. Rest of Latin America
9.4. Market Value (US$ Mn) and Volume (Mn Units) Forecast, by Technology
9.4.1. Active Packaging
9.4.1.1. Active Scavenging Systems
9.4.1.1.1. Oxygen Scavengers
9.4.1.1.2. Moisture Scavengers
9.4.1.1.3. Ethylene Absorbers
9.4.1.2. Active Releasing Systems
9.4.1.2.1. Antioxidant Releasers
9.4.1.2.2. Carbon Dioxide Emitters
9.4.1.3. Modified Atmosphere Packages (MAP)
9.4.1.4. Temperature Control Packaging
9.4.1.5. Anti-Corrosion Films
9.4.2. Smart and Intelligent Packaging
9.4.2.1. Time-Temperature Indicators (TTI)
9.4.2.2. Freshness Indicators
9.4.2.3. Oxygen and Carbon Dioxide Indicators
9.4.2.4. RFID
9.4.2.5. Others
9.5. Market Value (US$ Mn) and Volume (Mn Units) Forecast, by End Use
9.5.1. Food
9.5.1.1. Meat, Poultry and Seafood
9.5.1.2. Fruits and Vegetables
9.5.1.3. Ready-to-Eat Meals
9.5.1.4. Dairy Foods
9.5.1.5. Bakery and Confectionery
9.5.1.6. Frozen Foods
9.5.1.7. Cereals
9.5.2. Beverages
9.5.2.1. Alcoholic Beverages
9.5.2.2. Non-Alcoholic Beverages
9.5.3. Pharmaceuticals
9.5.4. Industrial & Chemicals
9.5.5. Cosmetics & Personal Care
9.5.6. Agriculture
9.5.7. Others
9.6. Key Market Participants - Intensity Mapping
9.7. Drivers and Restraints: Impact Analysis
10. Europe Advanced Packaging Technologies Market Analysis
10.1. Introduction
10.1.1. Basis Point Share (BPS) Analysis by Country
10.1.2. Y-o-Y Growth Projections by Country
10.2. Pricing Analysis
10.3. Europe Advanced Packaging Technologies Market Value (US$ Mn) and Volume (Mn Units) Forecast, by Country
10.3.1. Germany
10.3.2. France
10.3.3. U.K.
10.3.4. Spain
10.3.5. Italy
10.3.6. Benelux
10.3.7. Nordic
10.3.8. Russia
10.3.9. Poland
10.3.10. Rest of Europe
10.4. Market Value (US$ Mn) and Volume (Mn Units) Forecast, by Technology
10.4.1. Active Packaging
10.4.1.1. Active Scavenging Systems
10.4.1.1.1. Oxygen Scavengers
10.4.1.1.2. Moisture Scavengers
10.4.1.1.3. Ethylene Absorbers
10.4.1.2. Active Releasing Systems
10.4.1.2.1. Antioxidant Releasers
10.4.1.2.2. Carbon Dioxide Emitters
10.4.1.3. Modified Atmosphere Packages (MAP)
10.4.1.4. Temperature Control Packaging
10.4.1.5. Anti-Corrosion Films
10.4.2. Smart and Intelligent Packaging
10.4.2.1. Time-Temperature Indicators (TTI)
10.4.2.2. Freshness Indicators
10.4.2.3. Oxygen and Carbon Dioxide Indicators
10.4.2.4. RFID
10.4.2.5. Others
10.5. Market Value (US$ Mn) and Volume (Mn Units) Forecast, by End Use
10.5.1. Food
10.5.1.1. Meat, Poultry and Seafood
10.5.1.2. Fruits and Vegetables
10.5.1.3. Ready-to-Eat Meals
10.5.1.4. Dairy Foods
10.5.1.5. Bakery and Confectionery
10.5.1.6. Frozen Foods
10.5.1.7. Cereals
10.5.2. Beverages
10.5.2.1. Alcoholic Beverages
10.5.2.2. Non-Alcoholic Beverages
10.5.3. Pharmaceuticals
10.5.4. Industrial & Chemicals
10.5.5. Cosmetics & Personal Care
10.5.6. Agriculture
10.5.7. Others
10.6. Key Market Participants - Intensity Mapping
10.7. Drivers and Restraints: Impact Analysis
11. Asia-Pacific Advanced Packaging Technologies Market Analysis
11.1. Introduction
11.1.1. Basis Point Share (BPS) Analysis by Country
11.1.2. Y-o-Y Growth Projections by Country
11.2. Pricing Analysis
11.3. Asia-Pacific Advanced Packaging Technologies Market Value (US$ Mn) and Volume (Mn Units) Forecast, by Country
11.3.1. China
11.3.2. India
11.3.3. Japan
11.3.4. ASEAN
11.3.5. Rest of APAC
11.4. Market Value (US$ Mn) and Volume (Mn Units) Forecast, by Technology
11.4.1. Active Packaging
11.4.1.1. Active Scavenging Systems
11.4.1.1.1. Oxygen Scavengers
11.4.1.1.2. Moisture Scavengers
11.4.1.1.3. Ethylene Absorbers
11.4.1.2. Active Releasing Systems
11.4.1.2.1. Antioxidant Releasers
11.4.1.2.2. Carbon Dioxide Emitters
11.4.1.3. Modified Atmosphere Packages (MAP)
11.4.1.4. Temperature Control Packaging
11.4.1.5. Anti-Corrosion Films
11.4.2. Smart and Intelligent Packaging
11.4.2.1. Time-Temperature Indicators (TTI)
11.4.2.2. Freshness Indicators
11.4.2.3. Oxygen and Carbon Dioxide Indicators
11.4.2.4. RFID
11.4.2.5. Others
11.5. Market Value (US$ Mn) and Volume (Mn Units) Forecast, by End Use
11.5.1. Food
11.5.1.1. Meat, Poultry and Seafood
11.5.1.2. Fruits and Vegetables
11.5.1.3. Ready-to-Eat Meals
11.5.1.4. Dairy Foods
11.5.1.5. Bakery and Confectionery
11.5.1.6. Frozen Foods
11.5.1.7. Cereals
11.5.2. Beverages
11.5.2.1. Alcoholic Beverages
11.5.2.2. Non-Alcoholic Beverages
11.5.3. Pharmaceuticals
11.5.4. Industrial & Chemicals
11.5.5. Cosmetics & Personal Care
11.5.6. Agriculture
11.5.7. Others
11.6. Key Market Participants - Intensity Mapping
11.7. Drivers and Restraints: Impact Analysis
12. Middle East & Africa Advanced Packaging Technologies Market Analysis
12.1. Introduction
12.1.1. Basis Point Share (BPS) Analysis by Country
12.1.2. Y-o-Y Growth Projections by Country
12.2. Pricing Analysis
12.3. Middle East & Africa Advanced Packaging Technologies Market Value (US$ Mn) and Volume (Mn Units) Forecast, by Country
12.3.1. GCC Countries
12.3.2. Northern Africa
12.3.3. South Africa
12.3.4. Rest of MEA
12.4. Market Value (US$ Mn) and Volume (Mn Units) Forecast, by Technology
12.4.1. Active Packaging
12.4.1.1. Active Scavenging Systems
12.4.1.1.1. Oxygen Scavengers
12.4.1.1.2. Moisture Scavengers
12.4.1.1.3. Ethylene Absorbers
12.4.1.2. Active Releasing Systems
12.4.1.2.1. Antioxidant Releasers
12.4.1.2.2. Carbon Dioxide Emitters
12.4.1.3. Modified Atmosphere Packages (MAP)
12.4.1.4. Temperature Control Packaging
12.4.1.5. Anti-Corrosion Films
12.4.2. Smart and Intelligent Packaging
12.4.2.1. Time-Temperature Indicators (TTI)
12.4.2.2. Freshness Indicators
12.4.2.3. Oxygen and Carbon Dioxide Indicators
12.4.2.4. RFID
12.4.2.5. Others
12.5. Market Value (US$ Mn) and Volume (Mn Units) Forecast, by End Use
12.5.1. Food
12.5.1.1. Meat, Poultry and Seafood
12.5.1.2. Fruits and Vegetables
12.5.1.3. Ready-to-Eat Meals
12.5.1.4. Dairy Foods
12.5.1.5. Bakery and Confectionery
12.5.1.6. Frozen Foods
12.5.1.7. Cereals
12.5.2. Beverages
12.5.2.1. Alcoholic Beverages
12.5.2.2. Non-Alcoholic Beverages
12.5.3. Pharmaceuticals
12.5.4. Industrial & Chemicals
12.5.5. Cosmetics & Personal Care
12.5.6. Agriculture
12.5.7. Others
12.6. Key Market Participants - Intensity Mapping
12.7. Drivers and Restraints: Impact Analysis
13. Market Structure Analysis
13.1. Market Analysis by Tier of Companies
13.1.1. By Large, Medium and Small
13.2. Market Concentration
13.2.1. By Top 5 and by Top 10
13.3. Market Share Analysis of Top 10 Players
13.4. Market Presence Analysis
14. Competitive Landscape
14.1. Competition Dashboard
14.2. Competition Benchmarking
14.3. Profitability and Gross Margin Analysis by Competition
14.4. Competition Developments
14.5. Company Market Share Analysis
14.6. Competition Deep Dive (20 Companies)
14.6.1. PakSense Inc.
14.6.1.1. Overview
14.6.1.2. Product Portfolio
14.6.1.3. Profitability
14.6.1.4. Production Footprint
14.6.1.5. Sales Footprint
14.6.1.6. Channel Footprint
14.6.1.7. Competition Benchmarking
14.6.1.8. Strategy
14.6.1.8.1. Marketing Strategy
14.6.1.8.2. Product Strategy
14.6.1.8.3. Channel Strategy
14.6.2. Landec Corporation
14.6.2.1. Overview
14.6.2.2. Product Portfolio
14.6.2.3. Profitability
14.6.2.4. Production Footprint
14.6.2.5. Sales Footprint
14.6.2.6. Channel Footprint
14.6.2.7. Competition Benchmarking
14.6.2.8. Strategy
14.6.2.8.1. Marketing Strategy
14.6.2.8.2. Product Strategy
14.6.2.8.3. Channel Strategy
14.6.3. Sealed Air Corporation
14.6.3.1. Overview
14.6.3.2. Product Portfolio
14.6.3.3. Profitability
14.6.3.4. Production Footprint
14.6.3.5. Sales Footprint
14.6.3.6. Channel Footprint
14.6.3.7. Competition Benchmarking
14.6.3.8. Strategy
14.6.3.8.1. Marketing Strategy
14.6.3.8.2. Product Strategy
14.6.3.8.3. Channel Strategy
14.6.4. Bemis Company, Inc.
14.6.4.1. Overview
14.6.4.2. Product Portfolio
14.6.4.3. Profitability
14.6.4.4. Production Footprint
14.6.4.5. Sales Footprint
14.6.4.6. Channel Footprint
14.6.4.7. Competition Benchmarking
14.6.4.8. Strategy
14.6.4.8.1. Marketing Strategy
14.6.4.8.2. Product Strategy
14.6.4.8.3. Channel Strategy
14.6.5. Crown Holdings, Inc.
14.6.5.1. Overview
14.6.5.2. Product Portfolio
14.6.5.3. Profitability
14.6.5.4. Production Footprint
14.6.5.5. Sales Footprint
14.6.5.6. Channel Footprint
14.6.5.7. Competition Benchmarking
14.6.5.8. Strategy
14.6.5.8.1. Marketing Strategy
14.6.5.8.2. Product Strategy
14.6.5.8.3. Channel Strategy
14.6.6. Amcor Limited
14.6.6.1. Overview
14.6.6.2. Product Portfolio
14.6.6.3. Profitability
14.6.6.4. Production Footprint
14.6.6.5. Sales Footprint
14.6.6.6. Channel Footprint
14.6.6.7. Competition Benchmarking
14.6.6.8. Strategy
14.6.6.8.1. Marketing Strategy
14.6.6.8.2. Product Strategy
14.6.6.8.3. Channel Strategy
14.6.7. 3M Company
14.6.7.1. Overview
14.6.7.2. Product Portfolio
14.6.7.3. Profitability
14.6.7.4. Production Footprint
14.6.7.5. Sales Footprint
14.6.7.6. Channel Footprint
14.6.7.7. Competition Benchmarking
14.6.7.8. Strategy
14.6.7.8.1. Marketing Strategy
14.6.7.8.2. Product Strategy
14.6.7.8.3. Channel Strategy
14.6.8. Timestrip U.K. Ltd.
14.6.8.1. Overview
14.6.8.2. Product Portfolio
14.6.8.3. Profitability
14.6.8.4. Production Footprint
14.6.8.5. Sales Footprint
14.6.8.6. Channel Footprint
14.6.8.7. Competition Benchmarking
14.6.8.8. Strategy
14.6.8.8.1. Marketing Strategy
14.6.8.8.2. Product Strategy
14.6.8.8.3. Channel Strategy
14.6.9. Cryolog S.A.
14.6.9.1. Overview
14.6.9.2. Product Portfolio
14.6.9.3. Profitability
14.6.9.4. Production Footprint
14.6.9.5. Sales Footprint
14.6.9.6. Channel Footprint
14.6.9.7. Competition Benchmarking
14.6.9.8. Strategy
14.6.9.8.1. Marketing Strategy
14.6.9.8.2. Product Strategy
14.6.9.8.3. Channel Strategy
14.6.10. Vitsab International AB
14.6.10.1. Overview
14.6.10.2. Product Portfolio
14.6.10.3. Profitability
14.6.10.4. Production Footprint
14.6.10.5. Sales Footprint
14.6.10.6. Channel Footprint
14.6.10.7. Competition Benchmarking
14.6.10.8. Strategy
14.6.10.8.1. Marketing Strategy
14.6.10.8.2. Product Strategy
14.6.10.8.3. Channel Strategy
14.6.11. Varcode, Ltd.
14.6.11.1. Overview
14.6.11.2. Product Portfolio
14.6.11.3. Profitability
14.6.11.4. Production Footprint
14.6.11.5. Sales Footprint
14.6.11.6. Channel Footprint
14.6.11.7. Competition Benchmarking
14.6.11.8. Strategy
14.6.11.8.1. Marketing Strategy
14.6.11.8.2. Product Strategy
14.6.11.8.3. Channel Strategy
14.6.12. LCR Hallcrest LLC
14.6.12.1. Overview
14.6.12.2. Product Portfolio
14.6.12.3. Profitability
14.6.12.4. Production Footprint
14.6.12.5. Sales Footprint
14.6.12.6. Channel Footprint
14.6.12.7. Competition Benchmarking
14.6.12.8. Strategy
14.6.12.8.1. Marketing Strategy
14.6.12.8.2. Product Strategy
14.6.12.8.3. Channel Strategy
14.6.13. Thin Film Electronics ASA
14.6.13.1. Overview
14.6.13.2. Product Portfolio
14.6.13.3. Profitability
14.6.13.4. Production Footprint
14.6.13.5. Sales Footprint
14.6.13.6. Channel Footprint
14.6.13.7. Competition Benchmarking
14.6.13.8. Strategy
14.6.13.8.1. Marketing Strategy
14.6.13.8.2. Product Strategy
14.6.13.8.3. Channel Strategy
14.6.14. CCL Industries Inc.
14.6.14.1. Overview
14.6.14.2. Product Portfolio
14.6.14.3. Profitability
14.6.14.4. Production Footprint
14.6.14.5. Sales Footprint
14.6.14.6. Channel Footprint
14.6.14.7. Competition Benchmarking
14.6.14.8. Strategy
14.6.14.8.1. Marketing Strategy
14.6.14.8.2. Product Strategy
14.6.14.8.3. Channel Strategy
14.6.15. Temptime Corporation
14.6.15.1. Overview
14.6.15.2. Product Portfolio
14.6.15.3. Profitability
14.6.15.4. Production Footprint
14.6.15.5. Sales Footprint
14.6.15.6. Channel Footprint
14.6.15.7. Competition Benchmarking
14.6.15.8. Strategy
14.6.15.8.1. Marketing Strategy
14.6.15.8.2. Product Strategy
14.6.15.8.3. Channel Strategy
14.6.16. Multisorb Technologies, Inc.
14.6.16.1. Overview
14.6.16.2. Product Portfolio
14.6.16.3. Profitability
14.6.16.4. Production Footprint
14.6.16.5. Sales Footprint
14.6.16.6. Channel Footprint
14.6.16.7. Competition Benchmarking
14.6.16.8. Strategy
14.6.16.8.1. Marketing Strategy
14.6.16.8.2. Product Strategy
14.6.16.8.3. Channel Strategy
14.6.17. Coveris Holdings S.A.
14.6.17.1. Overview
14.6.17.2. Product Portfolio
14.6.17.3. Profitability
14.6.17.4. Production Footprint
14.6.17.5. Sales Footprint
14.6.17.6. Channel Footprint
14.6.17.7. Competition Benchmarking
14.6.17.8. Strategy
14.6.17.8.1. Marketing Strategy
14.6.17.8.2. Product Strategy
14.6.17.8.3. Channel Strategy
14.6.18. Ball Corporation
14.6.18.1. Overview
14.6.18.2. Product Portfolio
14.6.18.3. Profitability
14.6.18.4. Production Footprint
14.6.18.5. Sales Footprint
14.6.18.6. Channel Footprint
14.6.18.7. Competition Benchmarking
14.6.18.8. Strategy
14.6.18.8.1. Marketing Strategy
14.6.18.8.2. Product Strategy
14.6.18.8.3. Channel Strategy
14.6.19. SYSCO Corporation
14.6.19.1. Overview
14.6.19.2. Product Portfolio
14.6.19.3. Profitability
14.6.19.4. Production Footprint
14.6.19.5. Sales Footprint
14.6.19.6. Channel Footprint
14.6.19.7. Competition Benchmarking
14.6.19.8. Strategy
14.6.19.8.1. Marketing Strategy
14.6.19.8.2. Product Strategy
14.6.19.8.3. Channel Strategy
14.6.20. VIP Packaging
14.6.20.1. Overview
14.6.20.2. Product Portfolio
14.6.20.3. Profitability
14.6.20.4. Production Footprint
14.6.20.5. Sales Footprint
14.6.20.6. Channel Footprint
14.6.20.7. Competition Benchmarking
14.6.20.8. Strategy
14.6.20.8.1. Marketing Strategy
14.6.20.8.2. Product Strategy
14.6.20.8.3. Channel Strategy
15. Assumptions and Acronyms Used
16. Research Methodology
List of Tables
Table 01: Global Advanced Packaging Technologies Market Value (US$ Mn) and Volume (Mn Units) 2017-2026, by Technology
Table 02: Global Advanced Packaging Technologies Market Value (US$ Mn) and Volume (Mn Units) 2017-2026, by Technology
Table 03: Global Advanced Packaging Technologies Market Value (US$ Mn) and Volume (Mn Units) 2017-2026, by Technology
Table 04: Global Advanced Packaging Technologies Market Value (US$ Mn) and Volume (Mn Units) 2017-2026, by End Use
Table 05: Global Advanced Packaging Technologies Market Value (US$ Mn) and Volume (Mn Units) 2017-2026, by End Use
Table 06: Global Advanced Packaging Technologies Market Value (US$ Mn) and Volume (Mn Units) 2017-2026, by Country
Table 07: North America Advanced Packaging Technologies market Value (US$ Mn) and Volume (Mn Units) Forecast, by Country, 2016(A) – 2026(F
Table 08: North America Advanced Packaging Technologies Market Value (US$ Mn) and Volume (Mn Units) 2017-2026, by Technology
Table 09: North America Advanced Packaging Technologies Market Value (US$ Mn) and Volume (Mn Units) 2017-2026, by Technology
Table 10: North America Advanced Packaging Technologies Market Value (US$ Mn) and Volume (Mn Units) 2017-2026, by Technology
Table 11: North America Advanced Packaging Technologies Market Value (US$ Mn) and Volume (Mn Units) 2017-2026, by End Use
Table 12: North America Advanced Packaging Technologies Market Value (US$ Mn) and Volume (Mn Units) 2017-2026, by End Use
Table 13: Latin America Advanced Packaging Technologies market Value (US$ Mn) and Volume (Mn Units) Forecast, by Country, 2016(A) – 2026(F)
Table 14: Latin America Advanced Packaging Technologies Market Value (US$ Mn) and Volume (Mn Units) 2017-2026, by Technology
Table 15: Latin America Advanced Packaging Technologies Market Value (US$ Mn) and Volume (Mn Units) 2017-2026, by Technology
Table 16: Latin America Advanced Packaging Technologies Market Value (US$ Mn) and Volume (Mn Units) 2017-2026, by Technology
Table 17: Latin America Advanced Packaging Technologies Market Value (US$ Mn) and Volume (Mn Units) 2017-2026, by End Use
Table 18: Latin America Advanced Packaging Technologies Market Value (US$ Mn) and Volume (Mn Units) 2017-2026, by End Use
Table 19: Europe Advanced Packaging Technologies market Value (US$ Mn) and Volume (Mn Units) Forecast, by Country, 2016(A) – 2026(F)
Table 20: Europe Advanced Packaging Technologies Market Value (US$ Mn) and Volume (Mn Units) 2017-2026, by Technology
Table 21: Europe Advanced Packaging Technologies Market Value (US$ Mn) and Volume (Mn Units) 2017-2026, by Technology
Table 22: Europe Advanced Packaging Technologies Market Value (US$ Mn) and Volume (Mn Units) 2017-2026, by Technology
Table 23: Europe Advanced Packaging Technologies Market Value (US$ Mn) and Volume (Mn Units) 2017-2026, by End Use
Table 24: Europe Advanced Packaging Technologies Market Value (US$ Mn) and Volume (Mn Units) 2017-2026, by End Use
List of Figures
Figure 01: Global Advanced Packaging Technologies Market Value (US$ Mn), and Volume (Mn Units) analysis, 2017-2026
Figure 02: Global Advanced Packaging Technologies Market Absolute $ Opportunity, 2018-2026
Figure 03: Global Advanced Packaging Technologies Market Value Share and BPS Analysis, by Technology, 2018 & 2026
Figure 04: Global Advanced Packaging Technologies Market Y-o-Y growth, by Technology 2018 & 2026
Figure 05: Global Advanced Packaging Technologies Market Attractiveness Analysis, by Technology, 2018
Figure 06: Global Advanced Packaging Technologies Market Value (US$ Mn), and Volume (Mn Units) Analysis, by Active Packaging Segment, 2017-2026
Figure 07: Global Advanced Packaging Technologies Market Absolute $ Opportunity, by Active Packaging Segment, 2018-2026
Figure 08: Global Advanced Packaging Technologies Market Value (US$ Mn), and Volume (Mn Units) analysis, by Smart and Intelligent Packaging Segment, 2017-2026
Figure 09: Global Advanced Packaging Technologies Market Absolute $ Opportunity, by Smart and Intelligent Packaging Segment, 2018-2026
Figure 10: Global Advanced Packaging Technologies Market Value Share and BPS Analysis, by End Use, 2018 & 2026
Figure 11: Global Advanced Packaging Technologies Market Y-o-Y Growth, by End Use 2018 & 2026
Figure 12: Global Advanced Packaging Technologies Market Attractiveness Analysis, by End Use, 2018
Figure 13: Global Advanced Packaging Technologies Market Value (US$ Mn), and Volume (Mn Units) analysis, by Food Segment, 2017-2026
Figure 14: Global Advanced Packaging Technologies Market Absolute $ Opportunity, by Food Segment, 2018-2026
Figure 15: Global Advanced Packaging Technologies Market Value (US$ Mn), and Volume (Mn Units) analysis, by Beverages Segment, 2017-2026
Figure 16: Global Advanced Packaging Technologies Market Absolute $ Opportunity, by Beverages Segment, 2018-2026
Figure 17: Global Advanced Packaging Technologies Market Value (US$ Mn), and Volume (Mn Units) analysis, by Pharmaceuticals Segment, 2017-2026
Figure 18: Global Advanced Packaging Technologies Market Absolute $ Opportunity, by Pharmaceuticals Segment, 2018-2026
Figure 19: Global Advanced Packaging Technologies Market Value (US$ Mn), and Volume (Mn Units) Analysis, By Industrial & Chemicals Segment, 2017-2026
Figure 20: Global Advanced Packaging Technologies Market Absolute $ Opportunity, by Industrial & Chemicals Segment, 2018-2026
Figure 21: Global Advanced Packaging Technologies Market Value (US$ Mn), and Volume (Mn Units) analysis, by Cosmetics & Personal Care Segment, 2017-2026
Figure 22: Global Advanced Packaging Technologies Market Absolute $ Opportunity, by Cosmetics & Personal Care Segment, 2018-2026
Figure 23: Global Advanced Packaging Technologies Market Value (US$ Mn), and Volume (Mn Units) analysis, by Agriculture Segment, 2017-2026
Figure 24: Global Advanced Packaging Technologies Market Absolute $ Opportunity, by Agriculture Segment, 2018-2026
Figure 25: Global Advanced Packaging Technologies Market Value (US$ Mn), and Volume (Mn Units) analysis, by Others Segment, 2017-2026
Figure 26: Global Advanced Packaging Technologies Market Absolute $ Opportunity, by Others Segment, 2018-2026
Figure 27: Global Advanced Packaging Technologies Market Value Share and BPS Analysis, by Region, 2018 & 2026
Figure 28: Global Advanced Packaging Technologies Market Y-o-Y growth, by Region 2018 & 2026
Figure 29: Global Advanced Packaging Technologies Market Attractiveness Analysis, by Region, 2018
Figure 30: North America Advanced Packaging Technologies Market Value (US$ Mn), and Volume (Mn Units) Analysis, 2017-2026
Figure 31: North America Advanced Packaging Technologies Market Absolute $ Opportunity, 2018-2026
Figure 32: North America Advanced Packaging Technologies Market Value Share 2017, by Country
Figure 33: North America Advanced Packaging Technologies Market Value Share 2017, by End Use
Figure 34: North America Advanced Packaging Technologies Market Value Share 2017, by Technology
Figure 35: North America Advanced Packaging Technologies Market Value Share and BPS Analysis, by Country, 2018 & 2026
Figure 36: North America Advanced Packaging Technologies Market Attractiveness Index, by Country, 2018–2026
Figure 37: North America Advanced Packaging Technologies Market Absolute $ opportunity (2018-2026), by Country
Figure 38: North America Advanced Packaging Technologies Absolute $ Opportunity (2018-2026), by Country
Figure 39: North America Advanced Packaging Technologies Market Attractiveness Index, by Technology, 2018–2026
Figure 40: North America Advanced Packaging Technologies Market Y-o-Y Growth, by Technology, 2018 & 2026
Figure 41: North America Advanced Packaging Technologies Market Attractiveness Index, by End Use, 2018–2026
Figure 42: North America Advanced Packaging Technologies Market Y-o-Y growth, by End Use, 2018 & 2026
Figure 43: Latin America Advanced Packaging Technologies Market Value (US$ Mn), and Volume (Mn Units) analysis, 2017-2026
Figure 44: Latin America Advanced Packaging Technologies Market Absolute $ Opportunity, 2018-2026
Figure 45: Latin America Advanced Packaging Technologies Market Value Share 2017, by Country
Figure 46: Latin America Advanced Packaging Technologies Market Value Share 2017, by End Use
Figure 47: Latin America Advanced Packaging Technologies Market Value Share 2017, by Technology
Figure 48: Latin America Advanced Packaging Technologies Market Value Share and BPS Analysis, by Country, 2018 & 2026
Figure 49: Latin America Advanced Packaging Technologies Market Attractiveness Index, by Country, 2018–2026
Figure 50: Latin America Advanced Packaging Technologies Market Absolute $ Opportunity (2018-2026), by Country
Figure 51: Latin America Advanced Packaging Technologies Absolute $ Opportunity (2018-2026), by Country
Figure 52: Latin America Advanced Packaging Technologies Market Absolute $ Opportunity (2018-2026), by Country
Figure 53: Latin America Advanced Packaging Technologies Absolute $ Opportunity (2018-2026), by Country
Figure 54: Latin America Advanced Packaging Technologies Market Attractiveness Index, by Technology, 2018–2026
Figure 55: Latin America Advanced Packaging Technologies Market Y-o-Y Growth, by Technology, 2018 & 2026
Figure 56: Latin America Advanced Packaging Technologies Market Attractiveness Index, by End Use, 2018–2026
Figure 57: Latin America Advanced Packaging Technologies Market Y-o-Y Growth, by End Use, 2018 & 2026
Figure 58: Europe Advanced Packaging Technologies Market Value (US$ Mn), and Volume (Mn Units) analysis, 2017-2026
Figure 59: Europe Advanced Packaging Technologies Market Absolute $ Opportunity, 2018-2026
Figure 60: Europe Advanced Packaging Technologies Market Value Share 2017, by Country
Figure 61: Europe Advanced Packaging Technologies Market Value Share 2017, by End Use
Figure 62: Europe Advanced Packaging Technologies Market Value Share 2017, by Technology
Figure 63: Europe Advanced Packaging Technologies Market Value Share and BPS Analysis, by Country, 2018 & 2026
Figure 64: Europe Advanced Packaging Technologies Market Attractiveness Index, by Country, 2018–2026
Figure 65: Europe Advanced Packaging Technologies Market Absolute $ Opportunity (2018-2026), by Country
Figure 66: Europe Advanced Packaging Technologies Absolute $ Opportunity (2018-2026), by Country
Figure 67: Europe Advanced Packaging Technologies Market Absolute $ Opportunity (2018-2026), by Country
Figure 68: Europe Advanced Packaging Technologies Absolute $ Opportunity (2018-2026), by Country
Figure 69: Europe Advanced Packaging Technologies Market Absolute $ Opportunity (2018-2026), by Country
Figure 70: Europe Advanced Packaging Technologies Absolute $ Opportunity (2018-2026), by Country
Figure 71: Europe Advanced Packaging Technologies Market Absolute $ Opportunity (2018-2026), by Country
Figure 72: Europe Advanced Packaging Technologies Absolute $ Opportunity (2018-2026), by Country
Figure 73: Europe Advanced Packaging Technologies Market Absolute $ Opportunity (2018-2026), by Country
Figure 74: Europe Advanced Packaging Technologies Absolute $ Opportunity (2018-2026), by Country
Figure 75: Europe Advanced Packaging Technologies Market Attractiveness Index, by Technology, 2018–2026
Figure 76: Europe Advanced Packaging Technologies Market Y-o-Y Growth, by Technology, 2018 & 2026
Figure 77: Europe Advanced Packaging Technologies Market Attractiveness Index, by End Use, 2018–2026
Figure 78: Europe Advanced Packaging Technologies Market Y-o-Y Growth, by End Use, 2018 & 2026
Figure 79: Asia-Pacific Advanced Packaging Technologies Market Value (US$ Mn), and Volume (Mn Units) analysis, 2017-2026
Figure 80: Asia-Pacific Advanced Packaging Technologies Market Absolute $ Opportunity, 2018-2026
Figure 81: Asia-Pacific Advanced Packaging Technologies Market Value Share 2017, by Country
Figure 82: Asia-Pacific Advanced Packaging Technologies Market Value Share 2017, by End Use
Figure 83: Asia-Pacific Advanced Packaging Technologies Market Value Share 2017, by Technology
Figure 84: Asia-Pacific Advanced Packaging Technologies Market Value Share and BPS Analysis, by Country, 2018 & 2026
Figure 85: Asia-Pacific Advanced Packaging Technologies Market Attractiveness Index, by Country, 2018–2026
Figure 86: Asia-Pacific Advanced Packaging Technologies Market Absolute $ Opportunity (2018-2026), by Country
Figure 87: Asia-Pacific Advanced Packaging Technologies Absolute $ Opportunity (2018-2026), by Country
Figure 88: Asia-Pacific Advanced Packaging Technologies Market Absolute $ Opportunity (2018-2026), by Country
Figure 89: Asia-Pacific Advanced Packaging Technologies Absolute $ Opportunity (2018-2026), by Country
Figure 90: Asia-Pacific Advanced Packaging Technologies Market Absolute $ Opportunity (2018-2026), by Country
Figure 91: Asia-Pacific Advanced Packaging Technologies Market Attractiveness Index, by Technology, 2018–2026
Figure 92: Asia-Pacific Advanced Packaging Technologies Market Y-o-Y Growth, by Technology, 2018 & 2026
Figure 93: Asia-Pacific Advanced Packaging Technologies Market Attractiveness Index, by End Use, 2018–2026
Figure 94: Asia-Pacific Advanced Packaging Technologies Market Y-o-Y Growth, by End Use, 2018 & 2026
Figure 95: MEA Advanced Packaging Technologies Market Value (US$ Mn), and Volume (Mn Units) Analysis, 2017-2026
Figure 96: MEA Advanced Packaging Technologies Market Absolute $ Opportunity, 2018-2026
Figure 97: MEA Advanced Packaging Technologies Market Value Share 2017, by Country
Figure 98: MEA Advanced Packaging Technologies Market Value Share 2017, by End Use
Figure 99: MEA Advanced Packaging Technologies Market Value Share 2017, by Technology
Figure 100: MEA Packaging Machinery Market Value Share and BPS Analysis, by Country, 2018 & 2026
Figure 101: MEA Packaging Machinery Market Attractiveness Index, by Country, 2018–2026
Figure 102: MEA Packaging Machinery Market absolute $ opportunity (2018-2026), by Country
Figure 103: MEA Packaging Machinery absolute $ opportunity (2018-2026), by Country
Figure 104: MEA Packaging Machinery Market absolute $ opportunity (2018-2026), by Country
Figure 105: MEA Packaging Machinery absolute $ opportunity (2018-2026), by Country
Figure 106: MEA Advanced Packaging Technologies Market Attractiveness Index, by Technology, 2018–2026
Figure 107: MEA Advanced Packaging Technologies Market Y-o-Y growth, by Technology, 2018 & 2026
Figure 108: MEA Advanced Packaging Technologies Market Attractiveness Index, by End Use, 2018–2026
Figure 109: MEA Advanced Packaging Technologies Market Y-o-Y growth, by End Use, 2018 & 2026
Copyright © Transparency Market Research, Inc. All Rights reserved
Trust Online

Advanced Packaging Technologies Market