
Reports
Reports
Gluten-free products are increasingly gaining popularity in the precooked corn flour market. This trend has compelled market players to improve gluten-free bread and cake properties. As such, bakery products account for the highest volume among all applications in the precooked corn flour market, with an estimated production of ~418,700 metric tons by the end of 2027. Hence, manufacturers are using natural hydrocolloids to enhance the properties of gluten-free bread and cake products.
Growing prevalence of autoimmune digestive diseases due to the intake of gluten has prompted the demand for gluten-free products. In order to stay competitive, companies in the precooked corn flour market landscape are using gums as gluten substitutes to mimic the viscoelastic attributes of gluten. Manufacturers are pervasively using gums to enhance dough performance and alter cake characteristics. They are using xanthan and carboxy methyl cellulose gums in corn starch to produce low-phenylalanine bread for phenylketonuria patients. Apart from corn, companies in the precooked corn flour market are expanding their offerings of gluten-free breads made from rice and buckwheat.
Convenience is an important aspect for target customers, especially the millennial population worldwide. Hence, the trend of ready-to-eat (RTE) products is gaining momentum in the precooked corn flour market space. This trend is further driven by the introduction of the food extrusion technology. Likewise, there is a growing demand for instant soup mixes to cater to the ‘on-the-go’ demand of customers.
Although conventional precooked corn flour accounts for the highest value and volume in the market landscape, the demand for organic food grains is on the rise. The precooked corn flour market is anticipated to experience change with the introduction of gluten-free pasta made from white corn and sorghum. Thus, manufacturers in the precooked corn flour supply chain are gaining approvals and certifications for their products. For instance, Nutracentis - a Bergamo agricultural startup, is a supplier of 100% Italian organic certified pasta made with archaic Italian cereals.
The precooked corn flour market is witnessing a shift in consumer preferences. Consumers are becoming health-conscious and demanding products made using the food extrusion technology, since the technology is popular for increasing the level of dietary fiber in glutinous and gluten-free RTE snacks produced from cereals and vegetable co-products.
Therefore, the process of nixtamalization is being increasingly adopted in the precooked corn flour market landscape to increase the bioavailability of vitamins in grains and improve the flavor. This technique is being used to boost export and catalyze the demand for Mexican food in European countries, since corn is an essential ingredient in Mexican cuisines. Additionally, market leaders are buying ancestral criollo varieties in white, blue, and red corn from farmers due to shifting consumer preference for natural and organic food grains.
Food Extrusion Technology Aids in Development of Healthy Food Products
Food extrusion processes are being increasingly adopted by manufacturers to produce high-quality products in a single operation. The food extrusion technology helps to reduce operational costs. As such, the extruded products application segment is projected to reach ~407,000 metric tons by the end of 2027.
Consumer awareness about gluten-free products has triggered the demand for extruded products in the precooked corn flour value chain. However, high consumption of gluten-free products results in nutritional deficiencies. Hence, manufacturers in the precooked corn flour market are overcoming this issue with protein and fiber fortification in corn-based food formulations.
The growing demand for RTE products is creating incremental opportunities for manufacturers. Thus, companies are increasing their production capabilities to produce breakfast cereals to meet convenience requirements of consumers. RTE products are gaining popularity, owing to their convenience of preparation, appearance, and texture. In order to gain a competitive edge, manufacturers are expanding their product range in premium-quality RTE snacks at competitive prices.
Analysts’ Viewpoint
Since Mexican farmers are unable to support themselves as corn-growers after NAFTA (North American Free Trade Agreement) came into effect, market leaders are extending their support to farmers to produce natural varieties of corn, as more and more consumers are demanding natural and organic varieties of corn. Companies in the precooked corn flour market are relaunching the cultivation of corn, and producing grains through biological and controlled chain of health foods.
Moreover, breakfast cereals application segment holds a significant share of the precooked corn flour market in terms of volume and value. However, processing parameters in the food extrusion technology increases the content of glycemic index in products. Hence, manufacturers should streamline their production processes to increase resistant starch and dietary fiber in RTE breakfast cereals.
Precooked Corn Flour Market: Overview
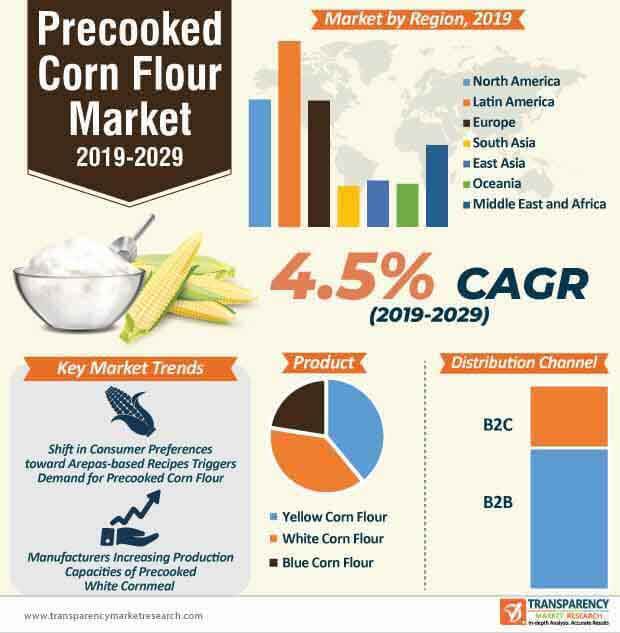
The global precooked corn flour market is projected to reach ~US$ 2 Bn by 2019. Transparency Market Research’s latest report studies the precooked corn flour market for the historical period of 2014–2018 and forecast period for 2019–2029. Globally, the precooked corn flour market is anticipated to expand at a CAGR of 4.5%, in terms of value, during the forecast period.
Steady Consumption of Traditional Food Products to Drive Precooked Corn Flour Market
Availability of Raw Material to Boost Profit Margins in Precooked Corn Flour Market
Increase in Consumption of Mexican Food to Drive Precooked Corn Flour Market
Demand for Organic Precooked Corn Flour to Increase
Precooked Corn Flour Market: Competition Landscape
Precooked Corn Flour Market: Key Developments
Some of the key developments witnessed in the precooked corn flour market over the past few years are as follows:
1. Global Precooked Corn Flour Market - Executive Summary
1.1. Global Precooked Corn Flour Market Country Analysis
1.2. Application – Product Mapping
1.3. Competition Blueprint
1.4. Technology Time Line Mapping
1.5. TMR Analysis and Recommendations
2. Market Overview
2.1. Market Introduction
2.2. Market Definition
2.3. Market Taxonomy
3. Key Market Trends
3.1. Key Trends Impacting the Market
3.2. Product Innovation / Development Trends
4. Market Dynamics
4.1. Macro-economic Factors
4.1.1. Rise in Consumption of Food Items across Globe
4.1.2. Global and Regional Per Capita Food Consumption (kcal per capita per day)
4.1.3. Change in Consumer Price Indexes (Percentage Change) 2018 (Forecast)
4.1.4. Population of Key Countries
4.1.5. Global Retail Dynamics
4.1.6. Per Capita Disposable Income
4.1.7. Global GDP Growth Outlook
4.1.8. Retail Sector GVA and Growth
4.2. Drivers
4.3. Market Restraints
4.4. Market Opportunities
4.5. Forecast Factors – Relevance and Impact
4.6. Key Regulations and Claims
5. Global Precooked Corn Flour Market Analysis and Forecast
5.1. Market Size Analysis (2014-2018) and Forecast (2019-2029)
5.1.1. Market Value (US$ Mn) and Volume (Tons) and Y-o-Y Growth
5.1.2. Absolute $ Opportunity
5.2. Global Precooked Corn Flour Market Scenario Forecast (Optimistic, Likely and Conservative Market Conditions)
5.2.1. Forecast Factors and Relevance of Impact
5.3. Key Manufactures Operating in Precooked Corn Flour Market
5.4. Brand Analysis for Precooked Corn Flour
5.5. Unique Selling Point for Precooked Corn Flour
6. Supply Chain Analysis
6.1. Profitability and Gross Margin Analysis By Competition
6.2. List of Active Participants- By Region
6.2.1. Raw Material Suppliers
6.2.2. Key Manufacturers
6.2.3. Key Distributor/Retailers
6.2.4. Operating Margins
7. Global Precooked Corn Flour Market Pricing Analysis
7.1. Price Point Assessment by Region
7.1.1. Manufacturer Level Pricing
7.1.2. Distributor Level Pricing
7.1.3. Retailer Level Pricing
7.2. Price Point Assessment by Product Type
7.3. Price Forecast till 2029
8. Global Precooked Corn Flour Market Analysis and Forecast
8.1. Market Size Analysis (2014-2018) and Forecast (2019-2029)
8.1.1. Market Value (US$ Mn) and Volume (Tons) and Y-o-Y Growth
8.1.2. Absolute $ Opportunity
8.2. Global Precooked Corn Flour Market Scenario Forecast (Optimistic, Likely and Conservative Market Conditions)
8.2.1. Forecast Factors and Relevance of Impact
8.2.2. Regional Precooked Corn Flour Market Business Per Product Type and Summary
9. Global Precooked Corn Flour Market Analysis By Nature
9.1. Introduction
9.1.1. Y-o-Y Growth Comparison By Nature
9.1.2. Basis Point Share (BPS) Analysis By Nature
9.2. Precooked Corn Flour Market Size (US$ Mn) and Volume (MT) Analysis (2014-2018) & Forecast (2019-2029) By Nature
9.2.1. Organic
9.2.2. Conventional
9.3. Market Attractiveness Analysis By Nature
10. Global Precooked Corn Flour Market Analysis By Product Type
10.1. Introduction
10.1.1. Y-o-Y Growth Comparison By Product Type
10.1.2. Basis Point Share (BPS) Analysis By Product Type
10.2. Precooked Corn Flour Market Size (US$ Mn) and Volume (MT) Analysis (2014-2018) & Forecast (2019-2029) By Product Type
10.2.1.1. Yellow Corn Flour
10.2.1.2. White Corn Flour
10.2.1.3. Blue Corn Flour
10.3. Market Attractiveness Analysis By Product Type
11. Global Precooked Corn Flour Market Analysis By Applications
11.1. Introduction
11.1.1. Y-o-Y Growth Comparison By Application
11.1.2. Basis Point Share (BPS) Analysis By Application
11.2. Precooked Corn Flour Market Size (US$ Mn) and Volume (MT) Analysis (2014-2018) & Forecast (2019-2029) By Application
11.2.1. Bakery products
11.2.2. Soup, Sauces & Dressings
11.2.3. Infant Product Typeula
11.2.4. Extruded Products
11.2.5. Breakfast Cereals
11.2.6. Noodles & Pasta
11.2.7. Other Applications
11.3. Market Attractiveness Analysis By Application
12. Global Precooked Corn Flour Market Analysis By Distribution Channel
12.1. Introduction
12.1.1. Y-o-Y Growth Comparison By Distribution Channel
12.1.2. Basis Point Share (BPS) Analysis By Distribution Channel
12.2. Precooked Corn Flour Market Size (US$ Mn) and Volume (MT) Analysis (2014-2018) & Forecast (2019-2029) By Distribution Channel
12.2.1. B2B
12.2.2. B2C
12.2.2.1. Store-Based Retailing
12.2.2.1.1. Hypermarkets/Supermarkets
12.2.2.1.2. Convenience Stores
12.2.2.1.3. Speciality Stores
12.2.2.1.4. Independent Grocery Stores
12.2.2.2. Online Retailing
12.3. Market Attractiveness Analysis By Distribution Channel
13. Global Precooked Corn Flour Market Analysis and Forecast, By Region
13.1. Introduction
13.1.1. Basis Point Share (BPS) Analysis By Region
13.1.2. Y-o-Y Growth Projections By Region
13.2. Precooked Corn Flour Market Size (US$ Mn) and Volume (MT) & Forecast (2019-2029) Analysis By Region
13.2.1. North America
13.2.2. Latin America
13.2.3. Europe
13.2.4. South Asia
13.2.5. East Asia
13.2.6. Oceania
13.2.7. Middle East and Africa
13.3. Market Attractiveness Analysis By Region
14. North America Precooked Corn Flour Market Analysis and Forecast
14.1. Introduction
14.1.1. Basis Point Share (BPS) Analysis By Country
14.1.2. Y-o-Y Growth Projections By Country
14.2. Precooked Corn Flour Market Size (Value (US$) and Volume (MT) Analysis (2014-2018) and Forecast (2019-2029)
14.2.1. Market Attractiveness By Country
14.2.1.1. U.S.
14.2.1.2. Canada
14.2.2. By Nature
14.2.3. By Product Type
14.2.4. By Application
14.2.5. By Distribution Channel
14.3. Market Attractiveness Analysis
14.3.1. By Country
14.3.2. By Nature
14.3.3. By Product Type
14.3.4. By Application
14.3.5. By Distribution Channel
14.4. Drivers and Restraints: Impact Analysis
14.5. Heat Map Analysis
14.6. Market Trends
15. Latin America Precooked Corn Flour Market Analysis and Forecast
15.1. Introduction
15.1.1. Basis Point Share (BPS) Analysis By Country
15.1.2. Y-o-Y Growth Projections By Country
15.1.3. Key Regulations
15.2. Precooked Corn Flour Market Size (Value (US$) and Volume (MT) Analysis (2014-2018) and Forecast (2019-2029)
15.2.1. By Country
15.2.1.1. Brazil
15.2.1.2. Mexico
15.2.1.3. Colombia
15.2.1.4. Venezuela
15.2.1.5. Argentina
15.2.1.6. Rest of Latin America
15.2.2. By Nature
15.2.3. By Product Type
15.2.4. By Application
15.2.5. By Distribution Channel
15.3. Market Attractiveness Analysis
15.3.1. By Country
15.3.2. By Nature
15.3.3. By Product Type
15.3.4. By Application
15.3.5. By Distribution Channel
15.4. Drivers and Restraints: Impact Analysis
15.5. Heat Map Analysis
15.6. Market Trends
16. Europe Precooked Corn Flour Market Analysis and Forecast
16.1. Introduction
16.1.1. Basis Point Share (BPS) Analysis By Country
16.1.2. Y-o-Y Growth Projections By Country
16.1.3. Key Regulations
16.2. Precooked Corn Flour Market Size (Value (US$) and Volume (MT) Analysis (2014-2018) and Forecast (2019-2029)
16.2.1. By Country
16.2.1.1. France
16.2.1.2. Germany
16.2.1.3. Spain
16.2.1.4. U.K.
16.2.1.5. Italy
16.2.1.6. BENELUX
16.2.1.7. Nordic
16.2.1.8. Russia
16.2.1.9. Poland
16.2.1.10. Rest of Europe
16.2.2. By Nature
16.2.3. By Product Type
16.2.4. By Application
16.2.5. By Distribution Channel
16.3. Market Attractiveness Analysis
16.3.1. By Country
16.3.2. By Nature
16.3.3. By Product Type
16.3.4. By Application
16.3.5. By Distribution Channel
16.4. Drivers and Restraints: Impact Analysis
16.5. Heat Map Analysis
16.6. Market Trends
17. South Asia Precooked Corn Flour Market Analysis and Forecast
17.1. Introduction
17.1.1. Basis Point Share (BPS) Analysis By Country
17.1.2. Y-o-Y Growth Projections By Country
17.1.3. Key Regulations
17.2. Precooked Corn Flour Market Size (Value (US$) and Volume (MT) Analysis (2014-2018) and Forecast (2019-2029)
17.2.1. By Country
17.2.1.1. India
17.2.1.2. Thailand
17.2.1.3. Malaysia
17.2.1.4. Singapore
17.2.1.5. Rest of South Asia
17.2.2. By Nature
17.2.3. By Product Type
17.2.4. By Application
17.2.5. By Distribution Channel
17.3. Market Attractiveness Analysis
17.3.1. By Country
17.3.2. By Nature
17.3.3. By Product Type
17.3.4. By Application
17.3.5. By Distribution Channel
17.4. Drivers and Restraints: Impact Analysis
17.5. Heat Map Analysis
17.6. Market Trends
18. East Asia Precooked Corn Flour Market Analysis and Forecast
18.1. Introduction
18.1.1. Basis Point Share (BPS) Analysis By Country
18.1.2. Y-o-Y Growth Projections By Country
18.1.3. Key Regulations
18.2. Precooked Corn Flour Market Size (Value (US$) and Volume (MT) Analysis (2014-2018) and Forecast (2019-2029)
18.2.1. By Country
18.2.1.1. China
18.2.1.2. Japan
18.2.1.3. South Korea
18.2.2. By Nature
18.2.3. By Product Type
18.2.4. By Application
18.2.5. By Distribution Channel
18.3. Market Attractiveness Analysis
18.3.1. By Country
18.3.2. By Nature
18.3.3. By Product Type
18.3.4. By Application
18.3.5. By Distribution Channel
18.4. Drivers and Restraints: Impact Analysis
18.5. Heat Map Analysis
18.6. Market Trends
19. Oceania Precooked Corn Flour Market Analysis and Forecast
19.1. Introduction
19.1.1. Basis Point Share (BPS) Analysis By Country
19.1.2. Y-o-Y Growth Projections By Country
19.1.3. Key Regulations
19.2. Precooked Corn Flour Market Size (Value (US$) and Volume (MT) Analysis (2014-2018) and Forecast (2019-2029)
19.2.1. By Country
19.2.1.1. Australia
19.2.1.2. New Zealand
19.2.2. By Nature
19.2.3. By Product Type
19.2.4. By Application
19.2.5. By Distribution Channel
19.3. Market Attractiveness Analysis
19.3.1. By Nature
19.3.2. By Product Type
19.3.3. By Application
19.3.4. By Distribution Channel
19.4. Drivers and Restraints: Impact Analysis
19.5. Heat Map Analysis
19.6. Market Trends
20. Middle East and Africa (MEA) Precooked Corn Flour Market Analysis and Forecast
20.1. Introduction
20.1.1. Basis Point Share (BPS) Analysis By Country
20.1.2. Y-o-Y Growth Projections By Country
20.1.3. Key Regulations
20.2. Precooked Corn Flour Market Size (Value (US$) and Volume (MT) Analysis (2014-2018) and Forecast (2019-2029)
20.2.1. By Country
20.2.1.1. GCC Countries
20.2.1.2. South Africa
20.2.1.3. Rest of MEA
20.2.2. By Nature
20.2.3. By Product Type
20.2.4. By Application
20.2.5. By Distribution Channel
20.3. Market Attractiveness Analysis
20.3.1. By Country
20.3.2. By Nature
20.3.3. By Product Type
20.3.4. By Application
20.3.5. By Distribution Channel
20.4. Drivers and Restraints: Impact Analysis
20.5. Heat Map Analysis
20.6. Market Trends
21. Competition Assessment
21.1. Global Precooked Corn Flour Market Competition - a Dashboard View
21.2. Global Precooked Corn Flour Market Structure Analysis
21.3. Global Precooked Corn Flour Market Company Share Analysis
21.3.1. For Tier 1 Market Players, 2018
21.3.2. Company Market Share Analysis of Top 5 Players, By Region
21.4. Key Participants Market Presence (Intensity Mapping) by Region
22. Competition Deep-dive (Manufacturers/Suppliers/ Distribution Channel Product Manufacturer)
22.1. Bunge Limited
22.1.1. Overview
22.1.2. Product Portfolio
22.1.3. Sales Footprint
22.1.4. Channel Footprint
22.1.4.1. Distributors List
22.1.4.2. Sales Channel (Clients)
22.1.5. Strategy Overview
22.1.5.1. Marketing Strategy
22.1.5.2. Culture Strategy
22.1.5.3. Channel Strategy
22.1.6. SWOT Analysis
22.1.7. Financial Analysis
22.1.8. Revenue Share
22.1.9. Key Clients
22.1.10. Analyst Comments
22.2. Archer-Daniels-Midland Co
22.2.1. Overview
22.2.2. Product Portfolio
22.2.3. Sales Footprint
22.2.4. Channel Footprint
22.2.4.1. Distributors List
22.2.4.2. Sales Channel (Clients)
22.2.5. Strategy Overview
22.2.5.1. Marketing Strategy
22.2.5.2. Culture Strategy
22.2.5.3. Channel Strategy
22.2.6. SWOT Analysis
22.2.7. Financial Analysis
22.2.8. Revenue Share
22.2.9. Key Clients
22.2.10. Analyst Comments
22.3. Cargill, Incorporated
22.3.1. Overview
22.3.2. Product Portfolio
22.3.3. Sales Footprint
22.3.4. Channel Footprint
22.3.4.1. Distributors List
22.3.4.2. Sales Channel (Clients)
22.3.5. Strategy Overview
22.3.5.1. Marketing Strategy
22.3.5.2. Culture Strategy
22.3.5.3. Channel Strategy
22.3.6. SWOT Analysis
22.3.7. Financial Analysis
22.3.8. Revenue Share
22.3.9. Key Clients
22.3.10. Analyst Comments
22.4. Harinera Del Valle
22.4.1. Overview
22.4.2. Product Portfolio
22.4.3. Sales Footprint
22.4.4. Channel Footprint
22.4.4.1. Distributors List
22.4.4.2. Sales Channel (Clients)
22.4.5. Strategy Overview
22.4.5.1. Marketing Strategy
22.4.5.2. Culture Strategy
22.4.5.3. Channel Strategy
22.4.6. SWOT Analysis
22.4.7. Financial Analysis
22.4.8. Revenue Share
22.4.9. Key Clients
22.4.10. Analyst Comments
22.5. Empresas Polar
22.5.1. Overview
22.5.2. Product Portfolio
22.5.3. Sales Footprint
22.5.4. Channel Footprint
22.5.4.1. Distributors List
22.5.4.2. Sales Channel (Clients)
22.5.5. Strategy Overview
22.5.5.1. Marketing Strategy
22.5.5.2. Culture Strategy
22.5.5.3. Channel Strategy
22.5.6. SWOT Analysis
22.5.7. Financial Analysis
22.5.8. Revenue Share
22.5.9. Key Clients
22.5.10. Analyst Comments
22.6. Gruma SAB de CV
22.6.1. Overview
22.6.2. Product Portfolio
22.6.3. Sales Footprint
22.6.4. Channel Footprint
22.6.4.1. Distributors List
22.6.4.2. Sales Channel (Clients)
22.6.5. Strategy Overview
22.6.5.1. Marketing Strategy
22.6.5.2. Culture Strategy
22.6.5.3. Channel Strategy
22.6.6. SWOT Analysis
22.6.7. Financial Analysis
22.6.8. Revenue Share
22.6.9. Key Clients
22.6.10. Analyst Comments
22.7. The Quaker Oats Company
22.7.1. Overview
22.7.2. Product Portfolio
22.7.3. Sales Footprint
22.7.4. Channel Footprint
22.7.4.1. Distributors List
22.7.4.2. Sales Channel (Clients)
22.7.5. Strategy Overview
22.7.5.1. Marketing Strategy
22.7.5.2. Culture Strategy
22.7.5.3. Channel Strategy
22.7.6. SWOT Analysis
22.7.7. Financial Analysis
22.7.8. Revenue Share
22.7.9. Key Clients
22.7.10. Analyst Comments
22.8. Molino Peila SpA
22.8.1. Overview
22.8.2. Product Portfolio
22.8.3. Sales Footprint
22.8.4. Channel Footprint
22.8.4.1. Distributors List
22.8.4.2. Sales Channel (Clients)
22.8.5. Strategy Overview
22.8.5.1. Marketing Strategy
22.8.5.2. Culture Strategy
22.8.5.3. Channel Strategy
22.8.6. SWOT Analysis
22.8.7. Financial Analysis
22.8.8. Revenue Share
22.8.9. Key Clients
22.8.10. Analyst Comments
22.9. Lifeline Foods
22.9.1. Overview
22.9.2. Product Portfolio
22.9.3. Sales Footprint
22.9.4. Channel Footprint
22.9.4.1. Distributors List
22.9.4.2. Sales Channel (Clients)
22.9.5. Strategy Overview
22.9.5.1. Marketing Strategy
22.9.5.2. Culture Strategy
22.9.5.3. Channel Strategy
22.9.6. SWOT Analysis
22.9.7. Financial Analysis
22.9.8. Revenue Share
22.9.9. Key Clients
22.9.10. Analyst Comments
22.10. Groupe Limagrain
22.10.1. Overview
22.10.2. Product Portfolio
22.10.3. Sales Footprint
22.10.4. Channel Footprint
22.10.4.1. Distributors List
22.10.4.2. Sales Channel (Clients)
22.10.5. Strategy Overview
22.10.5.1. Marketing Strategy
22.10.5.2. Culture Strategy
22.10.5.3. Channel Strategy
22.10.6. SWOT Analysis
22.10.7. Financial Analysis
22.10.8. Revenue Share
22.10.9. Key Clients
22.10.10. Analyst Comments
22.11. Cool Chile Company
22.11.1. Overview
22.11.2. Product Portfolio
22.11.3. Sales Footprint
22.11.4. Channel Footprint
22.11.4.1. Distributors List
22.11.4.2. Sales Channel (Clients)
22.11.5. Strategy Overview
22.11.5.1. Marketing Strategy
22.11.5.2. Culture Strategy
22.11.5.3. Channel Strategy
22.11.6. SWOT Analysis
22.11.7. Financial Analysis
22.11.8. Revenue Share
22.11.9. Key Clients
22.11.10. Analyst Comments
22.12. Bob’s Red Mill Natural Foods, Inc.
22.12.1. Overview
22.12.2. Product Portfolio
22.12.3. Sales Footprint
22.12.4. Channel Footprint
22.12.4.1. Distributors List
22.12.4.2. Sales Channel (Clients)
22.12.5. Strategy Overview
22.12.5.1. Marketing Strategy
22.12.5.2. Culture Strategy
22.12.5.3. Channel Strategy
22.12.6. SWOT Analysis
22.12.7. Financial Analysis
22.12.8. Revenue Share
22.12.9. Key Clients
22.12.10. Analyst Comments
22.13. Goya Foods, Inc.
22.13.1. Overview
22.13.2. Product Portfolio
22.13.3. Sales Footprint
22.13.4. Channel Footprint
22.13.4.1. Distributors List
22.13.4.2. Sales Channel (Clients)
22.13.5. Strategy Overview
22.13.5.1. Marketing Strategy
22.13.5.2. Culture Strategy
22.13.5.3. Channel Strategy
22.13.6. SWOT Analysis
22.13.7. Financial Analysis
22.13.8. Revenue Share
22.13.9. Key Clients
22.13.10. Analyst Comments
23. Colombia Wheat Flour Market Analysis
24. Recommendation- Critical Success Factors
25. Research Methodology
26. Assumptions & Acronyms Used
Table 1: North America Precooked Corn Flour Market Value (US$ Mn) Forecast, by Country, 2019–2029
Table 2: North America Precooked Corn Flour Market Absolute $ Opportunity, by Country, 2019–2029
Table 3: North America Precooked Corn Flour Market Value (US$ Mn) Forecast, by Nature, 2019–2029
Table 4: North America Precooked Corn Flour Market Absolute $ Opportunity, by Nature, 2019–2029
Table 5: North America Precooked Corn Flour Market Value (US$ Mn) Forecast, by Product Type , 2019–2029
Table 6: North America Precooked Corn Flour Market Absolute $ Opportunity, by Product Type, 2019–2029
Table 7: North America Precooked Corn Flour Market Value (US$ Mn) Forecast, by Application , 2019–2029
Table 8: North America Precooked Corn Flour Market Absolute $ Opportunity, by Application, 2019–2029
Table 9: North America Precooked Corn Flour Market Value (US$ Mn) Forecast, by Distribution Channel , 2019–2029
Table 10: North America Precooked Corn Flour Market Absolute $ Opportunity, by Distribution Channel,2019–2029
Table 11: Latin America Precooked Corn Flour Market Value (US$ Mn) Forecast, by Country, 2019–2029
Table 12: Latin America Precooked Corn Flour Market Absolute $ Opportunity, by Country, 2019–2029
Table 13: Latin America Precooked Corn Flour Market Value (US$ Mn) Forecast, by Nature, 2019–2029
Table 14: Latin America Precooked Corn Flour Market Absolute $ Opportunity, by Nature, 2019–2029
Table 15: Latin America Precooked Corn Flour Market Value (US$ Mn) Forecast, by Product Type , 2019–2029
Table 16: Latin America Precooked Corn Flour Market Absolute $ Opportunity, by Product Type, 2019–2029
Table 17: Latin America Precooked Corn Flour Market Value (US$ Mn) Forecast, by Application, 2019–2029
Table 18: Latin America Precooked Corn Flour Market Absolute $ Opportunity, by Application, 2019–2029
Table 19: Latin America Precooked Corn Flour Market Value (US$ Mn) Forecast, by Distribution Channel, 2019–2029
Table 20: Latin America Precooked Corn Flour Market Absolute $ Opportunity, by Distribution Channel, 2019–2029
Table 21: Europe Precooked Corn Flour Market Value (US$ Mn) Forecast, by Country, 2019–2029
Table 22: Europe Precooked Corn Flour Market Absolute $ Opportunity, by Country, 2019–2029
Table 23: Europe Precooked Corn Flour Market Value (US$ Mn) Forecast, by Nature, 2019–2029
Table 24: Europe Precooked Corn Flour Market Absolute $ Opportunity, by Nature, 2019–2029
Table 25: Europe Precooked Corn Flour Market Value (US$ Mn) Forecast, by Product Type , 2019–2029
Table 26: Europe Precooked Corn Flour Market Absolute $ Opportunity, by Product Type, 2019–2029
Table 27: Europe Precooked Corn Flour Market Value (US$ Mn) Forecast, by Application, 2019–2029
Table 28: Europe Precooked Corn Flour Market Absolute $ Opportunity, by Application, 2019–2029
Table 29: Europe Precooked Corn Flour Market Value (US$ Mn) Forecast, by Distribution Channel, 2019–2029
Table 30: Europe Precooked Corn Flour Market Absolute $ Opportunity, by Distribution Channel, 2019–2029
Table 31: South Asia Precooked Corn Flour Market Value (US$ Mn) Forecast, by Country, 2019–2029
Table 32: South Asia Precooked Corn Flour Market Absolute $ Opportunity, by Country, 2019–2029
Table 33: South Asia Precooked Corn Flour Market Value (US$ Mn) Forecast, by Nature, 2019–2029
Table 34: South Asia Precooked Corn Flour Market Absolute $ Opportunity, by Nature, 2019–2029
Table 35: South Asia Precooked Corn Flour Market Value (US$ Mn) Forecast, by Product Type , 2019–2029
Table 36: South Asia Precooked Corn Flour Market Absolute $ Opportunity, by Product Type, 2019–2029
Table 37: South Asia Precooked Corn Flour Market Value (US$ Mn) Forecast, by Application, 2019–2029
Table 38: South Asia Precooked Corn Flour Market Absolute $ Opportunity, by Application, 2019–2029
Table 39: South Asia Precooked Corn Flour Market Value (US$ Mn) Forecast, by Distribution Channel, 2019–2029
Table 40: South Asia Precooked Corn Flour Market Absolute $ Opportunity, by Distribution Channel, 2019–2029
Table 41: East Asia Precooked Corn Flour Market Value (US$ Mn) Forecast, by Country, 2019–2029
Table 42: East Asia Precooked Corn Flour Market Absolute $ Opportunity, by Country, 2019–2029
Table 43: East Asia Precooked Corn Flour Market Value (US$ Mn) Forecast, by Nature, 2019–2029
Table 44: East Asia Precooked Corn Flour Market Absolute $ Opportunity, by Nature, 2019–2029
Table 45: East Asia Precooked Corn Flour Market Value (US$ Mn) Forecast, by Product Type , 2019–2029
Table 46: East Asia Precooked Corn Flour Market Absolute $ Opportunity, by Product Type, 2019–2029
Table 47: East Asia Precooked Corn Flour Market Value (US$ Mn) Forecast, by Application, 2019–2029
Table 48: East Asia Precooked Corn Flour Market Absolute $ Opportunity, by Application, 2019–2029
Table 49: East Asia Precooked Corn Flour Market Value (US$ Mn) Forecast, by Distribution Channel, 2019–2029
Table 50: East Asia Precooked Corn Flour Market Absolute $ Opportunity, by Distribution Channel, 2019–2029
Table 51: Oceania Precooked Corn Flour Market Value (US$ Mn) Forecast, by Country, 2019–2029
Table 52: Oceania Precooked Corn Flour Market Absolute $ Opportunity, by Country, 2019–2029
Table 53: Oceania Precooked Corn Flour Market Value (US$ Mn) Forecast, by Nature, 2019–2029
Table 54: Oceania Precooked Corn Flour Market Absolute $ Opportunity, by Nature, 2019–2029
Table 55: Oceania Precooked Corn Flour Market Value (US$ Mn) Forecast, by Product Type , 2019–2029
Table 56: Oceania Precooked Corn Flour Market Absolute $ Opportunity, by Product Type, 2019–2029
Table 57: Oceania Precooked Corn Flour Market Value (US$ Mn) Forecast, by Application, 2019–2029
Table 58: Oceania Precooked Corn Flour Market Absolute $ Opportunity, by Application, 2019–2029
Table 59: Oceania Precooked Corn Flour Market Value (US$ Mn) Forecast, by Distribution Channel, 2019–2029
Table 60: Oceania Precooked Corn Flour Market Absolute $ Opportunity, by Distribution Channel, 2019–2029
Table 61: MEA Precooked Corn Flour Market Value (US$ Mn) Forecast, by Country, 2019–2029
Table 62: MEA Precooked Corn Flour Market Absolute $ Opportunity, by Country, 2019–2029
Table 63: MEA Precooked Corn Flour Market Value (US$ Mn) Forecast, by Nature, 2019–2029
Table 64: MEA Precooked Corn Flour Market Absolute $ Opportunity, by Nature, 2019–2029
Table 65: MEA Precooked Corn Flour Market Value (US$ Mn) Forecast, by Product Type , 2019–2029
Table 66: MEA Precooked Corn Flour Market Absolute $ Opportunity, by Product Type, 2019–2029
Table 67: MEA Precooked Corn Flour Market Value (US$ Mn) Forecast, by Application, 2019–2029
Table 68: MEA Precooked Corn Flour Market Absolute $ Opportunity, by Application, 2019–2029
Table 69: MEA Precooked Corn Flour Market Value (US$ Mn) Forecast, by Distribution Channel, 2019–2029
Table 70: MEA Precooked Corn Flour Market Absolute $ opportunity, by Distribution Channel, 2019–2029
Table 71: Global Precooked Corn Flour Market Value (US$ Mn) Forecast, by Region, 2019–2029
Table 72: Global Precooked Corn Flour Market Absolute $ opportunity, by Region, 2019–2029
Table 73: Global Precooked Corn Flour Market Value (US$ Mn) Forecast, by Nature, 2019–2029
Table 74: Global Precooked Corn Flour Market Absolute $ opportunity, by Nature, 2019–2029
Table 75: Global Precooked Corn Flour Market Value (US$ Mn) Forecast, by Product Type, 2019–2029
Table 76: Global Precooked Corn Flour Market Absolute $ opportunity, by Product Type, 2019–2029
Table 77: Global Precooked Corn Flour Market Value (US$ Mn) Forecast, by Application, 2019–2029
Table 78: Global Precooked Corn Flour Market Absolute $ opportunity, by Application, 2019–2029
Table 79: Global Precooked Corn Flour Market Value (US$ Mn) Forecast, by Distribution Channel, 2019–2029
Table 80: Global Precooked Corn Flour Market Absolute $ Opportunity, by Distribution Channel, 2019–2029
Figure 01: Global Precooked Corn Flour Market Size and Incremental $ Opportunity (US$ Mn), 2014-2029
Figure 02: Global Corn Flour Market Value and Volume Analysis, 2019
Figure 03: Global Precooked Corn Flour Market Value Share (%) and BPS Analysis by Nature, 2019 & 2029
Figure 04: Global Precooked Corn Flour Market Y-o-Y Growth (%) Projections by Nature, 2019 & 2029
Figure 05: Global Precooked Corn Flour Market Value Share (%) and BPS Analysis by Product Type, 2019-2029
Figure 06: Global Precooked Corn Flour Market Y-o-Y Growth (%) Projections by Product Type, 2019-2029
Figure 07: Global Precooked Corn Flour Market Value Share (%) and BPS Analysis by Applications, 2014-2029
Figure 08: Global Precooked Corn Flour Market Y-o-Y Growth (%) Projections by Applications, 2014-2029
Figure 09: Global Precooked Corn Flour Market Value Share (%) and BPS Analysis by Distribution Channel, 2014-2029
Figure 10: Global Precooked Corn Flour Market Y-o-Y Growth (%) Projections by Distribution Channel, 2014-2029
Figure 11: Global Precooked Corn Flour Market Value (US$ Mn) Analysis by Nature, 2014-2029
Figure 12: Global Precooked Corn Flour Market Value Share (%) and BPS Analysis by Product Type, 2014-2029
Figure 13: Global Precooked Corn Flour Market Volume (MT) Analysis by Applications, 2014-2029
Figure 14: Global Precooked Corn Flour Market Volume (MT) Analysis by Distribution Channel, 2014-2029
Figure 15: Global Precooked Corn Flour Market Value Share (%) and BPS Analysis by Region, 2014, 2019 & 2029
Figure 16: Global Precooked Corn Flour Market Y-o-Y Growth (%) Projections by Region, 2019-2029
Figure 17: North America Precooked Corn Flour Absolute $ Opportunity Analysis, 2019-2029
Figure 18: Latin America Precooked Corn Flour Absolute $ Opportunity Analysis, 2019-2029
Figure 19: Europe Precooked Corn Flour Absolute $ Opportunity Analysis, 2019-2029
Figure 20: East Asia Precooked Corn Flour Absolute $ Opportunity Analysis, 2019-2029
Figure 21: South Asia Precooked Corn Flour Absolute $ Opportunity Analysis, 2019-2029
Figure 22: MEA Precooked Corn Flour Absolute $ Opportunity Analysis, 2019-2029
Figure 23: Middle East and Africa Precooked Corn Flour Absolute $ Opportunity Analysis, 2019-2029
Figure 24: Global Precooked Corn Flour Market Attractiveness Analysis, 2019-2029
Figure 25: North America Precooked Corn Flour Market Value BPS Analysis, by Country, 2014, 2019 & 2029
Figure 26: U.S. Precooked Corn Flour Market Value and Volume Analysis, 2014 -2029
Figure 27: Canada Precooked Corn Flour Market Value and Volume Analysis, 2014 -2029
Figure 28: U.S. Precooked Corn Flour Market Incremental $ Opportunity, 2019-2029
Figure 29: Canada Precooked Corn Flour Market Incremental $ Opportunity, 2019-2029
Figure 30: North America Precooked Corn Flour Market Value Share (%) and BPS Analysis by Nature, 2019-2029
Figure 31: North America Precooked Corn Flour Market Y-o-Y Growth (%) Projections by Nature, 2019-2029
Figure 32: North America Precooked Corn Flour Market Value Share (%) and BPS Analysis by Product Type, 2019-2029
Figure 33: North America Precooked Corn Flour Market Y-o-Y Growth (%) Projections by Product Type, 2019-2029
Figure 34: North America Precooked Corn Flour Market Value Share (%) and BPS Analysis by Applications, 2019-2029
Figure 35: North America Precooked Corn Flour Market Y-o-Y Growth (%) Projections by Applications, 2019-2029
Figure 36: North America Precooked Corn Flour Market Value Share (%) and BPS Analysis by Distribution Channel, 2019-2029
Figure 37: North America Precooked Corn Flour Market Y-o-Y Growth (%) Projections by Distribution Channel, 2019-2029
Figure 38: North America Precooked Corn Flour Market Attractiveness Analysis, by Nature, 2014-2029
Figure 39: North America Precooked Corn Flour Market Attractiveness Analysis, by Product Type, 2019-2029
Figure 40: North America Precooked Corn Flour Market Attractiveness Analysis, by Applications, 2014-2029
Figure 41: North America Precooked Corn Flour Market Attractiveness Analysis, by Distribution Channel, 2014-2029
Figure 42: Latin America Precooked Corn Flour Market Value BPS Analysis, by Country, 2014, 2019 & 2029
Figure 43: Brazil Precooked Corn Flour Market Value and Volume Analysis, 2014 -2029
Figure 44: Mexico Precooked Corn Flour Market Value and Volume Analysis, 2014 -2029
Figure 45: Colombia Precooked Corn Flour Market Value and Volume Analysis, 2014 -2029
Figure 46: Venezuela Precooked Corn Flour Market Value and Volume Analysis, 2014 -2029
Figure 47: Argentina Precooked Corn Flour Market Value and Volume Analysis, 2014 -2029
Figure 48: Rest of LATAM Precooked Corn Flour Market Value and Volume Analysis, 2014 -2029
Figure 49: Brazil Precooked Corn Flour Market Incremental $ Opportunity, 2019-2029
Figure 50: Mexico Precooked Corn Flour Market Incremental $ Opportunity, 2019-2029
Figure 51: Colombia Precooked Corn Flour Market Incremental $ Opportunity, 2019-2029
Figure 52: Venezuela Precooked Corn Flour Market Incremental $ Opportunity, 2019-2029
Figure 53: Argentina Precooked Corn Flour Market Incremental $ Opportunity, 2019-2029
Figure 54: Rest of LATAM Precooked Corn Flour Market Incremental $ Opportunity, 2019-2029
Figure 55: Latin America Precooked Corn Flour Market Value Share (%) and BPS Analysis by Nature, 2019-2029
Figure 56: Latin America Precooked Corn Flour Market Y-o-Y Growth (%) Projections by Nature, 2019-2029
Figure 57: North America Precooked Corn Flour Market Value Share (%) and BPS Analysis by Product Type, 2019-2029
Figure 58: Latin America Precooked Corn Flour Market Y-o-Y Growth (%) Projections by Product Type, 2019-2029
Figure 59: Latin America Precooked Corn Flour Market Value Share (%) and BPS Analysis by Applications, 2019-2029
Figure 60: Latin America Precooked Corn Flour Market Y-o-Y Growth (%) Projections by Applications, 2019-2029
Figure 61: Latin America Precooked Corn Flour Market Value Share (%) and BPS Analysis by Distribution Channel, 2019-2029
Figure 62: Latin America Precooked Corn Flour Market Y-o-Y Growth (%) Projections by Distribution Channel, 2019-2029
Figure 63: Latin America Precooked Corn Flour Market Attractiveness Analysis, by Nature, 2014-2029
Figure 64: Latin America Precooked Corn Flour Market Attractiveness Analysis, by Product Type, 2019-2029
Figure 65: Latin America Precooked Corn Flour Market Attractiveness Analysis, by Applications, 2014-2029
Figure 66: Latin America Precooked Corn Flour Market Attractiveness Analysis, by Distribution Channel, 2014-2029
Figure 67: Europe Precooked Corn Flour Market Value BPS Analysis, by Country, 2014, 2019 & 2029
Figure 68: France Precooked Corn Flour Market Value and Volume Analysis, 2014 -2029
Figure 69: Germany Precooked Corn Flour Market Value and Volume Analysis, 2014 -2029
Figure 70: Spain Precooked Corn Flour Market Value and Volume Analysis, 2014 -2029
Figure 71: U.K. Precooked Corn Flour Market Value and Volume Analysis, 2014 -2029
Figure 72: Italy Precooked Corn Flour Market Value and Volume Analysis, 2014 -2029
Figure 73: Benelux Precooked Corn Flour Market Value and Volume Analysis, 2014 -2029
Figure 74: Nordic Precooked Corn Flour Market Value and Volume Analysis, 2014 -2029
Figure 75: Russia Precooked Corn Flour Market Value and Volume Analysis, 2014 -2029
Figure 76: Poland Precooked Corn Flour Market Value and Volume Analysis, 2014 -2029
Figure 77: Rest of Europe Precooked Corn Flour Market Value and Volume Analysis, 2014 -2029
Figure 78: France Precooked Corn Flour Market Incremental $ Opportunity, 2019-2029
Figure 79: Germany Precooked Corn Flour Market Incremental $ Opportunity, 2019-2029
Figure 80: Spain Precooked Corn Flour Market Incremental $ Opportunity, 2019-2029
Figure 81: U.K. Precooked Corn Flour Market Incremental $ Opportunity, 2019-2029
Figure 82: Italy Precooked Corn Flour Market Incremental $ Opportunity, 2019-2029
Figure 83: Benelux Precooked Corn Flour Market Incremental $ Opportunity, 2019-2029
Figure 84: Nordic Precooked Corn Flour Market Incremental $ Opportunity, 2019-2029
Figure 85: Russia Precooked Corn Flour Market Incremental $ Opportunity, 2019-2029
Figure 86: Poland Precooked Corn Flour Market Incremental $ Opportunity, 2019-2029
Figure 87: Rest of Europe Precooked Corn Flour Market Incremental $ Opportunity, 2019-2029
Figure 88: Europe Precooked Corn Flour Market Value Share (%) and BPS Analysis by Nature, 2019-2029
Figure 89: Europe Precooked Corn Flour Market Y-o-Y Growth (%) Projections by Nature, 2019-2029
Figure 90: Europe Precooked Corn Flour Market Value Share (%) and BPS Analysis by Product Type , 2019-2029
Figure 91: Europe Precooked Corn Flour Market Y-o-Y Growth (%) Projections by Product Type , 2019-2029
Figure 92: Europe Precooked Corn Flour Market Value Share (%) and BPS Analysis by Application , 2019-2029
Figure 93: Europe Precooked Corn Flour Market Y-o-Y Growth (%) Projections by Application , 2019-2029
Figure 94: Europe Precooked Corn Flour Market Value Share (%) and BPS Analysis by Distribution Channel, 2019-2029
Figure 95: Europe Precooked Corn Flour Market Y-o-Y Growth (%) Projections by Distribution Channel, 2019-2029
Figure 96: Europe Precooked Corn Flour Market Attractiveness Analysis by Nature, 2014-2029
Figure 97: Europe Precooked Corn Flour Market Attractiveness Analysis by Product Type , 2019-2029
Figure 98: Europe Precooked Corn Flour Market Attractiveness Analysis, by Distribution Application 2014-2029.
Figure 99: Europe Precooked Corn Flour Market Attractiveness Analysis, by Distribution Channel, 2014-2029.
Figure 100: South Asia Precooked Corn Flour Market Value BPS Analysis, by Country, 2014, 2019 & 2029
Figure 101: India Precooked Corn Flour Market Value and Volume Analysis, 2014 -2029
Figure 102: Thailand Precooked Corn Flour Market Value and Volume Analysis, 2014 -2029
Figure 103: Malaysia Precooked Corn Flour Market Value and Volume Analysis, 2014 -2029
Figure 104: Singapore Precooked Corn Flour Market Value and Volume Analysis, 2014 -2029
Figure 105: Rest of South Asia Precooked Corn Flour Market Value and Volume Analysis, 2014 -2029
Figure 106: India Precooked Corn Flour Market Incremental $ Opportunity, 2019-2029
Figure 107: Thailand Precooked Corn Flour Market Incremental $ Opportunity, 2019-2029
Figure 108: Malaysia Precooked Corn Flour Market Incremental $ Opportunity, 2019-2029
Figure 109: Singapore Precooked Corn Flour Market Incremental $ Opportunity, 2019-2029
Figure 110: Rest of South Asia Precooked Corn Flour Market Incremental $ Opportunity, 2019-2029
Figure 111: South Asia Precooked Corn Flour Market Value Share (%) and BPS Analysis by Nature, 2019-2029
Figure 112: South Asia Precooked Corn Flour Market Y-o-Y Growth (%) Projections by Nature, 2019-2029
Figure 113: South Asia Precooked Corn Flour Market Value Share (%) and BPS Analysis by Product Type, 2019-2029
Figure 114: South Asia Precooked Corn Flour Market Y-o-Y Growth (%) Projections by Product Type, 2019-2029
Figure 115: South Asia Precooked Corn Flour Market Value Share (%) and BPS Analysis by Applications, 2019-2029
Figure 116: South Asia Precooked Corn Flour Market Y-o-Y Growth (%) Projections by Applications, 2019-2029
Figure 117: South Asia Precooked Corn Flour Market Value Share (%) and BPS Analysis by Distribution Channel, 2019-2029
Figure 118: South Asia Precooked Corn Flour Market Y-o-Y Growth (%) Projections by Distribution Channel, 2019-2029
Figure 119: South Asia Precooked Corn Flour Market Attractiveness Analysis, by Nature, 2014-2029
Figure 120: South Asia Precooked Corn Flour Market Attractiveness Analysis, by Product Type, 2019-2029
Figure 121: South Asia Precooked Corn Flour Market Attractiveness Analysis, by Applications, 2014-2029
Figure 122: South Asia Precooked Corn Flour Market Attractiveness Analysis, by Distribution Channel, 2014-2029
Figure 123: East Asia Precooked Corn Flour Market Value BPS Analysis, by Country, 2014, 2019 & 2029
Figure 124: China Precooked Corn Flour Market Value and Volume Analysis, 2014 -2029
Figure 125: Japan Precooked Corn Flour Market Value and Volume Analysis, 2014 -2029
Figure 126: South Korea Precooked Corn Flour Market Value and Volume Analysis, 2014 -2029
Figure 127: China Precooked Corn Flour Market Incremental $ Opportunity, 2019-2029
Figure 128: Japan Precooked Corn Flour Market Incremental $ Opportunity, 2019-2029
Figure 129: South Korea Asia Precooked Corn Flour Market Incremental $ Opportunity, 2019-2029
Figure 130: East Asia Precooked Corn Flour Market Value Share (%) and BPS Analysis by Nature, 2019-2029
Figure 131: East Asia Precooked Corn Flour Market Y-o-Y Growth (%) Projections by Nature, 2019-2029
Figure 132: East Asia Precooked Corn Flour Market Value Share (%) and BPS Analysis by Product Type, 2019-2029
Figure 133: East Asia Precooked Corn Flour Market Y-o-Y Growth (%) Projections by Product Type, 2019-2029
Figure 134: East Asia Precooked Corn Flour Market Value Share (%) and BPS Analysis by Applications, 2019-2029
Figure 135: East Asia Precooked Corn Flour Market Y-o-Y Growth (%) Projections by Applications, 2019-2029
Figure 136: East Asia Precooked Corn Flour Market Value Share (%) and BPS Analysis by Distribution Channel, 2019-2029
Figure 137: East Asia Precooked Corn Flour Market Y-o-Y Growth (%) Projections by Distribution Channel, 2019-2029
Figure 138: East Asia Precooked Corn Flour Market Attractiveness Analysis, by Nature, 2014-2029
Figure 139: East Asia Precooked Corn Flour Market Attractiveness Analysis, by Product Type, 2019-2029
Figure 140: East Asia Precooked Corn Flour Market Attractiveness Analysis, by Applications, 2014-2029
Figure 141: East Asia Precooked Corn Flour Market Attractiveness Analysis, by Distribution Channel, 2014-2029
Figure 142: Oceania Precooked Corn Flour Market Value BPS Analysis, by Country, 2014, 2019 & 2029
Figure 143: Australia Precooked Corn Flour Market Value and Volume Analysis, 2014 -2029
Figure 144: New Zealand Precooked Corn Flour Market Value and Volume Analysis, 2014 -2029
Figure 145: Australia Precooked Corn Flour Market Incremental $ Opportunity, 2019-2029
Figure 146: New Zealand Precooked Corn Flour Market Incremental $ Opportunity, 2019-2029
Figure 147: Oceania Precooked Corn Flour Market Value Share (%) and BPS Analysis by Nature, 2019-2029
Figure 148: Oceania Precooked Corn Flour Market Y-o-Y Growth (%) Projections by Nature, 2019-2029
Figure 149: Oceania Precooked Corn Flour Market Value Share (%) and BPS Analysis by Product Type, 2019-2029
Figure 150: Oceania Precooked Corn Flour Market Y-o-Y Growth (%) Projections by Product Type, 2019-2029
Figure 151: Oceania Precooked Corn Flour Market Value Share (%) and BPS Analysis by Applications, 2019-2029
Figure 152: Oceania Precooked Corn Flour Market Y-o-Y Growth (%) Projections by Applications, 2019-2029
Figure 153: Oceania Precooked Corn Flour Market Value Share (%) and BPS Analysis by Distribution Channel, 2019-2029
Figure 154: Oceania Precooked Corn Flour Market Y-o-Y Growth (%) Projections by Distribution Channel, 2019-2029
Figure 155: Oceania Precooked Corn Flour Market Attractiveness Analysis, by Nature, 2014-2029
Figure 156: Oceania Precooked Corn Flour Market Attractiveness Analysis, by Product Type, 2019-2029
Figure 157: Oceania Precooked Corn Flour Market Attractiveness Analysis, by Applications, 2014-2029
Figure 158: Oceania Precooked Corn Flour Market Attractiveness Analysis, by Distribution Channel, 2014-2029
Figure 159: MEA Precooked Corn Flour Market Value BPS Analysis, by Country, 2014, 2019 & 2029
Figure 160: GCC Countries Precooked Corn Flour Market Value and Volume Analysis, 2014 -2029
Figure 161: South Africa Precooked Corn Flour Market Value and Volume Analysis, 2014 -2029
Figure 162: Rest of MEA Precooked Corn Flour Market Value and Volume Analysis, 2014 -2029
Figure 163: GCC Countries Precooked Corn Flour Market Incremental $ Opportunity, 2019-2029
Figure 164: South Africa Precooked Corn Flour Market Incremental $ Opportunity, 2019-2029
Figure 165: Rest of MEA Precooked Corn Flour Market Incremental $ Opportunity, 2019-2029
Figure 166: MEA Precooked Corn Flour Market Value Share (%) and BPS Analysis by Nature, 2019-2029
Figure 167: MEA Precooked Corn Flour Market Y-o-Y Growth (%) Projections by Nature, 2019-2029
Figure 168: MEA Precooked Corn Flour Market Value Share (%) and BPS Analysis by Product Type, 2019-2029
Figure 169: MEA Precooked Corn Flour Market Y-o-Y Growth (%) Projections by Product Type, 2019-2029
Figure 170: MEA Precooked Corn Flour Market Value Share (%) and BPS Analysis by Applications, 2019-2029
Figure 171: MEA Precooked Corn Flour Market Y-o-Y Growth (%) Projections by Applications, 2019-2029
Figure 172: MEA Precooked Corn Flour Market Value Share (%) and BPS Analysis by Distribution Channel, 2019-2029
Figure 173: MEA Precooked Corn Flour Market Y-o-Y Growth (%) Projections by Distribution Channel, 2019-2029
Figure 174: MEA Precooked Corn Flour Market Attractiveness Analysis, by Nature, 2014-2029
Figure 175: MEA Precooked Corn Flour Market Attractiveness Analysis, by Product Type, 2019-2029
Figure 176: MEA Precooked Corn Flour Market Attractiveness Analysis, by Applications, 2014-2029
Figure 177: MEA Precooked Corn Flour Market Attractiveness Analysis, by Distribution Channel, 2014-2029
Copyright © Transparency Market Research, Inc. All Rights reserved
Trust Online

Precooked Corn Flour Market Outlook, 2029