
Reports
Reports
High-temperature thermoplastics have emerged as a rapidly growing segment over the years, and continue to remain a 'hot' and 'in-demand' technology in a wide range of applications. Be it to enhance the lifespan of oil and gas assets, or a metal-replacement solution in the rapidly-expanding automotive industry, the applications of high-temperature thermoplastics, such as polyphthalamide, are becoming endless. With higher short- and long-term thermal stability, resistance to burning, chemical and radiation resistance, and superior mechanical properties, polyphthalamides have been garnering significant traction, due the fact that they can fulfill unique prerequisites for a wide range of applications.
Gauging the future opportunistic potential of the polyphthalamide market, Transparency Market Research (TMR), in its latest business intelligence, assesses how this high-temperature-resistant plastic is paving the way for unimagined possibilities in diverse fields. The study also turns the spotlight on riveting insights and in-depth analysis of the polyphthalamide market, which can arm stakeholders with the key facts and statistics of the industry, so as to make winning decisions.
The commercialization of polyphthalamide (PPA) resin traces back to 1991, and since then, rapid technological advancements have improved the stiffness and creep & fatigue resistance properties of polyphthalamide. The emergence of enhanced resin production technology enabled the manufacturing of a wide range of polymers, including semi-crystalline and amorphous resin. The TMR research analysis indicates an upward trajectory for the sales of polyphthalamide, with its market anticipated to be valued at ~ US$ 1.3 Bn in 2018. As per the study estimates, the sales of polyphthalamide are highly likely to grow in 2019, and beyond, with the market projected to register ~ 2x growth between 2019 and 2027. Additionally, the number of companies vying for a considerable pie of the market is anticipated to pick up pace with each passing year.
Impact of Undercurrents on the Polyphthalamide Market
Lightweight Auto Components Craze Uplifting Gains
The automotive industry is swiftly replacing metal components with plastics to lessen overall vehicle body weight. In view of the growing traction for lightweight auto components, automakers are increasingly leveraging ways to squeeze higher revenues out of this far-reaching trend. This falls in line with the aromatic nature of polyphthalamide that has been driving its employment over other polyamide products for thermal management applications. With such favorable properties, polyphthalamides are emerging as a promising substitute to metals in the powertrain, by providing a range of benefits that include feature flexibility, weight reduction, and potential for cost reduction. Automakers are increasingly employing glass fiber reinforced polyphthalamide due to its versatile properties, for manufacturing vehicle parts, motor valves, and fuel line systems, thereby creating lucrative growth opportunities for market players. Furthermore, the rising demand for SUVs and electric vehicles is fueling the traction for under-the-bonnet parts and components that are made of polyphthalamide compounds.
Electrical & Electronics - Hotbed of Applications for PPA
The superior heat resistance and low electricity modulus benefits of polyphthalamide have been pacing up its application in the electronics industry. The ability of polyphthalamides to prevent reflectors from turning yellow due to heat over a period of time continues to create a bedrock of opportunities for stakeholders in this industry. In fact, leading electronics players, such as Philips, have been using PPA in their product lines. Additionally, the flame-retardant nature of polyphthalamide is also fueling its applications in connectors for printers and memory card bases. The lucrativeness of the electronics industry will remain high for polyphthalamide manufacturers, owing to the surging demand for electronic gadgets such as mobile phones and computers.
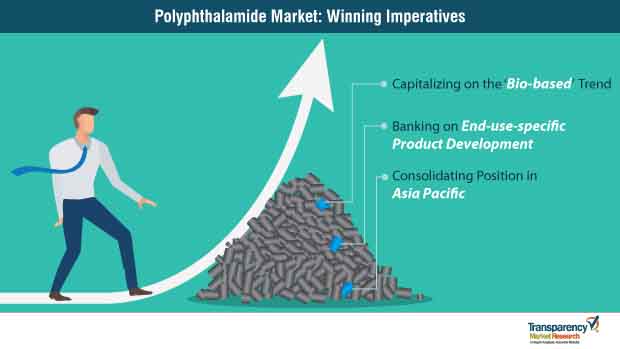
Winning Imperatives
Laser-Sharp Focus on Capitalizing the ‘Bio-based’ Trend
The rising demand for bio-based resin with eco-friendly properties and biodegradable benefits is pushing the sales of polyphthalamide. Extensive applications of bio-based polymers in extreme conditions continue to uphold market gains. For instance, Evonik-engineered polyphthalamide, VESTAMID Htplus, delivers excellent results in high temperatures above 180 degree Celsius, and is being highly utilized in air ducts in the turbochargers of several vehicles to reduce the carbon footprint in the environment.
Banking on End-Use-specific Product Development & Modification
Several companies in the polyphthalamide market are focusing on the development of end-use-specific variants to appeal to a wide pool of consumers, and drive product sales. For instance, in May 2019, BASF
Corporation expanded its portfolio by introducing new the PPA Ultramid Advanced T2000 in Guangzhou, China. This launch is extensively focused on catering to the growing demand for flame-retardant connectors in the regional electrical and electronics industry.
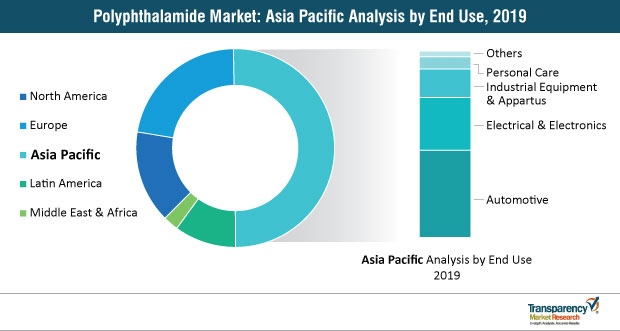
Consolidating Position in Asia Pacific
Growth opportunities remain abound for polyphthalamide manufacturers in Asia Pacific, primarily driven by the high demand for PPA composites in proliferating automotive and electronic manufacturing industries. China is anticipated to remain the most lucrative country in the polyphthalamide market through to 2027, in line with the growing use of PPA in automotive components such as fuel pipe lines, motor bobbin parts, and coolant pipes. As per TMR, the market for polyphthalamide in China is envisaged to expand at an ~ 8% CAGR during the foreseeable period. Several market players are making strategic moves to consolidate their position in different countries across Asia Pacific. For instance, in October 2018, Celanese Corporation acquired India-based Next Polymers Ltd to strengthen its market position in Asia Pacific.
Polyphthalamide Market - Competitive Analysis
The polyphthalamide market can be characterized by the presence of a large number of domestic and global manufacturers that are vying to gain a stronger position in the industry. The degree of competition is high in the market, with leading players such as BASF SE, SABIC, Arkema, Celanese Corporation, DowDuPont, Royal DSM, and Solvay, collectively accounting for ~ 44% market share. Companies such as Arkema are focused on reinforcing their market foothold by expanding their new product ranges of polyphthalamide.
Analysts’ Viewpoint
Authors of the report maintain a positive outlook of the polyphthalamide market for the forecast period. This market is projected to register an impressive CAGR of ~ 8% during the time frame of 2019-2027. Companies that are focusing on addressing the upswings in raw material costs by adopting strategic approaches are likely to gain a stronger position in the polyphthalamide market through to 2027. Extensive R&D directed towards enhancing the effectiveness of polyphthalamide as a key metal replacement polymer is highly likely to emerge as a key focus area of market players in the years to come. Market participants need to focus on the development of modified polymers for metal replacement through extensive R&D.
Higher Stiffness, Moisture Resistance, and Light Weight of Polyphthalamide to Provide New Growth Avenues
Global Polyphthalamide Market Highlights
Glass Fiber Reinforced Grade to Exhibit Rapid Growth in Polyphthalamide Market
Demand for Polyphthalamide to Increase in Consumer Electronics and Automotive End-use Industries
Asia Pacific Expected to be Highly Lucrative Region
Polyphthalamide Market - Competitive Landscape
1. Preface
1.1. Market Definition and Scope
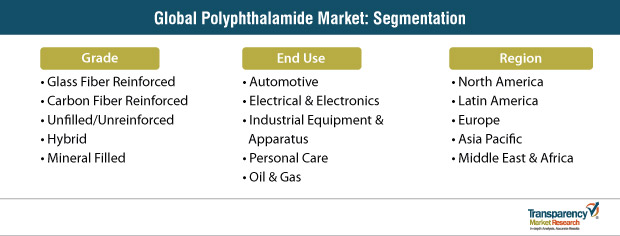
1.2. Market Segmentation
1.3. Key Research Objectives
1.4. Research Highlights
2. Assumptions and Research Methodology
3. Executive Summary: Global Polyphthalamide Market
4. Market Overview
4.1. Product Overview
4.2. Product Definition
4.3. Key Market Developments
4.4. Global Polyphthalamide Market, Analysis and Forecast
4.5. Market Indicators
4.6. Market Dynamics
4.6.1. Drivers
4.6.2. Restraints
4.6.3. Opportunities
4.7. Porters Five Forces Analysis
4.8. Value Chain Analysis
5. Global Polyphthalamide Market Analysis and Forecast, by Grade
5.1. Key Findings
5.2. Market Definitions
5.3. Global Polyphthalamide Market Volume (Tons) and Value (US$ Mn) Forecast, by Grade, 2018–2027
5.3.1. Unfilled
5.3.2. Glass Fiber Reinforced
5.3.3. Carbon Fiber Reinforced
5.3.4. Mineral-filled
5.3.5. Hybrid
5.4. Global Polyphthalamide Market Attractiveness, by Grade
6. Global Polyphthalamide Market Analysis and Forecast, by End-use
6.1. Key Findings
6.2. Market Definitions
6.3. Global Polyphthalamide Market Volume (Tons) and Value (US$ Mn) Forecast, by End-use, 2018–2027
6.3.1. Automotive
6.3.2. Electrical & Electronics
6.3.3. Industrial Equipment & Apparatus
6.3.4. Personal Care
6.3.5. Others
6.4. Global Polyphthalamide Market Attractiveness, by End-use
7. Global Polyphthalamide Market Analysis and Forecast, by Region
7.1. Global Polyphthalamide Market Volume (Tons) and Value (US$ Mn) Forecast, by Region, 2018–2027
7.1.1. North America
7.1.2. Europe
7.1.3. Asia Pacific
7.1.4. Latin America
7.1.5. Middle East & Africa
7.2. Global Polyphthalamide Market Attractiveness, by Region
8. North America Polyphthalamide Market Analysis and Forecast
8.1. Key Findings
8.2. North America Polyphthalamide Market, Overview
8.3. North America Polyphthalamide Market Volume (Tons) and Value (US$ Mn) Forecast, by Grade, 2018–2027
8.3.1. Unfilled
8.3.2. Glass Fiber Reinforced
8.3.3. Carbon Fiber Reinforced
8.3.4. Mineral-filled
8.3.5. Hybrid
8.4. North America Polyphthalamide Market Volume (Tons) and Value (US$ Mn) Forecast, by End-use, 2018–2027
8.4.1. Automotive
8.4.2. Electrical & Electronics
8.4.3. Industrial Equipment & Apparatus
8.4.4. Personal Care
8.4.5. Others
8.5. North America Polyphthalamide Market Volume (Tons) and Value (US$ Mn) Forecast, by Country, 2018–2027
8.6. U.S. Polyphthalamide Market Analysis and Forecast, by Grade
8.6.1. Unfilled
8.6.2. Glass Fiber Reinforced
8.6.3. Carbon Fiber Reinforced
8.6.4. Mineral-filled
8.6.5. Hybrid
8.7. U.S. Polyphthalamide Market Volume (Tons) and Value (US$ Mn) Forecast, by End-use
8.7.1. Automotive
8.7.2. Electrical & Electronics
8.7.3. Industrial Equipment & Apparatus
8.7.4. Personal Care
8.7.5. Others
8.8. Canada Polyphthalamide Market Analysis and Forecast, by Grade
8.8.1. Unfilled
8.8.2. Glass Fiber Reinforced
8.8.3. Carbon Fiber Reinforced
8.8.4. Mineral-filled
8.8.5. Hybrid
8.9. Canada Polyphthalamide Market Volume (Tons) and Value (US$ Mn) Forecast, by End-use
8.9.1. Automotive
8.9.2. Electrical & Electronics
8.9.3. Industrial Equipment & Apparatus
8.9.4. Personal Care
8.9.5. Others
8.10. North America Polyphthalamide Market Attractiveness Analysis
9. Europe Polyphthalamide Market Analysis and Forecast
9.1. Key Findings
9.2. Europe Polyphthalamide Market, Overview
9.3. Europe Polyphthalamide Market Volume (Tons) and Value (US$ Mn) Forecast, by Grade, 2018–2027
9.3.1. Unfilled
9.3.2. Glass Fiber Reinforced
9.3.3. Carbon Fiber Reinforced
9.3.4. Mineral-filled
9.3.5. Hybrid
9.4. Europe Polyphthalamide Market Volume (Tons) and Value (US$ Mn) Forecast, by End-use, 2018–2027
9.4.1. Automotive
9.4.2. Electrical & Electronics
9.4.3. Industrial Equipment & Apparatus
9.4.4. Personal Care
9.4.5. Others
9.5. Europe Polyphthalamide Market Volume (Tons) and Value (US$ Mn) Forecast, by Country and Sub-region, 2018–2027
9.6. Germany Polyphthalamide Market Analysis and Forecast, by Grade
9.6.1. Unfilled
9.6.2. Glass Fiber Reinforced
9.6.3. Carbon Fiber Reinforced
9.6.4. Mineral-filled
9.6.5. Hybrid
9.7. Germany Polyphthalamide Market Volume (Tons) and Value (US$ Mn) Forecast, by End-use
9.7.1. Automotive
9.7.2. Electrical & Electronics
9.7.3. Industrial Equipment & Apparatus
9.7.4. Personal Care
9.7.5. Others
9.8. U.K. Polyphthalamide Market Analysis and Forecast, by Grade
9.8.1. Unfilled
9.8.2. Glass Fiber Reinforced
9.8.3. Carbon Fiber Reinforced
9.8.4. Mineral-filled
9.8.5. Hybrid
9.9. U.K. Polyphthalamide Market Volume (Tons) and Value (US$ Mn) Forecast, by End-use
9.9.1. Automotive
9.9.2. Electrical & Electronics
9.9.3. Industrial Equipment & Apparatus
9.9.4. Personal Care
9.9.5. Others
9.10. France Polyphthalamide Market Analysis and Forecast, by Grade
9.10.1. Unfilled
9.10.2. Glass Fiber Reinforced
9.10.3. Carbon Fiber Reinforced
9.10.4. Mineral-filled
9.10.5. Hybrid
9.11. France Polyphthalamide Market Volume (Tons) and Value (US$ Mn) Forecast, by End-use
9.11.1. Automotive
9.11.2. Electrical & Electronics
9.11.3. Industrial Equipment & Apparatus
9.11.4. Personal Care
9.11.5. Others
9.12. Italy Polyphthalamide Market Analysis and Forecast, by Grade
9.12.1. Unfilled
9.12.2. Glass Fiber Reinforced
9.12.3. Carbon Fiber Reinforced
9.12.4. Mineral-filled
9.12.5. Hybrid
9.13. Italy Polyphthalamide Market Volume (Tons) and Value (US$ Mn) Forecast, by End-use
9.13.1. Automotive
9.13.2. Electrical & Electronics
9.13.3. Industrial Equipment & Apparatus
9.13.4. Personal Care
9.13.5. Others
9.14. Spain Polyphthalamide Market Analysis and Forecast, by Grade
9.14.1. Unfilled
9.14.2. Glass Fiber Reinforced
9.14.3. Carbon Fiber Reinforced
9.14.4. Mineral-filled
9.14.5. Hybrid
9.15. Spain Polyphthalamide Market Volume (Tons) and Value (US$ Mn) Forecast, by End-use
9.15.1. Automotive
9.15.2. Electrical & Electronics
9.15.3. Industrial Equipment & Apparatus
9.15.4. Personal Care
9.15.5. Others
9.16. Russia & CIS Polyphthalamide Market Analysis and Forecast, by Grade
9.16.1. Unfilled
9.16.2. Glass Fiber Reinforced
9.16.3. Carbon Fiber Reinforced
9.16.4. Mineral-filled
9.16.5. Hybrid
9.17. Russia & CIS Polyphthalamide Market Volume (Tons) and Value (US$ Mn) Forecast, by End-use
9.17.1. Automotive
9.17.2. Electrical & Electronics
9.17.3. Industrial Equipment & Apparatus
9.17.4. Personal Care
9.17.5. Others
9.18. Rest of Europe Polyphthalamide Market Analysis and Forecast, by Grade
9.18.1. Unfilled
9.18.2. Glass Fiber Reinforced
9.18.3. Carbon Fiber Reinforced
9.18.4. Mineral-filled
9.18.5. Hybrid
9.19. Rest of Europe Polyphthalamide Market Volume (Tons) and Value (US$ Mn) Forecast, by End-use
9.19.1. Automotive
9.19.2. Electrical & Electronics
9.19.3. Industrial Equipment & Apparatus
9.19.4. Personal Care
9.19.5. Others
9.20. Europe Polyphthalamide Market Attractiveness Analysis
10. Asia Pacific Polyphthalamide Market Analysis and Forecast
10.1. Key Findings
10.2. Asia Pacific Polyphthalamide Market, Overview
10.3. Asia Pacific Polyphthalamide Market Volume (Tons) and Value (US$ Mn) Forecast, by Grade, 2018–2027
10.3.1. Unfilled
10.3.2. Glass Fiber Reinforced
10.3.3. Carbon Fiber Reinforced
10.3.4. Mineral-filled
10.3.5. Hybrid
10.4. Asia Pacific Polyphthalamide Market Volume (Tons) and Value (US$ Mn) Forecast, by End-use, 2018–2027
10.4.1. Automotive
10.4.2. Electrical & Electronics
10.4.3. Industrial Equipment & Apparatus
10.4.4. Personal Care
10.4.5. Others
10.5. Asia Pacific Polyphthalamide Market Volume (Tons) and Value (US$ Mn) Forecast, by Country and Sub-region, 2018–2027
10.6. China Polyphthalamide Market Analysis and Forecast, by Grade
10.6.1. Unfilled
10.6.2. Glass Fiber Reinforced
10.6.3. Carbon Fiber Reinforced
10.6.4. Mineral-filled
10.6.5. Hybrid
10.7. China Polyphthalamide Market Volume (Tons) and Value (US$ Mn) Forecast, by End-use
10.7.1. Automotive
10.7.2. Electrical & Electronics
10.7.3. Industrial Equipment & Apparatus
10.7.4. Personal Care
10.7.5. Others
10.8. India Polyphthalamide Market Analysis and Forecast, by Grade
10.8.1. Unfilled
10.8.2. Glass Fiber Reinforced
10.8.3. Carbon Fiber Reinforced
10.8.4. Mineral-filled
10.8.5. Hybrid
10.9. India Polyphthalamide Market Volume (Tons) and Value (US$ Mn) Forecast, by End-use
10.9.1. Automotive
10.9.2. Electrical & Electronics
10.9.3. Industrial Equipment & Apparatus
10.9.4. Personal Care
10.9.5. Others
10.10. Japan Polyphthalamide Market Analysis and Forecast, by Grade
10.10.1. Unfilled
10.10.2. Glass Fiber Reinforced
10.10.3. Carbon Fiber Reinforced
10.10.4. Mineral-filled
10.10.5. Hybrid
10.11. Japan Polyphthalamide Market Volume (Tons) and Value (US$ Mn) Forecast, by End-use
10.11.1. Automotive
10.11.2. Electrical & Electronics
10.11.3. Industrial Equipment & Apparatus
10.11.4. Personal Care
10.11.5. Others
10.12. ASEAN Polyphthalamide Market Analysis and Forecast, by Grade
10.12.1. Unfilled
10.12.2. Glass Fiber Reinforced
10.12.3. Carbon Fiber Reinforced
10.12.4. Mineral-filled
10.12.5. Hybrid
10.13. ASEAN Polyphthalamide Market Volume (Tons) and Value (US$ Mn) Forecast, by End-use
10.13.1. Automotive
10.13.2. Electrical & Electronics
10.13.3. Industrial Equipment & Apparatus
10.13.4. Personal Care
10.13.5. Others
10.14. Rest of Asia Pacific Polyphthalamide Market Analysis and Forecast, by Grade
10.14.1. Unfilled
10.14.2. Glass Fiber Reinforced
10.14.3. Carbon Fiber Reinforced
10.14.4. Mineral-filled
10.14.5. Hybrid
10.15. Rest of Asia Pacific Polyphthalamide Market Volume (Tons) and Value (US$ Mn) Forecast, by End-use
10.15.1. Automotive
10.15.2. Electrical & Electronics
10.15.3. Industrial Equipment & Apparatus
10.15.4. Personal Care
10.15.5. Others
10.16. Asia Pacific Polyphthalamide Market Attractiveness Analysis
11. Latin America Polyphthalamide Market Analysis and Forecast
11.1. Key Findings
11.2. Latin America Polyphthalamide Market, Overview
11.3. Latin America Polyphthalamide Market Volume (Tons) and Value (US$ Mn) Forecast, by Grade, 2018–2027
11.3.1. Unfilled
11.3.2. Glass Fiber Reinforced
11.3.3. Carbon Fiber Reinforced
11.3.4. Mineral-filled
11.3.5. Hybrid
11.4. Latin America Polyphthalamide Market Volume (Tons) and Value (US$ Mn) Forecast, by End-use, 2018–2027
11.5. Latin America Polyphthalamide Market Volume (Tons) and Value (US$ Mn) Forecast, by End-use, 2018–2027
11.5.1. Automotive
11.5.2. Electrical & Electronics
11.5.3. Industrial Equipment & Apparatus
11.5.4. Personal Care
11.5.5. Others
11.6. Latin America Polyphthalamide Market Volume (Tons) and Value (US$ Mn) Forecast, by Country and Sub-region, 2018–2027
11.7. Brazil Polyphthalamide Market Analysis and Forecast, by Grade
11.7.1. Unfilled
11.7.2. Glass Fiber Reinforced
11.7.3. Carbon Fiber Reinforced
11.7.4. Mineral-filled
11.7.5. Hybrid
11.8. Brazil Polyphthalamide Market Volume (Tons) and Value (US$ Mn) Forecast, by End-use
11.8.1. Automotive
11.8.2. Electrical & Electronics
11.8.3. Industrial Equipment & Apparatus
11.8.4. Personal Care
11.8.5. Others
11.9. Mexico Polyphthalamide Market Analysis and Forecast, by Grade
11.9.1. Unfilled
11.9.2. Glass Fiber Reinforced
11.9.3. Carbon Fiber Reinforced
11.9.4. Mineral-filled
11.9.5. Hybrid
11.10. Mexico Polyphthalamide Market Volume (Tons) and Value (US$ Mn) Forecast, by End-use
11.10.1. Automotive
11.10.2. Electrical & Electronics
11.10.3. Industrial Equipment & Apparatus
11.10.4. Personal Care
11.10.5. Others
11.11. Rest of Latin America Polyphthalamide Market Analysis and Forecast, by Grade
11.11.1. Unfilled
11.11.2. Glass Fiber Reinforced
11.11.3. Carbon Fiber Reinforced
11.11.4. Mineral-filled
11.11.5. Hybrid
11.12. Rest of Latin America Polyphthalamide Market Volume (Tons) and Value (US$ Mn) Forecast, by End-use
11.12.1. Automotive
11.12.2. Electrical & Electronics
11.12.3. Industrial Equipment & Apparatus
11.12.4. Personal Care
11.12.5. Others
11.13. Latin America Polyphthalamide Market Attractiveness Analysis
12. Middle East & Africa Polyphthalamide Market Analysis and Forecast
12.1. Key Findings
12.2. Middle East & Africa Polyphthalamide Market, Overview
12.3. Middle East & Africa Polyphthalamide Market Volume (Tons) and Value (US$ Mn) Forecast, by Grade, 2018–2027
12.3.1. Unfilled
12.3.2. Glass Fiber Reinforced
12.3.3. Carbon Fiber Reinforced
12.3.4. Mineral-filled
12.3.5. Hybrid
12.4. Middle East & Africa Polyphthalamide Market Volume (Tons) and Value (US$ Mn) Forecast, by End-use, 2018–2027
12.4.1. Automotive
12.4.2. Electrical & Electronics
12.4.3. Industrial Equipment & Apparatus
12.4.4. Personal Care
12.4.5. Others
12.5. Middle East & Africa Polyphthalamide Market Volume (Tons) and Value (US$ Mn) Forecast, by Country and Sub-region, 2018–2027
12.6. GCC Polyphthalamide Market Analysis and Forecast, by Grade
12.6.1. Unfilled
12.6.2. Glass Fiber Reinforced
12.6.3. Carbon Fiber Reinforced
12.6.4. Mineral-filled
12.6.5. Hybrid
12.7. GCC Polyphthalamide Market Volume (Tons) and Value (US$ Mn) Forecast, by End-use
12.7.1. Automotive
12.7.2. Electrical & Electronics
12.7.3. Industrial Equipment & Apparatus
12.7.4. Personal Care
12.7.5. Others
12.8. South Africa Polyphthalamide Market Analysis and Forecast, by Grade
12.8.1. Unfilled
12.8.2. Glass Fiber Reinforced
12.8.3. Carbon Fiber Reinforced
12.8.4. Mineral-filled
12.8.5. Hybrid
12.9. South Africa Polyphthalamide Market Volume (Tons) and Value (US$ Mn) Forecast, by End-use
12.9.1. Automotive
12.9.2. Electrical & Electronics
12.9.3. Industrial Equipment & Apparatus
12.9.4. Personal Care
12.9.5. Others
12.10. Rest of Middle East & Africa Polyphthalamide Market Analysis and Forecast, by Grade
12.10.1. Unfilled
12.10.2. Glass Fiber Reinforced
12.10.3. Carbon Fiber Reinforced
12.10.4. Mineral-filled
12.10.5. Hybrid
12.11. Rest of Middle East & Africa Polyphthalamide Market Volume (Tons) and Value (US$ Mn) Forecast, by End-use
12.11.1. Automotive
12.11.2. Electrical & Electronics
12.11.3. Industrial Equipment & Apparatus
12.11.4. Personal Care
12.11.5. Others
12.12. Middle East & Africa Polyphthalamide Market Attractiveness Analysis
13. Competition Landscape
13.1. Polyphthalamide Market, Market Share Analysis, by Company (2018)
13.2. Competition Matrix, by Key Players
13.3. Competition Benchmarking
13.4. Product Mapping
13.5. Company Profiles
13.5.1. BASF SE
13.5.1.1. Headquarters, Year of Establishment, Key Management, Revenue, Employee Strength
13.5.1.2. Company Overview
13.5.1.3. Business Segments
13.5.1.4. Applications
13.5.1.5. Product Segments
13.5.1.6. Revenue (US$ Mn) and Y-o-Y Growth (%), 2014–2018
13.5.1.7. Breakdown of Net Sales, by Business Segment, 2018
13.5.1.8. Strategic Overview
13.5.2. DowDuPont Inc.
13.5.2.1. Headquarters, Year of Establishment, Key Management, Revenue, Employee Strength
13.5.2.2. Company Overview
13.5.2.3. Business Segments
13.5.2.4. Applications
13.5.2.5. Product Segments
13.5.2.6. Revenue (US$ Mn) and Y-o-Y Growth (%), 2014–2017
13.5.2.7. Strategic Overview
13.5.3. Royal DSM
13.5.3.1. Headquarters, Year of Establishment, Key Management, Revenue, Employee Strength
13.5.3.2. Company Overview
13.5.3.3. Business Segments
13.5.3.4. Applications
13.5.3.5. Product Segments
13.5.3.6. Breakdown of Net Sales, by Business Segment, 2018
13.5.3.7. Revenue (US$ Bn) and Y-o-Y Growth (%), 2014–2018
13.5.3.8. Strategic Overview
13.5.4. Arkema
13.5.4.1. Headquarters, Year of Establishment, Key Management, Revenue, Employee Strength
13.5.4.2. Company Overview
13.5.4.3. Business Segments
13.5.4.4. Applications
13.5.4.5. Product Segments
13.5.4.6. Revenue (US$ Bn) and Y-o-Y Growth (%), 2013–2018
13.5.4.7. Breakdown of Revenue, by Business Segment, 2018
13.5.4.8. Breakdown of Sales, by Region, 2018
13.5.4.9. Strategic Overview
13.5.5. Celanese Corporation
13.5.5.1. Headquarters, Year of Establishment, Key Management, Revenue, Employee Strength
13.5.5.2. Company Overview
13.5.5.3. Business Segments
13.5.5.4. Applications
13.5.5.5. Product Segments
13.5.5.6. Revenue (US$ Bn), and Y-o-Y Growth (%), 2014–2017
13.5.5.7. Breakdown of Revenue, by Region, 2017
13.5.5.8. Strategic Overview
13.5.6. EMS-GRIVORY
13.5.6.1. Headquarters, Year of Establishment, Key Management, Revenue, Employee Strength
13.5.6.2. Company Overview
13.5.6.3. Business Segments
13.5.6.4. Applications
13.5.6.5. Product Segments
13.5.6.6. Strategic Overview
13.5.7. Evonik Industries AG.
13.5.7.1. Headquarters, Year of Establishment, Key Management, Revenue, Employee Strength
13.5.7.2. Company Overview
13.5.7.3. Business Segments
13.5.7.4. Applications
13.5.7.5. Product Segments
13.5.7.6. Breakdown of Net Sales, by Business Segment, 2018
13.5.7.7. Breakdown of Net Sales, by Region, 2018
13.5.7.8. Revenue (US$ Bn) and Y-o-Y Growth (%), 2014–2018
13.5.8. Solvay S.A.
13.5.8.1. Headquarters, Year of Establishment, Key Management, Revenue, Employee Strength
13.5.8.2. Company Overview
13.5.8.3. Business Segments
13.5.8.4. Applications
13.5.8.5. Product Segments
13.5.8.6. Breakdown of Net Sales, by Geography, 2018
13.5.8.7. Breakdown of Net Sales, by Business Segment, 2018
13.5.8.8. Revenue (US$ Bn) and Y-o-Y Growth (%), 2014–2018
13.5.9. RTP Company
13.5.9.1. Headquarters, Year of Establishment, Key Management, Revenue, Employee Strength
13.5.9.2. Company Overview
13.5.9.3. Business Segments
13.5.9.4. Applications
13.5.9.5. Product Segments
13.5.9.6. Polyphthalamide Brands
13.5.10. Saudi Basic Industries Corporation
13.5.10.1. Headquarters, Year of Establishment, Key Management, Revenue, Employee Strength
13.5.10.2. Company Overview
13.5.10.3. Business Segments
13.5.10.4. Applications
13.5.10.5. Product Segments
13.5.10.6. Revenue (US$ Bn) and Y-o-Y Growth (%), 2015–2018
13.5.10.7. Strategic Overview
14. Primary Research: Key Insights
List of Tables
Table 01: Global Polyphthalamide Market Volume (Tons) Forecast, by Grade, 2018–2027
Table 02: Global Polyphthalamide Market Volume (Tons) and Value (US$ Mn) Forecast, by Grade, 2018–2027
Table 03: Global Polyphthalamide Market Volume (Tons) Forecast, by End-use, 2018–2027
Table 04: Global Polyphthalamide Market Volume (Tons) Forecast, by End-use, 2018–2027
Table 05: Global Polyphthalamide Market Volume (Tons) and Value (US$ Mn) Forecast, by End-use, 2018–2027
Table 06: Global Polyphthalamide Market Volume (Tons) Forecast, by Region, 2018–2027
Table 07: Global Polyphthalamide Market Volume (Tons) and Value (US$ Mn) Forecast, by Region, 2018–2027
Table 08: North America Polyphthalamide Market Volume (Tons) Forecast, by Grade, 2018–2027
Table 09: North America Polyphthalamide Market Volume (Tons) and Value (US$ Mn) Forecast, by Grade, 2018–2027
Table 10: North America Polyphthalamide Market Volume (Tons) Forecast, by End-use, 2018–2027
Table 11: North America Polyphthalamide Market Volume (Tons) and Value (US$ Mn) Forecast, by End-use, 2018–2027
Table 12: North America Polyphthalamide Market Volume (Tons) Forecast, by Country, 2018–2027
Table 13: North America Polyphthalamide Market Value (US$ Mn) Forecast, by Country, 2018–2027
Table 14: U.S. Polyphthalamide Market Volume (Tons) Forecast, by Grade, 2018–2027
Table 15: U.S. Polyphthalamide Market Volume (Tons) and Value (US$ Mn) Forecast, by Grade, 2018–2027
Table 16: U.S. Polyphthalamide Market Volume (Tons) Forecast, by End-use, 2018–2027
Table 17: U.S. Polyphthalamide Market Volume (Tons) and Value (US$ Mn) Forecast, by End-use, 2018–2027
Table 18: Canada Polyphthalamide Market Volume (Tons) Forecast, by Grade, 2018–2027
Table 19: Canada Polyphthalamide Market Volume (Tons) and Value (US$ Mn) Forecast, by Grade, 2018–2027
Table 20: Canada Polyphthalamide Market Volume (Tons) Forecast, by End-use, 2018–2027
Table 21: Canada Polyphthalamide Market Volume (Tons) and Value (US$ Mn) Forecast, by End-use, 2018–2027
Table 22: Europe Polyphthalamide Market Volume (Tons) Forecast, by Grade, 2018–2027
Table 23: Europe Polyphthalamide Market Volume (Tons) and Value (US$ Mn) Forecast, by Grade, 2018–2027
Table 24: Europe Polyphthalamide Market Volume (Tons) Forecast, by End-use, 2018–2027
Table 25: Europe Polyphthalamide Market Volume (Tons) and Value (US$ Mn) Forecast, by End-use, 2018–2027
Table 26: Europe Polyphthalamide Market Volume (Tons) Forecast, by Country and Sub-region, 2018–2027
Table 27: Europe Polyphthalamide Market Volume (Tons) and Value (US$ Mn) Forecast, by Country and Sub-region, 2018–2027
Table 28: Germany Polyphthalamide Market Volume (Tons) Forecast, by Grade, 2018–2027
Table 29: Germany Polyphthalamide Market Volume (Tons) and Value (US$ Mn) Forecast, by Grade, 2018–2027
Table 30: Germany Polyphthalamide Market Volume (Tons) Forecast, by End-use, 2018–2027
Table 31: Germany Polyphthalamide Market Volume (Tons) and Value (US$ Mn) Forecast, by End-use, 2018–2027
Table 32: France Polyphthalamide Market Volume (Tons) Forecast, by Grade, 2018–2027
Table 33: France Polyphthalamide Market Volume (Tons) and Value (US$ Mn) Forecast, by Grade, 2018–2027
Table 34: France Polyphthalamide Market Volume (Tons) Forecast, by End-use, 2018–2027
Table 35: France Polyphthalamide Market Volume (Tons) and Value (US$ Mn) Forecast, by End-use, 2018–2027
Table 36: U.K. Polyphthalamide Market Volume (Tons) Forecast, by Grade, 2018–2027
Table 37: U.K. Polyphthalamide Market Volume (Tons) and Value (US$ Mn) Forecast, by Grade, 2018–2027
Table 38: U.K. Polyphthalamide Market Volume (Tons) Forecast, by End-use, 2018–2027
Table 39: U.K. Polyphthalamide Market Volume (Tons) and Value (US$ Mn) Forecast, by End-use, 2018–2027
Table 40: Italy Polyphthalamide Market Volume (Tons) Forecast, by Grade, 2018–2027
Table 41: Italy Polyphthalamide Market Volume (Tons) and Value (US$ Mn) Forecast, by Grade, 2018–2027
Table 42: Italy Polyphthalamide Market Volume (Tons) Forecast, by End-use, 2018–2027
Table 43: Italy Polyphthalamide Market Volume (Tons) and Value (US$ Mn) Forecast, by End-use, 2018–2027
Table 44: Spain Polyphthalamide Market Volume (Tons) Forecast, by Grade, 2018–2027
Table 45: Spain Polyphthalamide Market Volume (Tons) and Value (US$ Mn) Forecast, by Grade, 2018–2027
Table 46: Spain Polyphthalamide Market Volume (Tons) Forecast, by End-use, 2018–2027
Table 47: Spain Polyphthalamide Market Volume (Tons) and Value (US$ Mn) Forecast, by End-use, 2018–2027
Table 48: Russia & CIS Polyphthalamide Market Volume (Tons) Forecast, by Grade, 2018–2027
Table 49: Russia & CIS Polyphthalamide Market Volume (Tons) and Value (US$ Mn) Forecast, by Grade, 2018–2027
Table 50: Russia & CIS Polyphthalamide Market Volume (Tons) Forecast, by End-use, 2018–2027
Table 51: Russia & CIS Polyphthalamide Market Volume (Tons) and Value (US$ Mn) Forecast, by End-use, 2018–2027
Table 52: Rest of Europe Polyphthalamide Market Volume (Tons) Forecast, by Grade, 2018–2027
Table 53: Rest of Europe Polyphthalamide Market Volume (Tons) and Value (US$ Mn) Forecast, by Grade, 2018–2027
Table 54: Rest of Europe Polyphthalamide Market Volume (Tons) Forecast, by End-use, 2018–2027
Table 55: Rest of Europe Polyphthalamide Market Volume (Tons) and Value (US$ Mn) Forecast, by End-use, 2018–2027
Table 56: Asia Pacific Polyphthalamide Market Volume (Tons) Forecast, by Grade, 2018–2027
Table 57: Asia Pacific Polyphthalamide Market Volume (Tons) and Value (US$ Mn) Forecast, by Grade, 2018–2027
Table 58: Asia Pacific Polyphthalamide Market Volume (Tons) Forecast, by End-use, 2018–2027
Table 59: Asia Pacific Polyphthalamide Market Volume (Tons) and Value (US$ Mn) Forecast, by End-use, 2018–2027
Table 60: Asia Pacific Polyphthalamide Market Volume (Tons) Forecast, by Country and Sub-region, 2018–2027
Table 61: Asia Pacific Polyphthalamide Market Volume (Tons) and Value (US$ Mn) Forecast, by Country and Sub-region, 2018–2027
Table 62: China Polyphthalamide Market Volume (Tons) Forecast, by Grade, 2018–2027
Table 63: China Polyphthalamide Market Volume (Tons) and Value (US$ Mn) Forecast, by Grade, 2018–2027
Table 64: China Polyphthalamide Market Volume (Tons) Forecast, by End-use, 2018–2027
Table 65: China Polyphthalamide Market Volume (Tons) and Value (US$ Mn) Forecast, by End-use, 2018–2027
Table 66: India Polyphthalamide Market Volume (Tons) Forecast, by Grade, 2018–2027
Table 67: India Polyphthalamide Market Volume (Tons) and Value (US$ Mn) Forecast, by Grade, 2018–2027
Table 68: India Polyphthalamide Market Volume (Tons) Forecast, by End-use, 2018–2027
Table 69: India Polyphthalamide Market Volume (Tons) and Value (US$ Mn) Forecast, by End-use, 2018–2027
Table 70: Japan Polyphthalamide Market Volume (Tons) Forecast, by Grade, 2018–2027
Table 71: Japan Polyphthalamide Market Volume (Tons) and Value (US$ Mn) Forecast, by Grade, 2018–2027
Table 72: Japan Polyphthalamide Market Volume (Tons) Forecast, by End-use, 2018–2027
Table 73: Japan Polyphthalamide Market Volume (Tons) and Value (US$ Mn) Forecast, by End-use, 2018–2027
Table 74: ASEAN Polyphthalamide Market Volume (Tons) Forecast, by Grade, 2018–2027
Table 75: ASEAN Polyphthalamide Market Volume (Tons) and Value (US$ Mn) Forecast, by Grade, 2018–2027
Table 76: ASEAN Polyphthalamide Market Volume (Tons) Forecast, by End-use, 2018–2027
Table 77: ASEAN Polyphthalamide Market Volume (Tons) and Value (US$ Mn) Forecast, by End-use, 2018–2027
Table 78: Rest of Asia Pacific Polyphthalamide Market Volume (Tons) Forecast, by Grade, 2018–2027
Table 79: Rest of Asia Pacific Polyphthalamide Market Volume (Tons) and Value (US$ Mn) Forecast, by Grade, 2018–2027
Table 80: Rest of Asia Pacific Polyphthalamide Market Volume (Tons) Forecast, by End-use, 2018–2027
Table 81: Rest of Asia Pacific Polyphthalamide Market Volume (Tons) and Value (US$ Mn) Forecast, by End-use, 2018–2027
Table 82: Latin America Polyphthalamide Market Volume (Tons) Forecast, by Grade, 2018–2027
Table 83: Latin America Polyphthalamide Market Value (US$ Mn) Forecast, by Grade, 2018–2027
Table 84: Latin America Polyphthalamide Market Volume (Tons) Forecast, by End-use, 2018–2027
Table 85: Latin America Polyphthalamide Market Value (US$ Mn) Forecast, by End-use, 2018–2027
Table 86: Latin America Polyphthalamide Market Volume (Tons) Forecast, by Country and Sub-region, 2018–2027
Table 87: Latin America Polyphthalamide Market Value (US$ Mn) Forecast, by Country and Sub-region, 2018–2027
Table 88: Brazil Polyphthalamide Market Volume (Tons) Forecast, by Grade, 2018–2027
Table 89: Brazil Polyphthalamide Market Value (US$ Mn) Forecast, by Grade, 2018–2027
Table 90: Brazil Polyphthalamide Market Volume (Tons) Forecast, by End-use, 2018–2027
Table 91: Brazil Polyphthalamide Market Value (US$ Mn) Forecast, by End-use, 2018–2027
Table 92: Mexico Polyphthalamide Market Volume (Tons) Forecast, by Grade, 2018–2027
Table 93: Mexico Polyphthalamide Market Value (US$ Mn) Forecast, by Grade, 2018–2027
Table 94: Mexico Polyphthalamide Market Volume (Tons) Forecast, by End-use, 2018–2027
Table 95: Mexico Polyphthalamide Market Value (US$ Mn) Forecast, by End-use, 2018–2027
Table 96: Rest of Latin America Polyphthalamide Market Volume (Tons) Forecast, by Grade, 2018–2027
Table 97: Rest of Latin America Polyphthalamide Market Value (US$ Mn) Forecast, by Grade, 2018–2027
Table 98: Rest of Latin America Polyphthalamide Market Volume (Tons) Forecast, by End-use, 2018–2027
Table 99: Rest of Latin America Polyphthalamide Market Value (US$ Mn) Forecast, by End-use, 2018–2027
Table 100: Middle East & Africa Polyphthalamide Market Volume (Tons) Forecast, by Grade, 2018–2027
Table 101: Middle East & Africa Polyphthalamide Market Volume (Tons) and Value (US$ Mn) Forecast, by Grade, 2018–2027
Table 102: Middle East & Africa Polyphthalamide Market Volume (Tons) Forecast, by End-use, 2018–2027
Table 103: Middle East & Africa Polyphthalamide Market Volume (Tons) and Value (US$ Mn) Forecast, by End-use, 2018–2027
Table 104: Middle East & Africa Polyphthalamide Market Volume (Tons) Forecast, by Country and Sub-region, 2018–2027
Table 105: Middle East & Africa Polyphthalamide Market Volume (Tons) and Value (US$ Mn) Forecast, by Country and Sub-region, 2018–2027
Table 106: GCC Polyphthalamide Market Volume (Tons) Forecast, by Grade, 2018–2027
Table 107: GCC Polyphthalamide Market Volume (Tons) and Value (US$ Mn) Forecast, by Grade, 2018–2027
Table 108: GCC Polyphthalamide Market Volume (Tons) Forecast, by End-use, 2018–2027
Table 109: GCC Polyphthalamide Market Volume (Tons) and Value (US$ Mn) Forecast, by End-use, 2018–2027
Table 110: South Africa Polyphthalamide Market Volume (Tons) Forecast, by Grade, 2018–2027
Table 111: South Africa Polyphthalamide Market Volume (Tons) and Value (US$ Mn) Forecast, by Grade, 2018–2027
Table 112: South Africa Polyphthalamide Market Volume (Tons) Forecast, by End-use, 2018–2027
Table 113: South Africa Polyphthalamide Market Volume (Tons) and Value (US$ Mn) Forecast, by End-use, 2018–2027
Table 114: Rest of Middle East & Africa Polyphthalamide Market Volume (Tons) Forecast, by Grade, 2018–2027
Table 115: Rest of Middle East & Africa Polyphthalamide Market Volume (Tons) and Value (US$ Mn) Forecast, by Grade, 2018–2027
Table 116: Rest of Middle East & Africa Polyphthalamide Market Volume (Tons) Forecast, by End-use, 2018–2027
Table 117: Rest of Middle East & Africa Polyphthalamide Market Volume (Tons) and Value (US$ Mn) Forecast, by End-use, 2018–2027
List of Figures
Figure 01: Global Production of Bio-based Polymer, by Region, 2018
Figure 02: Global Bio-based Polymer End-use, 2018
Figure 03: Global Polyphthalamide Market Value Share Analysis, by Grade, 2018 and 2027
Figure 04: Global Polyphthalamide Market Attractiveness Analysis, by Grade
Figure 05: Global Polyphthalamide Market Value Share Analysis, by End-use, 2018 and 2027
Figure 06: Global Polyphthalamide Market Attractiveness Analysis, by End-use
Figure 07: Global Polyphthalamide Market Value Share Analysis, by Region, 2018 and 2027
Figure 08: Global Polyphthalamide Market Attractiveness Analysis, by Region
Figure 09: North America Polyphthalamide Market Volume (Kilo Ton) and Value (US$ Mn)) Forecast, 2018–2027
Figure 10: North America Polyphthalamide Market Attractiveness Analysis, by Country
Figure 11: North America Polyphthalamide Market Value Share Analysis, by Grade, 2018 and 2027
Figure 12: North America Polyphthalamide Market Value Share Analysis, by End-use, 2018 and 2027
Figure 13: North America Polyphthalamide Market Value Share Analysis, by Country, 2018 and 2027
Figure 14: North America Polyphthalamide Market Attractiveness Analysis, by Grade
Figure 15: North America Polyphthalamide Market Attractiveness Analysis, by End-use
Figure 16: Europe Polyphthalamide Market Value (US$ Mn) and Volume (Tons) Forecast, 2018–2027
Figure 17: Europe Polyphthalamide Market Attractiveness Analysis, by Country and Sub-region
Figure 18: Europe Polyphthalamide Market Value Share Analysis, by Grade, 2018 and 2027
Figure 19: Europe Polyphthalamide Market Value Share Analysis, by End-use 2018 and 2027
Figure 20: Europe Polyphthalamide Market Value Share Analysis, by Country and Sub-region, 2018 and 2027
Figure 21: Europe Polyphthalamide Market Attractiveness Analysis, by Grade
Figure 22: Europe Polyphthalamide Market Attractiveness Analysis, by End-use
Figure 23: Asia Pacific Polyphthalamide Market Value (US$ Mn) and Volume (Tons) Forecast, 2018–2027
Figure 24: Asia Pacific Polyphthalamide Market Attractiveness Analysis, by Country and Sub-region
Figure 25: Asia Pacific Polyphthalamide Market Value Share Analysis, by Grade, 2018 and 2027
Figure 26: Asia Pacific Polyphthalamide Market Value Share Analysis, by End-use, 2018 and 2027
Figure 27: Asia Pacific Polyphthalamide Market Value Share Analysis, by Country and Sub-region, 2018 and 2027
Figure 28: Asia Pacific Polyphthalamide Market Attractiveness Analysis, by Grade
Figure 29: Asia Pacific Polyphthalamide Market Attractiveness Analysis, by End-use
Figure 30: Latin America Polyphthalamide Market Volume (Tons) and Value (US$ Mn) Forecast, 2018–2027
Figure 31: Latin America Polyphthalamide Market Attractiveness Analysis, by Country and Sub-region
Figure 32: Latin America Polyphthalamide Market Value Share Analysis, by Grade, 2018 and 2027
Figure 33: Latin America Polyphthalamide Market Value Share Analysis, by End-use, 2018 and 2027
Figure 34: Latin America Polyphthalamide Market Value Share Analysis, by Country and Sub-region, 2018 and 2027
Figure 35: Latin America Polyphthalamide Market Attractiveness Analysis, by Grade
Figure 36: Latin America Asia Pacific Polyphthalamide Market Attractiveness Analysis, by End-use
Figure 37: Middle East & Africa Polyphthalamide Market Volume (Tons) and Value (US$ Mn) and Forecast, 2018–2027
Figure 38: Middle East & Africa Polyphthalamide Market Attractiveness Analysis, by Country and Sub-region
Figure 39: Middle East & Africa Polyphthalamide Market Value Share Analysis, by Grade, 2018 and 2027
Figure 40: Middle East & Africa Polyphthalamide Market Value Share Analysis, by End-use, 2018 and 2027
Figure 41: Middle East & Africa Polyphthalamide Market Value Share Analysis, by Country and Sub-region, 2018 and 2027
Figure 42: Middle East & Africa Polyphthalamide Market Attractiveness Analysis, by Grade
Figure 43: Middle East & Africa Polyphthalamide Market Attractiveness Analysis, by End-use
Copyright © Transparency Market Research, Inc. All Rights reserved
Trust Online

Polyphthalamide Market Insights, 2027