
Reports
Reports
Polyamide 6 is mainly a semi-crystalline polyamide which occur naturally in the form of silk and wool. It is also commonly known as Nylon-6. Polyamide 6 can be artificially synthesized through polymerization of caprolacta. This polyamide is highly adopted in various industries due to its excellent mechanical properties such as durability, strength, and elasticity. Polyamide 6 also poses higher temperature resistance property, which makes them to become a preferred material in various high-temperature applications. Such factors are driving the global polyamide 6 market. Apart from this, polyamide 6 is widely adopted in automotive, textile, packaging, coatings, and electronics industry, owing to their outstanding electrical resistance, toughness, and good insulation properties. Such rapid consumption rate of polyamide 6 in various industrial verticals is also fueling growth in the global polyamide 6 market.
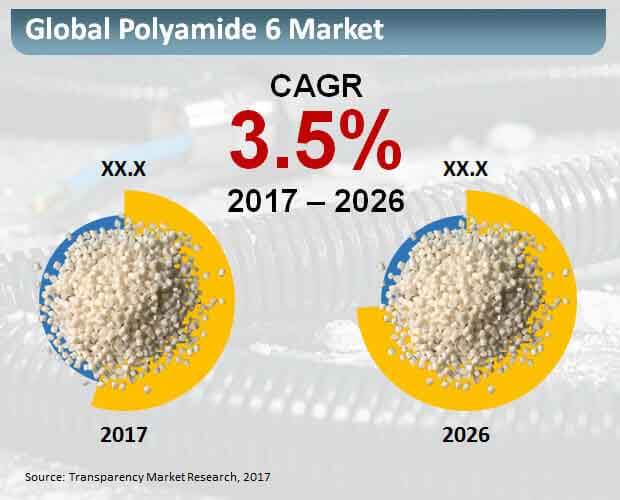
According to experts, the global polyamide 6 market is anticipated to record the sales over 7,690 metric tons by the end of 2026. The growth is prophesized to occur at a promising CAGR of 3.5% during the forecast period from 2017 to 2026. Polyamide 6 is replacing the metal parts in automobiles and also highly used in manufacturing various sportswear. The market is mainly segmented on the basis of application, product type, and commercial grade.
Textile Filament Witness Highest Sales in Polyamide 6 Market
From the perspective of product type, the global polyamide 6 market is segmented into polyamide 6 engineering resin, high ten yarn, BCF and staple, and textile filament. Among these segments, textile filament is expected to showcase fantastic expansion in the next few years, especially during the mentioned period – 2017 to 2026. Moreover, above 4,300 metric tons of textile filament made of polyamide 6 is expected to be sold across the globe by the end of 2017. This is because of booming textile industry globally. However, apart from textile filament, polyamide 6 engineering resin is the next segment to witness largest sale due to their high performance properties.
In terms of application, the global polyamide 6 market is divided into following segments – automotive, films and coatings, appliances, electrical and electronics, consumer goods, wires and cables, industrial machinery, and others. Among these applications, the automotive segment is expected to witness highest proliferation due to the rapid adoption of polyamide 6 in various automotive applications. From the perspective of commercial grade, the global polyamide 6 market is segmented into injection molding grade, fiber grade, and extrusion grade. Among these grades, fiber grade segment remains predominant in the market. Extrusion grade polyamide 6 is expected to become the next dominating segment during the forecast period.
APEJ Showcases Largest Share in Polyamide 6 Market
Geographically, the global polyamide 6 market is bifurcated into APEJ and Europe. Among these, APEJ is expected to lead the global polyamide 6 market with the highest CAGR of 3.7%. This is because the region has seen rapid establishment of manufacturers along with growing demand for high-temperature resistant engineering plastics and lightweight plastics. In Europe, rising electrical & electronics industry and automotive industry is driving demand for polyamide 6 market.
Some of the prominent players operating in the global polyamide 6 market are DSM Engineering Plastics, Honeywell International, Grupa Azoty, Nycoa, and Evonik Industries AG.
High Demand for Use across Several End-use Industries to Boost Polyamide 6 Market
The global polyamide-6 market is expected to expand due to rising demand from the automotive, electronics, coating industries, and increased initiatives from the government. Polyamide-6 also comes with higher temperature resistance, making it a preferred material for a variety of high-temperature uses. In addition to that, the increasing use of polyamide-6 and bio-based polyamide in newer industrial verticals is likely to provide new growth opportunities for the growth of the global polyamide-6 market in the projected timeframe.
As a result, the demand for the aforementioned application sectors is anticipated to boost the global polyamide-6 market in the near future. PA6's various niche uses, such as its use in musical and healthcare instruments, are projected to boost demand for the material in the years to come.
Beneficial Properties of the Product is likely to Spell Growth of the Market
Polyamide -6 is a semi-crystalline polyamide that is referred to as Nylon-6 (PA6). In certain cases, caprolacta polymerization results in polyamide-6. The power, durability, and elasticity it offers are greatly regarded in industries. Thanks to its ability to withstand high pressure, temperature, and a range of chemicals, it is a highly esteemed material. The physical and chemical attributes of polyamide-6 make it suitable for a wide array of uses, thereby driving development of the global polyamide-6 market in the years to come. Of all Polyamides groups, Polyamide-6 accounts for a large chunk of global production in terms of volume.
Irrespective of these facts, polyamide-6 (PA6) is considered as one of the preferred materials due to its chemical and physical characteristics. Certain characteristics such as reaction with strong acids and bases and high shrinkage in moulded parts can limit the use of PA6. Over specification, such as in the automotive industry for safety reasons, is likely lead to the utilization of various alternative products like reinforced polypropylene. This could limit the development of PA6. PA6's use could be hampered by its lack of flame retardance and significant flammable dripping, which are likely to impede growth of the global polyamide-6 market in the near future.
1. Global Economic Outlook
2. Global Polyamide 6 Market - Executive Summary
3. Global Polyamide 6 Market Overview
3.1. Introduction
3.1.1. Global Polyamide 6 Market Taxonomy
3.1.2. Global Polyamide 6 Market Definition
3.2. Global Polyamide 6 Market Size ( Metric Tonnes) and Forecast, 2012-2026
3.2.1. Global Polyamide 6 Market Y-o-Y Growth
3.3. Global Polyamide 6 Market Dynamics
3.4. Supply Chain
3.5. Cost Structure
3.6. Pricing Analysis
3.7. Raw Material Sourcing Strategy and Analysis
3.8. Supplier List
3.9. Key Participants Market Presence (Intensity Map) By Region
4. Global Polyamide 6 Market Analysis and Forecast 2012-2026
4.1. Global Polyamide 6 Market Size and Forecast By End Use, 2012-2026
4.1.1. Polyamide 6 Engineering Resin Market Size and Forecast, 2012-2026
4.1.1.1. Revenue Comparison, By Region
4.1.1.2. Market Share Comparison, By Region
4.1.1.3. Y-o-Y growth Comparison, By Region
4.1.2. BCF & Staple Market Size and Forecast, 2012-2026
4.1.2.1. Revenue Comparison, By Region
4.1.2.2. Market Share Comparison, By Region
4.1.2.3. Y-o-Y growth Comparison, By Region
4.1.3. High Ten Yarn Market Size and Forecast, 2012-2026
4.1.3.1. Revenue Comparison, By Region
4.1.3.2. Market Share Comparison, By Region
4.1.3.3. Y-o-Y growth Comparison, By Region
4.1.4. Textile Filament Market Size and Forecast, 2012-2026
4.1.4.1. Revenue Comparison, By Region
4.1.4.2. Market Share Comparison, By Region
4.1.4.3. Y-o-Y growth Comparison, By Region
4.2. Global Polyamide 6 Market Size and Forecast By Commercial Grades, 2012-2026
4.2.1. Fiber Grade Market Size and Forecast, 2012-2026
4.2.1.1. Revenue Comparison, By Region
4.2.1.2. Market Share Comparison, By Region
4.2.1.3. Y-o-Y growth Comparison, By Region
4.2.2. Injection Molding Grade Market Size and Forecast, 2012-2026
4.2.2.1. Revenue Comparison, By Region
4.2.2.2. Market Share Comparison, By Region
4.2.2.3. Y-o-Y growth Comparison, By Region
4.2.3. Extrusion Grade Market Size and Forecast, 2012-2026
4.2.3.1. Revenue Comparison, By Region
4.2.3.2. Market Share Comparison, By Region
4.2.3.3. Y-o-Y growth Comparison, By Region
4.3. Global Polyamide 6 Market Size and Forecast By Application, 2012-2026
4.3.1. Automotive Market Size and Forecast, 2012-2026
4.3.1.1. Revenue Comparison, By Region
4.3.1.2. Market Share Comparison, By Region
4.3.1.3. Y-o-Y growth Comparison, By Region
4.3.2. Electrical & Electronics Market Size and Forecast, 2012-2026
4.3.2.1. Revenue Comparison, By Region
4.3.2.2. Market Share Comparison, By Region
4.3.2.3. Y-o-Y growth Comparison, By Region
4.3.3. Appliances Market Size and Forecast, 2012-2026
4.3.3.1. Revenue Comparison, By Region
4.3.3.2. Market Share Comparison, By Region
4.3.3.3. Y-o-Y growth Comparison, By Region
4.3.4. Films & Coatings Market Size and Forecast, 2012-2026
4.3.4.1. Revenue Comparison, By Region
4.3.4.2. Market Share Comparison, By Region
4.3.4.3. Y-o-Y growth Comparison, By Region
4.3.5. Wires & Cables Market Size and Forecast, 2012-2026
4.3.5.1. Revenue Comparison, By Region
4.3.5.2. Market Share Comparison, By Region
4.3.5.3. Y-o-Y growth Comparison, By Region
4.3.6. Consumer Goods Market Size and Forecast, 2012-2026
4.3.6.1. Revenue Comparison, By Region
4.3.6.2. Market Share Comparison, By Region
4.3.6.3. Y-o-Y growth Comparison, By Region
4.3.7. Industrial Machinery Market Size and Forecast, 2012-2026
4.3.7.1. Revenue Comparison, By Region
4.3.7.2. Market Share Comparison, By Region
4.3.7.3. Y-o-Y growth Comparison, By Region
4.3.8. Others (packaging, construction, etc..) Market Size and Forecast, 2012-2026
4.3.8.1. Revenue Comparison, By Region
4.3.8.2. Market Share Comparison, By Region
4.3.8.3. Y-o-Y growth Comparison, By Region
5. North America Polyamide 6 Market Size and Forecast, 2012-2026
5.1. North America Outlook
5.2. North America Chemical Industry Outlook
5.3. North America Polyamide 6 Market Outlook
5.4. Revenue Comparison, By Country
5.4.1. US Market Size and Forecast ( Metric Tonnes), 2012-2026
5.4.2. Canada Market Size and Forecast ( Metric Tonnes), 2012-2026
5.5. Revenue Comparison, By End Use
5.6. Revenue Comparison, By Commercial Grades
5.7. Revenue Comparison, By Application
6. Latin America Polyamide 6 Market Size and Forecast, 2012-2026
6.1. Latin America Outlook
6.2. Latin America Chemical Industry Outlook
6.3. Latin America Polyamide 6 Market Outlook
6.4. Revenue Comparison, By Country
6.4.1. Brazil Market Size and Forecast ( Metric Tonnes), 2012-2026
6.4.2. Mexico Market Size and Forecast ( Metric Tonnes), 2012-2026
6.4.3. Rest of Latin America Market Size and Forecast ( Metric Tonnes), 2012-2026
6.5. Revenue Comparison, By End Use
6.6. Revenue Comparison, By Commercial Grades
6.7. Revenue Comparison, By Application
7. Europe Polyamide 6 Market Size and Forecast, 2012-2026
7.1. Europe Outlook
7.2. Europe Chemical Industry Outlook
7.3. Europe Polyamide 6 Market Outlook
7.4. Revenue Comparison, By Country
7.4.1. Germany Market Size and Forecast ( Metric Tonnes), 2012-2026
7.4.2. France Market Size and Forecast ( Metric Tonnes), 2012-2026
7.4.3. U.K. Market Size and Forecast ( Metric Tonnes), 2012-2026
7.4.4. Spain Market Size and Forecast ( Metric Tonnes), 2012-2026
7.4.5. Russia Market Size and Forecast ( Metric Tonnes), 2012-2026
7.4.6. Rest of Europe Market Size and Forecast ( Metric Tonnes), 2012-2026
7.5. Revenue Comparison, By End Use
7.6. Revenue Comparison, By Commercial Grades
7.7. Revenue Comparison, By Application
8. Japan Polyamide 6 Market Size and Forecast, 2012-2026
8.1. Japan Outlook
8.2. Japan Chemical Industry Outlook
8.3. Japan Polyamide 6 Market Outlook
8.4. Revenue Comparison, By Country
8.4.1. Japan Market Size and Forecast ( Metric Tonnes), 2012-2026
8.5. Revenue Comparison, By End Use
8.6. Revenue Comparison, By Commercial Grades
8.7. Revenue Comparison, By Application
9. APEJ Polyamide 6 Market Size and Forecast, 2012-2026
9.1. APEJ Outlook
9.2. APEJ Chemical Industry Outlook
9.3. APEJ Polyamide 6 Market Outlook
9.4. Revenue Comparison, By Country
9.4.1. China Market Size and Forecast ( Metric Tonnes), 2012-2026
9.4.2. ASEAN Market Size and Forecast ( Metric Tonnes), 2012-2026
9.4.3. India Market Size and Forecast ( Metric Tonnes), 2012-2026
9.4.4. Korea Market Size and Forecast ( Metric Tonnes), 2012-2026
9.4.5. Australia & New Zealand Market Size and Forecast ( Metric Tonnes), 2012-2026
9.4.6. Rest of APEJ Market Size and Forecast ( Metric Tonnes), 2012-2026
9.5. Revenue Comparison, By End Use
9.6. Revenue Comparison, By Commercial Grades
9.7. Revenue Comparison, By Application
10. MEA Polyamide 6 Market Size and Forecast, 2012-2026
10.1. MEA Outlook
10.2. MEA Chemical Industry Outlook
10.3. MEA Polyamide 6 Market Outlook
10.4. Revenue Comparison, By Country
10.4.1. GCC Countries Market Size and Forecast ( Metric Tonnes), 2012-2026
10.4.2. Turkey Market Size and Forecast ( Metric Tonnes), 2012-2026
10.4.3. South Africa Market Size and Forecast ( Metric Tonnes), 2012-2026
10.4.4. Rest of MEA Market Size and Forecast ( Metric Tonnes), 2012-2026
10.5. Revenue Comparison, By End Use
10.6. Revenue Comparison, By Commercial Grades
10.7. Revenue Comparison, By Application
11. Global Polyamide 6 Market Company Share, Competition Landscape and Company Profiles
11.1. Company Share Analysis
11.2. Competition Landscape
11.3. Company Profiles
11.3.1. BASF SE
11.3.2. AdvanSix Inc.
11.3.3. A. Schulman, Inc
11.3.4. Koninklijke DSM N.V
11.3.5. Ube Industries, Ltd
11.3.6. Arkema S.A
11.3.7. Lanxess AG
11.3.8. Polymeric Resources Corporation
11.3.9. Nylon Corporations of America
11.3.10. EMS-CHEMIE HOLDING AG
12. Research Methodology
13. Secondary and Primary Sources
14. Assumptions and Acronyms
15. Disclaimer
List of Tables
TABLE 1 Global Polyamide 6 Market Volume ( Metric Tonnes), 2012-2017
TABLE 2 Global Polyamide 6 Market Volume ( Metric Tonnes), 2018-2026
TABLE 3 Global Polyamide 6 Market Volume ( Metric Tonnes) and Y-o-Y, 2017-2026
TABLE 4 Global Polyamide 6 Engineering Resin Segment Volume ( Metric Tonnes), By Region 2012-2017
TABLE 5 Global Polyamide 6 Engineering Resin Segment Volume ( Metric Tonnes), By Region 2018-2026
TABLE 6 Global Polyamide 6 Engineering Resin Segment Market Share, By Region 2012-2017
TABLE 7 Global Polyamide 6 Engineering Resin Segment Market Share, By Region 2018-2026
TABLE 8 Global Polyamide 6 Engineering Resin Segment Y-o-Y, By Region 2017-2026
TABLE 9 Global BCF & Staple Segment Volume ( Metric Tonnes), By Region 2012-2017
TABLE 10 Global BCF & Staple Segment Volume ( Metric Tonnes), By Region 2018-2026
TABLE 11 Global BCF & Staple Segment Market Share, By Region 2012-2017
TABLE 12 Global BCF & Staple Segment Market Share, By Region 2018-2026
TABLE 13 Global BCF & Staple Segment Y-o-Y, By Region 2017-2026
TABLE 14 Global High Ten Yarn Segment Volume ( Metric Tonnes), By Region 2012-2017
TABLE 15 Global High Ten Yarn Segment Volume ( Metric Tonnes), By Region 2018-2026
TABLE 16 Global High Ten Yarn Segment Market Share, By Region 2012-2017
TABLE 17 Global High Ten Yarn Segment Market Share, By Region 2018-2026
TABLE 18 Global High Ten Yarn Segment Y-o-Y, By Region 2017-2026
TABLE 19 Global Textile Filament Segment Volume ( Metric Tonnes), By Region 2012-2017
TABLE 20 Global Textile Filament Segment Volume ( Metric Tonnes), By Region 2018-2026
TABLE 21 Global Textile Filament Segment Market Share, By Region 2012-2017
TABLE 22 Global Textile Filament Segment Market Share, By Region 2018-2026
TABLE 23 Global Textile Filament Segment Y-o-Y, By Region 2017-2026
TABLE 24 Global Fiber Grade Segment Volume ( Metric Tonnes), By Region 2012-2017
TABLE 25 Global Fiber Grade Segment Volume ( Metric Tonnes), By Region 2018-2026
TABLE 26 Global Fiber Grade Segment Market Share, By Region 2012-2017
TABLE 27 Global Fiber Grade Segment Market Share, By Region 2018-2026
TABLE 28 Global Fiber Grade Segment Y-o-Y, By Region 2017-2026
TABLE 29 Global Injection Molding Grade Segment Volume ( Metric Tonnes), By Region 2012-2017
TABLE 30 Global Injection Molding Grade Segment Volume ( Metric Tonnes), By Region 2018-2026
TABLE 31 Global Injection Molding Grade Segment Market Share, By Region 2012-2017
TABLE 32 Global Injection Molding Grade Segment Market Share, By Region 2018-2026
TABLE 33 Global Injection Molding Grade Segment Y-o-Y, By Region 2017-2026
TABLE 34 Global Extrusion Grade Segment Volume ( Metric Tonnes), By Region 2012-2017
TABLE 35 Global Extrusion Grade Segment Volume ( Metric Tonnes), By Region 2018-2026
TABLE 36 Global Extrusion Grade Segment Market Share, By Region 2012-2017
TABLE 37 Global Extrusion Grade Segment Market Share, By Region 2018-2026
TABLE 38 Global Extrusion Grade Segment Y-o-Y, By Region 2017-2026
TABLE 39 Global Automotive Segment Volume ( Metric Tonnes), By Region 2012-2017
TABLE 40 Global Automotive Segment Volume ( Metric Tonnes), By Region 2018-2026
TABLE 41 Global Automotive Segment Market Share, By Region 2012-2017
TABLE 42 Global Automotive Segment Market Share, By Region 2018-2026
TABLE 43 Global Automotive Segment Y-o-Y, By Region 2017-2026
TABLE 44 Global Electrical & Electronics Segment Volume ( Metric Tonnes), By Region 2012-2017
TABLE 45 Global Electrical & Electronics Segment Volume ( Metric Tonnes), By Region 2018-2026
TABLE 46 Global Electrical & Electronics Segment Market Share, By Region 2012-2017
TABLE 47 Global Electrical & Electronics Segment Market Share, By Region 2018-2026
TABLE 48 Global Electrical & Electronics Segment Y-o-Y, By Region 2017-2026
TABLE 49 Global Appliances Segment Volume ( Metric Tonnes), By Region 2012-2017
TABLE 50 Global Appliances Segment Volume ( Metric Tonnes), By Region 2018-2026
TABLE 51 Global Appliances Segment Market Share, By Region 2012-2017
TABLE 52 Global Appliances Segment Market Share, By Region 2018-2026
TABLE 53 Global Appliances Segment Y-o-Y, By Region 2017-2026
TABLE 54 Global Films & Coatings Segment Volume ( Metric Tonnes), By Region 2012-2017
TABLE 55 Global Films & Coatings Segment Volume ( Metric Tonnes), By Region 2018-2026
TABLE 56 Global Films & Coatings Segment Market Share, By Region 2012-2017
TABLE 57 Global Films & Coatings Segment Market Share, By Region 2018-2026
TABLE 58 Global Films & Coatings Segment Y-o-Y, By Region 2017-2026
TABLE 59 Global Wires & Cables Segment Volume ( Metric Tonnes), By Region 2012-2017
TABLE 60 Global Wires & Cables Segment Volume ( Metric Tonnes), By Region 2018-2026
TABLE 61 Global Wires & Cables Segment Market Share, By Region 2012-2017
TABLE 62 Global Wires & Cables Segment Market Share, By Region 2018-2026
TABLE 63 Global Wires & Cables Segment Y-o-Y, By Region 2017-2026
TABLE 64 Global Consumer Goods Segment Volume ( Metric Tonnes), By Region 2012-2017
TABLE 65 Global Consumer Goods Segment Volume ( Metric Tonnes), By Region 2018-2026
TABLE 66 Global Consumer Goods Segment Market Share, By Region 2012-2017
TABLE 67 Global Consumer Goods Segment Market Share, By Region 2018-2026
TABLE 68 Global Consumer Goods Segment Y-o-Y, By Region 2017-2026
TABLE 69 Global Industrial Machinery Segment Volume ( Metric Tonnes), By Region 2012-2017
TABLE 70 Global Industrial Machinery Segment Volume ( Metric Tonnes), By Region 2018-2026
TABLE 71 Global Industrial Machinery Segment Market Share, By Region 2012-2017
TABLE 72 Global Industrial Machinery Segment Market Share, By Region 2018-2026
TABLE 73 Global Industrial Machinery Segment Y-o-Y, By Region 2017-2026
TABLE 74 Global Others (packaging, construction, etc..) Segment Volume ( Metric Tonnes), By Region 2012-2017
TABLE 75 Global Others (packaging, construction, etc..) Segment Volume ( Metric Tonnes), By Region 2018-2026
TABLE 76 Global Others (packaging, construction, etc..) Segment Market Share, By Region 2012-2017
TABLE 77 Global Others (packaging, construction, etc..) Segment Market Share, By Region 2018-2026
TABLE 78 Global Others (packaging, construction, etc..) Segment Y-o-Y, By Region 2017-2026
TABLE 79 North America Polyamide 6 Market Volume ( Metric Tonnes), By Country 2012-2017
TABLE 80 North America Polyamide 6 Market Volume ( Metric Tonnes), By Country 2018-2026
TABLE 81 North America Polyamide 6 Market Volume ( Metric Tonnes), By End Use 2012-2017
TABLE 82 North America Polyamide 6 Market Volume ( Metric Tonnes), By End Use 2018-2026
TABLE 83 North America Polyamide 6 Market Volume ( Metric Tonnes), By Commercial Grades 2012-2017
TABLE 84 North America Polyamide 6 Market Volume ( Metric Tonnes), By Commercial Grades 2018-2026
TABLE 85 North America Polyamide 6 Market Volume ( Metric Tonnes), By Application 2012-2017
TABLE 86 North America Polyamide 6 Market Volume ( Metric Tonnes), By Application 2018-2026
TABLE 87 Latin America Polyamide 6 Market Volume ( Metric Tonnes), By Country 2012-2017
TABLE 88 Latin America Polyamide 6 Market Volume ( Metric Tonnes), By Country 2018-2026
TABLE 89 Latin America Polyamide 6 Market Volume ( Metric Tonnes), By End Use 2012-2017
TABLE 90 Latin America Polyamide 6 Market Volume ( Metric Tonnes), By End Use 2018-2026
TABLE 91 Latin America Polyamide 6 Market Volume ( Metric Tonnes), By Commercial Grades 2012-2017
TABLE 92 Latin America Polyamide 6 Market Volume ( Metric Tonnes), By Commercial Grades 2018-2026
TABLE 93 Latin America Polyamide 6 Market Volume ( Metric Tonnes), By Application 2012-2017
TABLE 94 Latin America Polyamide 6 Market Volume ( Metric Tonnes), By Application 2018-2026
TABLE 95 Europe Polyamide 6 Market Volume ( Metric Tonnes), By Country 2012-2017
TABLE 96 Europe Polyamide 6 Market Volume ( Metric Tonnes), By Country 2018-2026
TABLE 97 Europe Polyamide 6 Market Volume ( Metric Tonnes), By End Use 2012-2017
TABLE 98 Europe Polyamide 6 Market Volume ( Metric Tonnes), By End Use 2018-2026
TABLE 99 Europe Polyamide 6 Market Volume ( Metric Tonnes), By Commercial Grades 2012-2017
TABLE 100 Europe Polyamide 6 Market Volume ( Metric Tonnes), By Commercial Grades 2018-2026
TABLE 101 Europe Polyamide 6 Market Volume ( Metric Tonnes), By Application 2012-2017
TABLE 102 Europe Polyamide 6 Market Volume ( Metric Tonnes), By Application 2018-2026
TABLE 103 Japan Polyamide 6 Market Volume ( Metric Tonnes), By Country 2012-2017
TABLE 104 Japan Polyamide 6 Market Volume ( Metric Tonnes), By Country 2018-2026
TABLE 105 Japan Polyamide 6 Market Volume ( Metric Tonnes), By End Use 2012-2017
TABLE 106 Japan Polyamide 6 Market Volume ( Metric Tonnes), By End Use 2018-2026
TABLE 107 Japan Polyamide 6 Market Volume ( Metric Tonnes), By Commercial Grades 2012-2017
TABLE 108 Japan Polyamide 6 Market Volume ( Metric Tonnes), By Commercial Grades 2018-2026
TABLE 109 Japan Polyamide 6 Market Volume ( Metric Tonnes), By Application 2012-2017
TABLE 110 Japan Polyamide 6 Market Volume ( Metric Tonnes), By Application 2018-2026
TABLE 111 APEJ Polyamide 6 Market Volume ( Metric Tonnes), By Country 2012-2017
TABLE 112 APEJ Polyamide 6 Market Volume ( Metric Tonnes), By Country 2018-2026
TABLE 113 APEJ Polyamide 6 Market Volume ( Metric Tonnes), By End Use 2012-2017
TABLE 114 APEJ Polyamide 6 Market Volume ( Metric Tonnes), By End Use 2018-2026
TABLE 115 APEJ Polyamide 6 Market Volume ( Metric Tonnes), By Commercial Grades 2012-2017
TABLE 116 APEJ Polyamide 6 Market Volume ( Metric Tonnes), By Commercial Grades 2018-2026
TABLE 117 APEJ Polyamide 6 Market Volume ( Metric Tonnes), By Application 2012-2017
TABLE 118 APEJ Polyamide 6 Market Volume ( Metric Tonnes), By Application 2018-2026
TABLE 119 MEA Polyamide 6 Market Volume ( Metric Tonnes), By Country 2012-2017
TABLE 120 MEA Polyamide 6 Market Volume ( Metric Tonnes), By Country 2018-2026
TABLE 121 MEA Polyamide 6 Market Volume ( Metric Tonnes), By End Use 2012-2017
TABLE 122 MEA Polyamide 6 Market Volume ( Metric Tonnes), By End Use 2018-2026
TABLE 123 MEA Polyamide 6 Market Volume ( Metric Tonnes), By Commercial Grades 2012-2017
TABLE 124 MEA Polyamide 6 Market Volume ( Metric Tonnes), By Commercial Grades 2018-2026
TABLE 125 MEA Polyamide 6 Market Volume ( Metric Tonnes), By Application 2012-2017
TABLE 126 MEA Polyamide 6 Market Volume ( Metric Tonnes), By Application 2018-2026
List of Figures
FIG. 1 Global Polyamide 6 Market Volume ( Metric Tonnes), 2012-2017
FIG. 2 Global Polyamide 6 Market Volume ( Metric Tonnes) Forecast, 2018-2026
FIG. 3 Global Polyamide 6 Market Volume ( Metric Tonnes) and Y-o-Y, 2017-2026
FIG. 4 Global Polyamide 6 Engineering Resin Segment Market Volume ( Metric Tonnes) By Region, 2012-2017
FIG. 5 Global Polyamide 6 Engineering Resin Segment Market Volume ( Metric Tonnes) By Region, 2018-2026
FIG. 6 Global Polyamide 6 Engineering Resin Segment Y-o-Y Growth Rate, By Region, 2017-2026
FIG. 7 Global BCF & Staple Segment Market Volume ( Metric Tonnes) By Region, 2012-2017
FIG. 8 Global BCF & Staple Segment Market Volume ( Metric Tonnes) By Region, 2018-2026
FIG. 9 Global BCF & Staple Segment Y-o-Y Growth Rate, By Region, 2017-2026
FIG. 10 Global High Ten Yarn Segment Market Volume ( Metric Tonnes) By Region, 2012-2017
FIG. 11 Global High Ten Yarn Segment Market Volume ( Metric Tonnes) By Region, 2018-2026
FIG. 12 Global High Ten Yarn Segment Y-o-Y Growth Rate, By Region, 2017-2026
FIG. 13 Global Textile Filament Segment Market Volume ( Metric Tonnes) By Region, 2012-2017
FIG. 14 Global Textile Filament Segment Market Volume ( Metric Tonnes) By Region, 2018-2026
FIG. 15 Global Textile Filament Segment Y-o-Y Growth Rate, By Region, 2017-2026
FIG. 16 Global Fiber Grade Segment Market Volume ( Metric Tonnes) By Region, 2012-2017
FIG. 17 Global Fiber Grade Segment Market Volume ( Metric Tonnes) By Region, 2018-2026
FIG. 18 Global Fiber Grade Segment Y-o-Y Growth Rate, By Region, 2017-2026
FIG. 19 Global Injection Molding Grade Segment Market Volume ( Metric Tonnes) By Region, 2012-2017
FIG. 20 Global Injection Molding Grade Segment Market Volume ( Metric Tonnes) By Region, 2018-2026
FIG. 21 Global Injection Molding Grade Segment Y-o-Y Growth Rate, By Region, 2017-2026
FIG. 22 Global Extrusion Grade Segment Market Volume ( Metric Tonnes) By Region, 2012-2017
FIG. 23 Global Extrusion Grade Segment Market Volume ( Metric Tonnes) By Region, 2018-2026
FIG. 24 Global Extrusion Grade Segment Y-o-Y Growth Rate, By Region, 2017-2026
FIG. 25 Global Automotive Segment Market Volume ( Metric Tonnes) By Region, 2012-2017
FIG. 26 Global Automotive Segment Market Volume ( Metric Tonnes) By Region, 2018-2026
FIG. 27 Global Automotive Segment Y-o-Y Growth Rate, By Region, 2017-2026
FIG. 28 Global Electrical & Electronics Segment Market Volume ( Metric Tonnes) By Region, 2012-2017
FIG. 29 Global Electrical & Electronics Segment Market Volume ( Metric Tonnes) By Region, 2018-2026
FIG. 30 Global Electrical & Electronics Segment Y-o-Y Growth Rate, By Region, 2017-2026
FIG. 31 Global Appliances Segment Market Volume ( Metric Tonnes) By Region, 2012-2017
FIG. 32 Global Appliances Segment Market Volume ( Metric Tonnes) By Region, 2018-2026
FIG. 33 Global Appliances Segment Y-o-Y Growth Rate, By Region, 2017-2026
FIG. 34 Global Films & Coatings Segment Market Volume ( Metric Tonnes) By Region, 2012-2017
FIG. 35 Global Films & Coatings Segment Market Volume ( Metric Tonnes) By Region, 2018-2026
FIG. 36 Global Films & Coatings Segment Y-o-Y Growth Rate, By Region, 2017-2026
FIG. 37 Global Wires & Cables Segment Market Volume ( Metric Tonnes) By Region, 2012-2017
FIG. 38 Global Wires & Cables Segment Market Volume ( Metric Tonnes) By Region, 2018-2026
FIG. 39 Global Wires & Cables Segment Y-o-Y Growth Rate, By Region, 2017-2026
FIG. 40 Global Consumer Goods Segment Market Volume ( Metric Tonnes) By Region, 2012-2017
FIG. 41 Global Consumer Goods Segment Market Volume ( Metric Tonnes) By Region, 2018-2026
FIG. 42 Global Consumer Goods Segment Y-o-Y Growth Rate, By Region, 2017-2026
FIG. 43 Global Industrial Machinery Segment Market Volume ( Metric Tonnes) By Region, 2012-2017
FIG. 44 Global Industrial Machinery Segment Market Volume ( Metric Tonnes) By Region, 2018-2026
FIG. 45 Global Industrial Machinery Segment Y-o-Y Growth Rate, By Region, 2017-2026
FIG. 46 Global Others (packaging, construction, etc..) Segment Market Volume ( Metric Tonnes) By Region, 2012-2017
FIG. 47 Global Others (packaging, construction, etc..) Segment Market Volume ( Metric Tonnes) By Region, 2018-2026
FIG. 48 Global Others (packaging, construction, etc..) Segment Y-o-Y Growth Rate, By Region, 2017-2026
FIG. 49 North America Polyamide 6 Market Volume ( Metric Tonnes), By Country 2012-2017
FIG. 50 North America Polyamide 6 Market Volume ( Metric Tonnes), By Country 2018-2026
FIG. 51 North America Polyamide 6 Market Volume ( Metric Tonnes), By End Use 2012-2017
FIG. 52 North America Polyamide 6 Market Volume ( Metric Tonnes), By End Use 2018-2026
FIG. 53 North America Polyamide 6 Market Volume ( Metric Tonnes), By Commercial Grades 2012-2017
FIG. 54 North America Polyamide 6 Market Volume ( Metric Tonnes), By Commercial Grades 2018-2026
FIG. 55 North America Polyamide 6 Market Volume ( Metric Tonnes), By Application 2012-2017
FIG. 56 North America Polyamide 6 Market Volume ( Metric Tonnes), By Application 2018-2026
FIG. 57 Latin America Polyamide 6 Market Volume ( Metric Tonnes), By Country 2012-2017
FIG. 58 Latin America Polyamide 6 Market Volume ( Metric Tonnes), By Country 2018-2026
FIG. 59 Latin America Polyamide 6 Market Volume ( Metric Tonnes), By End Use 2012-2017
FIG. 60 Latin America Polyamide 6 Market Volume ( Metric Tonnes), By End Use 2018-2026
FIG. 61 Latin America Polyamide 6 Market Volume ( Metric Tonnes), By Commercial Grades 2012-2017
FIG. 62 Latin America Polyamide 6 Market Volume ( Metric Tonnes), By Commercial Grades 2018-2026
FIG. 63 Latin America Polyamide 6 Market Volume ( Metric Tonnes), By Application 2012-2017
FIG. 64 Latin America Polyamide 6 Market Volume ( Metric Tonnes), By Application 2018-2026
FIG. 65 Europe Polyamide 6 Market Volume ( Metric Tonnes), By Country 2012-2017
FIG. 66 Europe Polyamide 6 Market Volume ( Metric Tonnes), By Country 2018-2026
FIG. 67 Europe Polyamide 6 Market Volume ( Metric Tonnes), By End Use 2012-2017
FIG. 68 Europe Polyamide 6 Market Volume ( Metric Tonnes), By End Use 2018-2026
FIG. 69 Europe Polyamide 6 Market Volume ( Metric Tonnes), By Commercial Grades 2012-2017
FIG. 70 Europe Polyamide 6 Market Volume ( Metric Tonnes), By Commercial Grades 2018-2026
FIG. 71 Europe Polyamide 6 Market Volume ( Metric Tonnes), By Application 2012-2017
FIG. 72 Europe Polyamide 6 Market Volume ( Metric Tonnes), By Application 2018-2026
FIG. 73 Japan Polyamide 6 Market Volume ( Metric Tonnes), By Country 2012-2017
FIG. 74 Japan Polyamide 6 Market Volume ( Metric Tonnes), By Country 2018-2026
FIG. 75 Japan Polyamide 6 Market Volume ( Metric Tonnes), By End Use 2012-2017
FIG. 76 Japan Polyamide 6 Market Volume ( Metric Tonnes), By End Use 2018-2026
FIG. 77 Japan Polyamide 6 Market Volume ( Metric Tonnes), By Application 2012-2017
FIG. 78 Japan Polyamide 6 Market Volume ( Metric Tonnes), By Commercial Grades 2018-2026
FIG. 79 Japan Polyamide 6 Market Volume ( Metric Tonnes), By Application 2012-2017
FIG. 80 Japan Polyamide 6 Market Volume ( Metric Tonnes), By Application 2018-2026
FIG. 81 APEJ Polyamide 6 Market Volume ( Metric Tonnes), By Country 2012-2017
FIG. 82 APEJ Polyamide 6 Market Volume ( Metric Tonnes), By Country 2018-2026
FIG. 83 APEJ Polyamide 6 Market Volume ( Metric Tonnes), By End Use 2012-2017
FIG. 84 APEJ Polyamide 6 Market Volume ( Metric Tonnes), By End Use 2018-2026
FIG. 85 APEJ Polyamide 6 Market Volume ( Metric Tonnes), By Commercial Grades 2012-2017
FIG. 86 APEJ Polyamide 6 Market Volume ( Metric Tonnes), By Commercial Grades 2018-2026
FIG. 87 APEJ Polyamide 6 Market Volume ( Metric Tonnes), By Application 2012-2017
FIG. 88 APEJ Polyamide 6 Market Volume ( Metric Tonnes), By Application 2018-2026
FIG. 89 MEA Polyamide 6 Market Volume ( Metric Tonnes), By Country 2012-2017
FIG. 90 MEA Polyamide 6 Market Volume ( Metric Tonnes), By Country 2018-2026
FIG. 91 MEA Polyamide 6 Market Volume ( Metric Tonnes), By End Use 2012-2017
FIG. 92 MEA Polyamide 6 Market Volume ( Metric Tonnes), By End Use 2018-2026
FIG. 93 MEA Polyamide 6 Market Volume ( Metric Tonnes), By Commercial Grades 2012-2017
FIG. 94 MEA Polyamide 6 Market Volume ( Metric Tonnes), By Commercial Grades 2018-2026
FIG. 95 MEA Polyamide 6 Market Volume ( Metric Tonnes), By Application 2012-2017
FIG. 96 MEA Polyamide 6 Market Volume ( Metric Tonnes), By Application 2018-2026
Copyright © Transparency Market Research, Inc. All Rights reserved
Trust Online

Polyamide 6 Market