
Reports
Reports
Physical security information management is a software suite comprising applications and platforms, which are developed to integrate several non-connected security applications and devices, and are monitored with an all-in-one user interface.
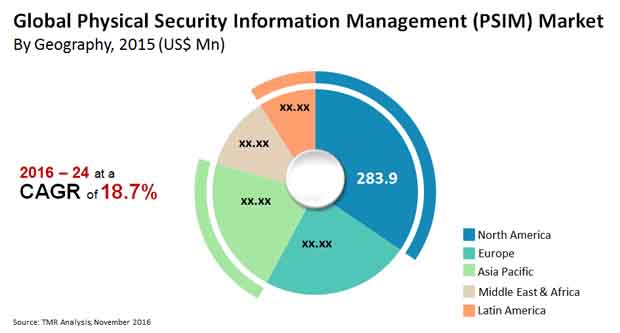
A TMR study projects the global physical security information management market to grow at a compound annual growth rate (CAGR) of 18.1% during the forecast period between 2016 and 2024. The physical security information management market was valued at US $ 823.1 Mn in 2015 and it is anticipated to reach a valuation of US $ 3832.1 Mn, by the end of the assessment period.
The rising value proposition, which is achieved by the adoption of integrated platforms and security systems across various industries has emerged as a key growth driver for the physical security information management market.
Organizations, across industries, have witnessed a rise in security breaches in recent times, and this has also led to an increase in demand for physical security information management systems.
The global physical security information management market is studied based on component, end-use, and region.
Based on component, it is segmented into software and services. The software segment comprises off the shelf and customized software. The services segment includes systems integration, operation and maintenance, and consulting and training.
Cloud-based customized software is expected to generate high demand in the physical security information management market, in future.
Based on end-use, the physical security information management market is classified into banking, transportation and logistics, residential, retail, telecom and information technology, industrial manufacturing, healthcare, hospital, and government and defense sector.
The government and defense sector, in 2015, dominated the global physical security information management market, accounting for 11.6% of the overall share. The government and defense sector end-use segment is anticipated to grow at a CAGR of 20% in the overall physical security information management market in future.
The hospitality end-use segment is also anticipated to witness a surge in demand for physical security information management systems owing to increased need to protect hotel infrastructures.
The transportation and logistics end-use segment is also expected to generate huge demand in the overall physical security information management market, in future. This is because of the
increasing need to monitor transportation activities in the logistics industry, which is likely to fuel demand for physical security information management solutions. This,in turn, propels the overall physical security information management market.
The global physical security information management market is divided into five regions: Asia Pacific, North America, Middle East and Africa, Europe, and Latin America.
North America accounted for a major share in the global physical security information management market in 2015, holding 36% of the overall share. A key growth driver is the increasing usage of physical security information management software across various industries, located in this region.
Also, North America has many established physical security information management system vendors, leading to greater adoption of the software in this region. These factors are expected to propel the physical security information management market in North America, in future as well.
The physical security information management market is extremely fragmented. Some of the key players in the market include NEC Corporation, CNL Software, Tyco International Ltd., NICE Ltd., Milestone Systems A/S, and Genetec Inc.
Several key market players are looking to manufacture superior products to gain an edge over the competitors.
Video management system (VMS) vendors and third-party vendors have signed joint partnerships to provide end-users with integrated solutions that meet the requirements.
The use of automation in physical security information management systems has resulted in a substantial decline in operational costs, which has positively impacted the physical security information management market.
1. Preface
1.1. Market Definition and Scope
1.2. Market Segmentation
1.3. Key Research Objectives
1.4. Research Highlights
2. Assumptions and Research Methodology
3. Executive Summary: Global Physical Security Information Management (PSIM) Market
4. Market Overview
4.1. Introduction
4.1.1. Product Definition
4.1.2. Industry Evolution / Developments
4.2. Physical Security Information Management (PSIM) Market Overview
4.3. Key Market Indicators
4.3.1. Physical Security Information Management (PSIM) End-users in Emerging Economies
4.4. Market Dynamics
4.4.1. Drivers
4.4.2. Restraints
4.4.3. Opportunity
4.5. Global Physical Security Information Management (PSIM) Market Analysis and Forecasts, 2014 – 2024
4.5.1. Market Revenue Projections (US$ Mn)
4.5.2. Physical Security Information Management (PSIM) Market - Global End-use End-user Scenario
4.6. Porter’s Five Force Analysis
4.7. Value Chain Analysis
4.7.1. List of Active Market Participants (suppliers/distributors/manufacturers/vendors)
4.7.2. Forward – Backward Integration Scenario
4.8. Product’s Lifecycle and Characteristics Analysis
4.9. Analysis of Key Projects for PSIM
4.10. Market Outlook
5. Global Physical Security Information Management (PSIM) Market Analysis and Forecasts, By Component
5.1. Introduction & Definition
5.2. Key Findings / Developments
5.3. Key Trends
5.4. Market Size (US$ Mn) Forecast By Component
5.4.1. Software, 2014 – 2024 (US$ Mn)
5.4.1.1. Off-the Shelf
5.4.1.1.1. On-premise
5.4.1.1.2. Cloud-based
5.4.1.2. Customized
5.4.1.2.1. On-premise
5.4.1.2.2. Cloud-based
5.4.2. Service, 2014 – 2024 (US$ Mn)
5.4.2.1. Installation/ System Integration
5.4.2.2. Operation & Maintenance
5.4.2.3. Consulting & Training
5.5. Component Comparison Matrix
5.6. Market Attractiveness by Component
6. Global Physical Security Information Management (PSIM) Market Analysis and Forecasts, By End-user
6.1. Introduction & Definition
6.2. Key Findings / Developments
6.3. Key Trends
6.4. Market Size (US$ Mn) Forecast By End-user
6.4.1. Residential, 2014 – 2024 (US$ Mn)
6.4.2. Banking, Financial Services & Insurance (BFSI), 2014 – 2024 (US$ Mn)
6.4.3. Retail, 2014 – 2024 (US$ Mn)
6.4.4. Transportation & Logistics, 2014 – 2024 (US$ Mn)
6.4.5. Government & Defense Sector), 2014 – 2024 (US$ Mn)
6.4.6. Industrial Manufacturing, 2014 – 2024 (US$ Mn)
6.4.7. Healthcare, 2014 – 2024 (US$ Mn)
6.4.8. Telecom & IT, 2014 – 2024 (US$ Mn)
6.4.9. Hospitality, 2014 – 2024 (US$ Mn)
6.4.10. Energy & Utility, 2014 – 2024 (US$ Mn)
6.4.11. Others (Educational Institutions, Religious Buildings, Stadiums and Other Infrastructure), 2014 – 2024 (US$ Mn)
6.5. End-user Comparison Matrix
6.6. Market Attractiveness by End-user
7. Global Physical Security Information Management (PSIM) Market Analysis and Forecasts, By Region
7.1. Key Findings
7.2. Policies and Regulations
7.3. Market Size (US$ Mn) Forecast By Region, 2014 – 2024 (US$ Mn)
7.3.1. North America
7.3.2. Europe
7.3.3. Asia Pacific
7.3.4. Middle East and Africa
7.3.5. South America
7.4. Market Attractiveness by Country/Region
8. North America Physical Security Information Management (PSIM) Market Analysis and Forecast
8.1. Key Findings
8.2. Policies and Regulations
8.3. Price Trend Analysis
8.4. Key Trends
8.5. Market Size (US$ Mn) Forecast By Component
8.5.1. Software, 2014 – 2024 (US$ Mn)
8.5.1.1. Off-the Shelf
8.5.1.1.1. On-premise
8.5.1.1.2. Cloud-based
8.5.1.2. Customized
8.5.1.2.1. On-premise
8.5.1.2.2. Cloud-based
8.5.2. Service, 2014 – 2024 (US$ Mn)
8.5.2.1. Installation/ System Integration
8.5.2.2. Operation & Maintenance
8.5.2.3. Consulting & Training
8.6. Market Size (US$ Mn) Forecast By End-user
8.6.1. Residential, 2014 – 2024 (US$ Mn)
8.6.2. Banking, Financial Services & Insurance (BFSI), 2014 – 2024 (US$ Mn)
8.6.3. Retail, 2014 – 2024 (US$ Mn)
8.6.4. Transportation & Logistics, 2014 – 2024 (US$ Mn)
8.6.5. Government & Defense Sector, 2014 – 2024 (US$ Mn)
8.6.6. Industrial Manufacturing, 2014 – 2024 (US$ Mn)
8.6.7. Healthcare, 2014 – 2024 (US$ Mn)
8.6.8. Telecom & IT, 2014 – 2024 (US$ Mn)
8.6.9. Hospitality, 2014 – 2024 (US$ Mn)
8.6.10. Energy & Utility, 2014 – 2024 (US$ Mn)
8.6.11. Others (Educational Institutions, Religious Buildings, Stadiums and Other Infrastructure), 2014 – 2024 (US$ Mn)
8.7. Market Size (US$ Mn) Forecast By Country, 2014 - 2024
8.7.1. The U.S.
8.7.2. Canada
8.7.3. Rest of North America
8.8. Market Attractiveness Analysis
8.8.1. By Component
8.8.2. By End-user
8.8.3. By Country
9. Europe Physical Security Information Management (PSIM) Market Analysis and Forecast
9.1. Key Findings
9.2. Policies and Regulations
9.3. Price Trend Analysis
9.4. Key Trends
9.5. Market Size (US$ Mn) Forecast By Component
9.5.1. Software, 2014 – 2024 (US$ Mn)
9.5.1.1. Off-the Shelf
9.5.1.1.1. On-premise
9.5.1.1.2. Cloud-based
9.5.1.2. Customized
9.5.1.2.1. On-premise
9.5.1.2.2. Cloud-based
9.5.2. Service, 2014 – 2024 (US$ Mn)
9.5.2.1. Installation/ System Integration
9.5.2.2. Operation & Maintenance
9.5.2.3. Consulting & Training
9.6. Market Size (US$ Mn) Forecast By End-user
9.6.1. Residential, 2014 – 2024 (US$ Mn)
9.6.2. Banking, Financial Services & Insurance (BFSI), 2014 – 2024 (US$ Mn)
9.6.3. Retail, 2014 – 2024 (US$ Mn)
9.6.4. Transportation & Logistics, 2014 – 2024 (US$ Mn)
9.6.5. Government & Defense Sector, 2014 – 2024 (US$ Mn)
9.6.6. Industrial Manufacturing, 2014 – 2024 (US$ Mn)
9.6.7. Healthcare, 2014 – 2024 (US$ Mn)
9.6.8. Telecom & IT, 2014 – 2024 (US$ Mn)
9.6.9. Hospitality, 2014 – 2024 (US$ Mn)
9.6.10. Energy & Utility, 2014 – 2024 (US$ Mn)
9.6.11. Others (Educational Institutions, Religious Buildings, Stadiums and Other Infrastructure), 2014 – 2024 (US$ Mn)
9.7. Market Size (US$ Mn) Forecast By Country, 2014 - 2024
9.7.1. The U.K.
9.7.2. Germany
9.7.3. France
9.7.4. Italy
9.7.5. Rest of Europe
9.8. Market Attractiveness Analysis
9.8.1. By Component
9.8.2. By End-user
9.8.3. By Country
10. Asia Pacific Physical Security Information Management (PSIM) Market Analysis and Forecast
10.1. Key Findings
10.2. Policies and Regulations
10.3. Price Trend Analysis
10.4. Key Trends
10.5. Market Size (US$ Mn) Forecast By Component
10.5.1. Software, 2014 – 2024 (US$ Mn)
10.5.1.1. Off-the Shelf
10.5.1.1.1. On-premise
10.5.1.1.2. Cloud-based
10.5.1.2. Customized
10.5.1.2.1. On-premise
10.5.1.2.2. Cloud-based
10.5.2. Service, 2014 – 2024 (US$ Mn)
10.5.2.1. Installation/ System Integration
10.5.2.2. Operation & Maintenance
10.5.2.3. Consulting & Training
10.6. Market Size (US$ Mn) Forecast By Country, 2014 - 2024
10.6.1. India
10.6.2. China
10.6.3. Japan
10.6.4. South Korea
10.6.5. Rest of Asia Pacific
10.7. Market Attractiveness Analysis
10.7.1. By Component
10.7.2. By End-user
10.7.3. By Country
11. Middle East and Africa (MEA) Physical Security Information Management (PSIM) Market Analysis and Forecast
11.1. Key Findings
11.2. Policies and Regulations
11.3. Price Trend Analysis
11.4. Key Trends
11.5. Market Size (US$ Mn) Forecast By Component
11.5.1. Software, 2014 – 2024 (US$ Mn)
11.5.1.1. Off-the Shelf
11.5.1.1.1. On-premise
11.5.1.1.2. Cloud-based
11.5.1.2. Customized
11.5.1.2.1. On-premise
11.5.1.2.2. Cloud-based
11.5.2. Service, 2014 – 2024 (US$ Mn)
11.5.2.1. Installation/ System Integration
11.5.2.2. Operation & Maintenance
11.5.2.3. Consulting & Training
11.6. Market Size (US$ Mn) Forecast By End-user
11.6.1. Residential, 2014 – 2024 (US$ Mn)
11.6.2. Banking, Financial Services & Insurance (BFSI), 2014 – 2024 (US$ Mn)
11.6.3. Retail, 2014 – 2024 (US$ Mn)
11.6.4. Transportation & Logistics, 2014 – 2024 (US$ Mn)
11.6.5. Government & Defense Sector, 2014 – 2024 (US$ Mn)
11.6.6. Industrial Manufacturing, 2014 – 2024 (US$ Mn)
11.6.7. Healthcare, 2014 – 2024 (US$ Mn)
11.6.8. Telecom & IT, 2014 – 2024 (US$ Mn)
11.6.9. Hospitality, 2014 – 2024 (US$ Mn)
11.6.10. Energy & Utility, 2014 – 2024 (US$ Mn)
11.6.11. Others (Educational Institutions, Religious Buildings, Stadiums and Other Infrastructure), 2014 – 2024 (US$ Mn)
11.7. Market Size (US$ Mn) Forecast By Country
11.7.1. GCC Countries
11.7.2. South Africa
11.7.3. Rest of MEA
11.8. Market Attractiveness Analysis
11.8.1. By Component
11.8.2. By End-user
11.8.3. By Country
12. South America Physical Security Information Management (PSIM) Market Analysis and Forecast
12.1. Key Findings
12.2. Policies and Regulations
12.3. Price Trend Analysis
12.4. Key Trends
12.5. Market Size (US$ Mn) Forecast By Component
12.5.1. Software, 2014 – 2024 (US$ Mn)
12.5.1.1. Off-the Shelf
12.5.1.1.1. On-premise
12.5.1.1.2. Cloud-based
12.5.1.2. Customized
12.5.1.2.1. On-premise
12.5.1.2.2. Cloud-based
12.5.2. Service, 2014 – 2024 (US$ Mn)
12.5.2.1. Installation/ System Integration
12.5.2.2. Operation & Maintenance
12.5.2.3. Consulting & Training
12.6. Market Size (US$ Mn) Forecast By End-user
12.6.1. Residential), 2014 – 2024 (US$ Mn)
12.6.2. Banking, Financial Services & Insurance (BFSI), 2014 – 2024 (US$ Mn)
12.6.3. Retail, 2014 – 2024 (US$ Mn)
12.6.4. Transportation & Logistics, 2014 – 2024 (US$ Mn)
12.6.5. Government & Defense Sector, 2014 – 2024 (US$ Mn)
12.6.6. Industrial Manufacturing, 2014 – 2024 (US$ Mn)
12.6.7. Healthcare, 2014 – 2024 (US$ Mn)
12.6.8. Telecom & IT, 2014 – 2024 (US$ Mn)
12.6.9. Hospitality, 2014 – 2024 (US$ Mn)
12.6.10. Energy & Utility, 2014 – 2024 (US$ Mn)
12.6.11. Others (Educational Institutions, Religious Buildings, Stadiums and Other Infrastructure), 2014 – 2024 (US$ Mn)
12.7. Market Size (US$ Mn) Forecast By Country, 2014 - 2024
12.7.1. Brazil
12.7.2. Argentina
12.7.3. Rest of South America
12.8. Market Attractiveness Analysis
12.8.1. By Component
12.8.2. By End-user
12.8.3. By Country
13. Competition Landscape
13.1. Market Player – Competition Matrix (By Tier and Size of companies)
13.2. Market Share Analysis by Company (2015)
13.3. Company Profiles
13.3.1. NEC Corporation
13.3.1.1. Company Details (HQ, Foundation Year, Employee Strength)
13.3.1.2. Market Presence, By Segment and Geography
13.3.1.3. Key Developments
13.3.1.4. Strategy and Historical Roadmap
13.3.1.5. Revenue and Operating Profits
13.3.2. CNL Software Ltd.
13.3.2.1. Company Details (HQ, Foundation Year, Employee Strength)
13.3.2.2. Market Presence, By Segment and Geography
13.3.2.3. Key Developments
13.3.2.4. Strategy and Historical Roadmap
13.3.2.5. Revenue and Operating Profits
13.3.3. VidSys, Inc.
13.3.3.1. Company Details (HQ, Foundation Year, Employee Strength)
13.3.3.2. Market Presence, By Segment and Geography
13.3.3.3. Key Developments
13.3.3.4. Strategy and Historical Roadmap
13.3.3.5. Revenue and Operating Profits
13.3.4. Tyco International Ltd. (Proximex Corporation)
13.3.4.1. Company Details (HQ, Foundation Year, Employee Strength)
13.3.4.2. Market Presence, By Segment and Geography
13.3.4.3. Key Developments
13.3.4.4. Strategy and Historical Roadmap
13.3.4.5. Revenue and Operating Profits
13.3.5. NICE Systems Ltd.
13.3.5.1. Company Details (HQ, Foundation Year, Employee Strength)
13.3.5.2. Market Presence, By Segment and Geography
13.3.5.3. Key Developments
13.3.5.4. Strategy and Historical Roadmap
13.3.5.5. Revenue and Operating Profits
13.3.6. Mer Inc.
13.3.6.1. Company Details (HQ, Foundation Year, Employee Strength)
13.3.6.2. Market Presence, By Segment and Geography
13.3.6.3. Key Developments
13.3.6.4. Strategy and Historical Roadmap
13.3.6.5. Revenue and Operating Profits
13.3.7. Intergraph Corporation
13.3.7.1. Company Details (HQ, Foundation Year, Employee Strength)
13.3.7.2. Market Presence, By Segment and Geography
13.3.7.3. Key Developments
13.3.7.4. Strategy and Historical Roadmap
13.3.7.5. Revenue and Operating Profits
13.3.8. videoNEXT Federal, Inc.
13.3.8.1. Company Details (HQ, Foundation Year, Employee Strength)
13.3.8.2. Market Presence, By Segment and Geography
13.3.8.3. Key Developments
13.3.8.4. Strategy and Historical Roadmap
13.3.8.5. Revenue and Operating Profits
13.3.9. S2 Security Corporation
13.3.9.1. Company Details (HQ, Foundation Year, Employee Strength)
13.3.9.2. Market Presence, By Segment and Geography
13.3.9.3. Key Developments
13.3.9.4. Strategy and Historical Roadmap
13.3.9.5. Revenue and Operating Profits
13.3.10. Milestone Systems A/S.
13.3.10.1. Company Details (HQ, Foundation Year, Employee Strength)
13.3.10.2. Market Presence, By Segment and Geography
13.3.10.3. Key Developments
13.3.10.4. Strategy and Historical Roadmap
13.3.10.5. Revenue and Operating Profits
13.3.11. Genetec Inc.
13.3.11.1. Company Details (HQ, Foundation Year, Employee Strength)
13.3.11.2. Market Presence, By Segment and Geography
13.3.11.3. Key Developments
13.3.11.4. Strategy and Historical Roadmap
13.3.11.5. Revenue and Operating Profits
13.3.12. AxxonSoft
13.3.12.1. Company Details (HQ, Foundation Year, Employee Strength)
13.3.12.2. Market Presence, By Segment and Geography
13.3.12.3. Key Developments
13.3.12.4. Strategy and Historical Roadmap
13.3.12.5. Revenue and Operating Profits
14. Key Takeaways
List of Tables
Table 1: Global Physical Security Information Management Market Size (US$ Mn) Forecast, by Component, 2014 – 2024
Table 2: Global Physical Security Information Management Market Size (US$ Mn) Forecast, by Software, 2014 – 2024
Table 3: Global Physical Security Information Management Market Size (US$ Mn) Forecast, by Software, Off-the Shelf, 2014 – 2024
Table 4: Global Physical Security Information Management Market Size (US$ Mn) Forecast, by Software, Customized, 2014 – 2024
Table 5: Global Physical Security Information Management Market Size (US$ Mn) Forecast, by Service, 2014 – 2024
Table 6: Global Physical Information Management Market Size (US$ Mn) Forecast, by End-User, 2014 – 2024
Table 7: Global Physical Security Information Management Market Size (US$ Mn) Forecast, by Region, 2014 – 2024
Table 8: North America Physical Security Information Management Market Size (US$ Mn) Forecast, by Component, 2014 – 2024
Table 9: North America Physical Security Information Management Market Size (US$ Mn) Forecast, by Software, 2014 – 2024
Table 10: North America Physical Security Information Management Market Size (US$ Mn) Forecast, by Software, Off-the Shelf, 2014 – 2024
Table 11: North America Physical Security Information Management Market Size (US$ Mn) Forecast, by Software, Customized, 2014 – 2024
Table 12: North America Physical Security Information Management Market Size (US$ Mn) Forecast, by Service, 2014 – 2024
Table 13: North America Physical Information Management Market Size (US$ Mn) Forecast, by End-user, 2014 – 2024
Table 14: North America Physical Security Information Management Market Size (US$ Mn) Forecast, by Country, 2014 – 2024
Table 15: Europe Physical Security Information Management Market Size (US$ Mn) Forecast, by Component, 2014 – 2024
Table 16: Europe Physical Security Information Management Market Size (US$ Mn) Forecast, by Software, 2014 – 2024
Table 17: Europe Physical Security Information Management Market Size (US$ Mn) Forecast, by Software, Off-the Shelf, 2014 – 2024
Table 18: Europe Physical Security Information Management Market Size (US$ Mn) Forecast, by Software, Customized, 2014 – 2024
Table 19: Europe Physical Security Information Management Market Size (US$ Mn) Forecast, by Service, 2014 – 2024
Table 20: Europe Physical Information Management Market Size (US$ Mn) Forecast, by End-user, 2014 – 2024
Table 21: Europe Physical Security Information Management Market Size (US$ Mn) Forecast, by Country, 2014 – 2024
Table 22: Asia Pacific Physical Security Information Management Market Size (US$ Mn) Forecast, by Component, 2014 – 2024
Table 23: Asia Pacific Physical Security Information Management Market Size (US$ Mn) Forecast, by Software, 2014 – 2024
Table 24: Asia Pacific Physical Security Information Management Market Size (US$ Mn) Forecast, by Software, Off-the Shelf, 2014 – 2024
Table 25: Asia Pacific Physical Security Information Management Market Size (US$ Mn) Forecast, by Software, Customized, 2014 – 2024
Table 26: Asia Pacific Physical Security Information Management Market Size (US$ Mn) Forecast, by Service, 2014 – 2024
Table 27: Asia Pacific Physical Information Management Market Size (US$ Mn) Forecast, by End-user, 2014 – 2024
Table 28: Asia Pacific Physical Security Information Management Market Size (US$ Mn) Forecast, by Country, 2014 – 2024
Table 29: MEA Physical Security Information Management Market Size (US$ Mn) Forecast, by Component, 2014 – 2024
Table 30: MEA Physical Security Information Management Market Size (US$ Mn) Forecast, by Software, 2014 – 2024
Table 31: MEA Physical Security Information Management Market Size (US$ Mn) Forecast, by Software, Off-the Shelf, 2014 – 2024
Table 32: MEA Physical Security Information Management Market Size (US$ Mn) Forecast, by Software, Customized, 2014 – 2024
Table 33: MEA Physical Security Information Management Market Size (US$ Mn) Forecast, by Service, 2014 – 2024
Table 34: MEA Physical Information Management Market Size (US$ Mn) Forecast, by End-user, 2014 – 2024
Table 35: MEA Physical Security Information Management Market Size (US$ Mn) Forecast, by Country, 2014 – 2024
Table 36: South America Physical Security Information Management Market Size (US$ Mn) Forecast, by Component, 2014 – 2024
Table 37: South America Physical Security Information Management Market Size (US$ Mn) Forecast, by Software, 2014 – 2024
Table 38: South America Physical Security Information Management Market Size (US$ Mn) Forecast, by Software, Off-the Shelf, 2014 – 2024
Table 39: South America Physical Security Information Management Market Size (US$ Mn) Forecast, by Software, Customized, 2014 – 2024
Table 40: South America Physical Security Information Management Market Size (US$ Mn) Forecast, by Service, 2014 – 2024
Table 41: South America Physical Information Management Market Size (US$ Mn) Forecast, by End-user, 2014 – 2024
List of Figures
Figure 01: Global Physical Security Information Management Market Size (US$ Mn) Forecast, 2014 – 2024
Figure 02: Global Physical Security Information Management Market Y-o-Y Growth (Value %) Forecast, 2014 – 2024
Figure 03: Market Value Share, by End-user (%), 2016
Figure 04: Market Value Share, by Component (%), 2016
Figure 05: Global Opportunity Growth Analysis (US$ Mn), 2014 - 2024
Figure 06: Global Physical Security Information Management Market Value Share Analysis, by Component, 2016 and 2024
Figure 07: Market Size (US$ Mn) Forecast by Component - Software
Figure 08: Market Size (US$ Mn) Forecast by Component - Service
Figure 09: Global Physical Security Information Management Market Value Share Analysis, by Software, 2016 and 2024
Figure 10: Market Size (US$ Mn) Forecast by Software - Off-the Shelf
Figure 11: Market Size (US$ Mn) Forecast by Software - Customized
Figure 12: Market Share (Value %) Forecast by Software, Off-the Shelf
Figure 13: Market Share (Value %) Forecast by Software, Customized
Figure 14: Global Physical Security Information Management Market Value Share Analysis, by Service, 2016 and 2024
Figure 15: Market Size (US$ Mn) Forecast by Service, Installation/System Integration
Figure 16: Market Size (US$ Mn) Forecast by Service, Operation & Maintenance
Figure 17: Market Size (US$ Mn) Forecast by Service, Consulting & Training
Figure 18: Physical Security Information Management Market Attractiveness, by Component
Figure 19: Global Physical Security Information Management Market Value Share Analysis, by End-User, 2016 and 2024
Figure 20: Market Size (US$ Mn) Forecast by End-User, Residential
Figure 21: Market Size (US$ Mn) Forecast by End-User, Retail
Figure 22: Market Size (US$ Mn) Forecast by End-User, BFSI
Figure 23: Market Size (US$ Mn) Forecast by End-User, Telecom & IT
Figure 24: Market Size (US$ Mn) Forecast by End-User, Transportation & Logistics
Figure 25: Market Size (US$ Mn) Forecast by End-User, Government & Defense Sector
Figure 26: Market Size (US$ Mn) Forecast by End-User, Hospitality
Figure 27: Market Size (US$ Mn) Forecast by End-User, Industrial Manufacturing
Figure 28: Market Size (US$ Mn) Forecast by End-User, Energy & Utility
Figure 29: Market Size (US$ Mn) Forecast by End-User, Healthcare
Figure 30: Market Size (US$ Mn) Forecast by End-User, Others
Figure 31: Physical Security Information Management Market Analysis, by End-User (Top 6)
Figure 32: Global Physical Security Information Management Market Value Share Analysis, by Region, 2016 and 2024
Figure 33: Physical Security Information Management Market Attractiveness Analysis, by Region
Figure 34: North America Price Trend Analysis
Figure 35: North America Physical Security Information Management Market Size (US$ Mn) Forecast, 2014 – 2024
Figure 36: North America Physical Security Information Management Market Y-o-Y Growth (Value %) Forecast, 2014 – 2024
Figure 37: North America Physical Security Information Management Market Value Share Analysis, by Component, 2016 and 2024
Figure 38: North America Physical Security Information Management Market Value Share Analysis, by Software, 2016 and 2024
Figure 39: Market Share (Value %) Forecast by Software, Off-the Shelf
Figure 40: Market Share (Value %) Forecast by Software, Customized
Figure 41: North America Physical Security Information Management Market Value Share Analysis, by Service, 2016 and 2024
Figure 42: North America Physical Security Information Management Market Value Share Analysis, by End-user, 2016 and 2024
Figure 43: North America Physical Security Information Management Market Value Share Analysis, by Country, 2016 and 2024
Figure 44: Market Attractiveness, by Component (2015)
Figure 45: Market Attractiveness, by End-user (2015)
Figure 46: Market Attractiveness, by Country (2015)
Figure 47: Europe Price Trend Analysis
Figure 48: Europe Physical Security Information Management Market Size (US$ Mn) Forecast, 2014 – 2024
Figure 49: Europe Physical Security Information Management Market Y-o-Y Growth (Value %) Forecast, 2014 – 2024
Figure 50: Europe Physical Security Information Management Market Value Share Analysis, by Component, 2016 and 2024
Figure 51: Europe Physical Security Information Management Market Value Share Analysis, by Software, 2016 and 2024
Figure 52: Market Share (Value %) Forecast by Software, Off-the Shelf
Figure 53: Market Share (Value %) Forecast by Software, Customized
Figure 54: Europe Physical Security Information Management Market Value Share Analysis, by Service, 2016 and 2024
Figure 55: Europe Physical Security Information Management Market Value Share Analysis, by End-user, 2016 and 2024
Figure 56: Europe Physical Security Information Management Market Value Share Analysis, by Country, 2016 and 2024
Figure 57: Market Attractiveness, by Component (2015)
Figure 58: Market Attractiveness, by End-user (2015)
Figure 59: Market Attractiveness, by Country (2015)
Figure 60: Asia Pacific Price Trend Analysis
Figure 61: Asia Pacific Physical Security Information Management Market Size (US$ Mn) Forecast, 2014 – 2024
Figure 62: Asia Pacific Physical Security Information Management Market Y-o-Y Growth (Value %) Forecast, 2014 – 2024
Figure 63: Asia Pacific Physical Security Information Management Market Value Share Analysis, by Component, 2016 and 2024
Figure 64: Asia Pacific Physical Security Information Management Market Value Share Analysis, by Software, 2016 and 2024
Figure 65: Market Share (Value %) Forecast by Software, Off-the Shelf
Figure 66: Market Share (Value %) Forecast by Software, Customized
Figure 67: Asia Pacific Physical Security Information Management Market Value Share Analysis, by Service, 2016 and 2024
Figure 68: Asia Pacific Physical Security Information Management Market Value Share Analysis, by End-user, 2016 and 2024
Figure 69: Asia Pacific Physical Security Information Management Market Value Share Analysis, by Country, 2016 and 2024
Figure 70: Market Attractiveness, by Component (2015)
Figure 71: Market Attractiveness, by End-user (2015)
Figure 72: Market Attractiveness, by Country (2015)
Figure 73: MEA Price Trend Analysis
Figure 74: MEA Physical Security Information Management Market Size (US$ Mn) Forecast, 2014 – 2024
Figure 75: MEA Physical Security Information Management Market Y-o-Y Growth (Value %) Forecast, 2014 – 2024
Figure 76: MEA Physical Security Information Management Market Value Share Analysis, by Component, 2016 and 2024
Figure 77: MEA Physical Security Information Management Market Value Share Analysis, by Software, 2016 and 2024
Figure 78: Market Share (Value %) Forecast by Software, Off-the Shelf
Figure 79: Market Share (Value %) Forecast by Software, Customized
Figure 80: MEA Physical Security Information Management Market Value Share Analysis, by Service, 2016 and 2024
Figure 81: MEA Physical Security Information Management Market Value Share Analysis, by End-user, 2016 and 2024
Figure 82: MEA Physical Security Information Management Market Value Share Analysis, by Country, 2016 and 2024
Figure 83: Market Attractiveness, by Component (2015)
Figure 84: Market Attractiveness, by End-user (2015)
Figure 85: Market Attractiveness, by Country (2015)
Figure 86: South America Price Trend Analysis
Figure 87: South America Physical Security Information Management Market Size (US$ Mn) Forecast, 2014 – 2024
Figure 88: South America Physical Security Information Management Market Y-o-Y Growth (Value %) Forecast, 2014 – 2024
Figure 89: South America Physical Security Information Management Market Value Share Analysis, by Component, 2016 and 2024
Figure 90: South America Physical Security Information Management Market Value Share Analysis, by Software, 2016 and 2024
Figure 91: Market Share (Value %) Forecast by Software, Off-the Shelf
Figure 92: Market Share (Value %) Forecast by Software, Customized
Figure 93: South America Physical Security Information Management Market Value Share Analysis, by Service, 2016 and 2024
Figure 94: South America Physical Security Information Management Market Value Share Analysis, by End-user, 2016 and 2024
Figure 95: South America Physical Security Information Management Market Value Share Analysis, by Country, 2016 and 2024
Figure 96: Market Attractiveness, by Component (2015)
Figure 97: Market Attractiveness, by End-user (2015)
Figure 98: Market Attractiveness, by Country (2015)
Figure 99: Global Physical Security Information Management Market Share Analysis by Company (2015)
Copyright © Transparency Market Research, Inc. All Rights reserved
Trust Online

Physical Security Information Management Market