
Reports
Reports
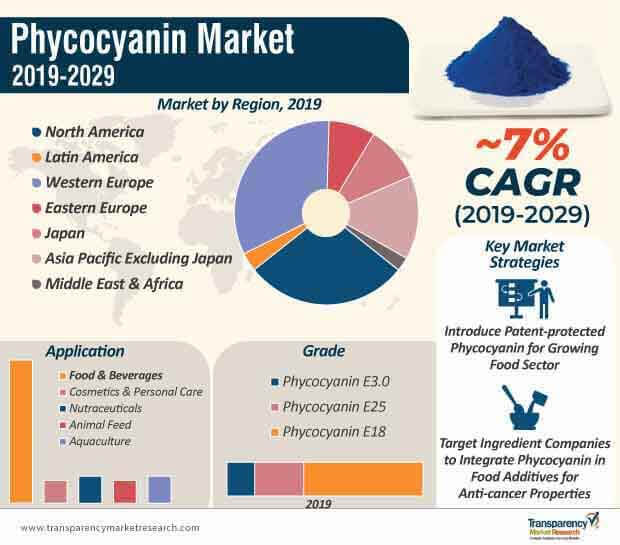
Revenue of the phycocyanin market accounted to be the highest in Western Europe in 2018, estimated to reach ~US$ 77 million in 2029. Currently, ~60% of Europeans consume functional foods, and a higher number of women consume functional beverages. As such, manufacturers are introducing patent-protected phycocyanin food additives. This indoor-grown pigment serves as a cost-efficient option for stakeholders in the food sector.
The food industry is experiencing a shift in consumer preference, from artificial ingredients to natural ingredients. This changing trend has triggered the production of phycocyanic, which acts as a nutritious protein-pigment complex in several food and beverage applications. Its antioxidant and anti-inflammatory properties are increasingly gaining consumer attention as far as food supplements are concerned.
Since the development of natural blue ingredients is a challenge, manufacturers are innovating on phycocyanin, which is naturally found in spirulina algae. For instance, in August 2019, ScotBio - a producer of all-natural food colorants and proteins, announced an increase in its production of phycocyanin for stakeholders in the natural colorants market.
The food and beverage (F&B) market is estimated to reach ~US$ 16 trillion by 2020. That is why, manufacturers are targeting stakeholders in the F&B space to increase the application of phycocyanin in confectionaries, ice creams, and beverages. Since phycocyanin provides more stability as compared to other natural blue colorants, stakeholders in the F&B landscape are increasingly using this pigment for alcoholic beverages.
As the F&B industry is rapidly growing, manufacturers are increasing the production of indoor-grown, high-quality, and pure phycocyanin. To achieve this, they are growing their own spirulina algae in custom-growing facilities to extract five times more algae as compared to extracting phycocyanin from open pond systems, which also serves as a cost-effective option for them.
Stakeholders in the hospitality space are using phycocyanin to develop sugar-free food and beverage options. The blue pigment is mixed with different bulking agents and sugars to provide flexibility in the formulation stage to food professionals. Manufacturers are focusing on expanding their product portfolios of different ingredients with the help of synthetic biology. This helps them improve the quality, quantity, and stability of phycocyanin through non-transgenic genetic modification.
The phycocyanin market is moderately fragmented, which creates opportunities for new players to enter the market. However, stringent regulations by government authorities have created an added pressure over existing and emerging market players to comply with the same.
Growing awareness about clean-label ingredients amongst consumers has created challenges for manufacturers to achieve certain production requirements. For instance, the introduction of clean-label ingredients has forced manufacturers to ensure end-to-end traceability, maintain the security of supply, and establish a controlled environment. As such, manufacturers are developing patented systems that are integrated with special red lighting that helps in the production of all-natural ingredients.
The high demand for phycocyanin has created a shortage in the marketplace. Extracting phycocyanin from open pond systems serves as an easy and convenient option for manufacturers. However, these pond systems are prone to high risks of contamination. As such, manufacturers are adopting the cost-competitive method of growing their own spirulina algae to ensure the year-round supply of phycocyanin.
Analysts’ Viewpoint
The phycocyanin market is estimated for a 2X increase in revenue during the forecast period. This pigment is being increasingly used as a functional food additive that carries healthcare efficacy, with little or no side effects. Stakeholders in the healthcare industry are using phycocyanin in marine functional products to treat non-small cell lung cancer. The high protein content of phycocyanin is helping manufacturers in developing improved nutraceuticals. Other applications that are likely to catalyze market growth are pharmaceuticals, cosmeceuticals, and non-toxic inks. However, the demand for clean-label ingredients has added regulatory pressure on manufacturers. As such, manufacturers should look at producing clean-label phycocyanin with the help of special patented systems, and focus on improved methods for the commercial production of phycocyanin.
Approval from Regulatory and Governmental Bodies Creating Positive Impact
Growing Awareness about Health Benefits of Phycocyanin
Increase in Research & Development Spending
Rising Trend of Veganism Fueling Phycocyanin Market Growth
Phycocyanin Market: Key Players
Phycocyanin Market: Key Developments
1. Global Phycocyanin Market - Executive Summary
1.1. Global Phycocyanin Market Country Analysis
1.2. Vertical Specific Market Penetration
1.3. Application – Product Mapping
1.4. Proprietary Wheel of Fortune
1.5. TMR Analysis and Recommendations
2. Market Introduction
2.1. Market Introduction
2.2. Market Definition
2.3. Market Taxonomy
3. Market Dynamics
3.1. Macro-economic Factors
3.1.1. Urbanization Growth Rate in Key Countries
3.1.2. Per Capita Consumption Expenditure
3.1.3. Growth in Retail Sales
3.2. Drivers
3.2.1. Economic Drivers
3.2.2. Supply Side Drivers
3.2.3. Demand Side Drivers
3.3. Market Restraints
3.3.1. Regulatory concerns
3.3.2. Supply chain issues
3.3.3. Others
3.4. Product Launch Track & Trends
3.4.1. Key Product Launches in last three years
3.4.2. Type of launches
3.4.3. Regions and countries in focus
3.5. Trend Analysis- Impact on Time Line (2019-2029)
3.6. Forecast Factors – Relevance and Impact
3.7. Key Regulations and Claims (Region)
3.8. PESTLE Analysis
4. Global Phycocyanin Market Analysis Scenario
4.1. Market Size Analysis (2014-2018) and Forecast (2019-2029)
4.1.1. Market Value (US$ Mn) and Volume (Tons) and Y-o-Y Growth
4.1.2. Absolute $ Opportunity
4.2. Global Phycocyanin Market Scenario Forecast (Optimistic, Likely and Conservative Market Conditions)
4.2.1. Forecast Factors and Relevance of Impact
4.2.2. Regional Phycocyanin Market Business Performance Summary
5. Global Phycocyanin Market Analysis By Region
5.1. Introduction
5.1.1. Y-o-Y Growth Comparison By Region
5.1.2. Basis Point Share (BPS) Analysis By Region
5.2. Phycocyanin Market Size (US$ Mn) and Volume (MT) Analysis (2014-2018) & Forecast (2019-2029) By Region
5.2.1. North America
5.2.2. Latin America
5.2.3. Western Europe
5.2.4. Eastern Europe
5.2.5. Japan
5.2.6. Asia Pacific Excluding Japan
5.2.7. Middle East & Africa
5.3. Market Attractiveness Analysis By Region
6. Global Phycocyanin Market Analysis By Nature
6.1. Introduction
6.1.1. Y-o-Y Growth Comparison By Nature
6.1.2. Basis Point Share (BPS) Analysis By Nature
6.2. Phycocyanin Market Size (US$ Mn) and Volume (MT) Analysis (2014-2018) & Forecast (2019-2029) By Nature
6.2.1. Organic
6.2.2. Conventional
6.3. Market Attractiveness Analysis By Nature
7. Global Phycocyanin Market Analysis By Form
7.1. Introduction
7.1.1. Y-o-Y Growth Comparison By Form
7.1.2. Basis Point Share (BPS) Analysis By Form
7.2. Phycocyanin Market Size (US$ Mn) and Volume (MT) Analysis (2014-2018) & Forecast (2019-2029) By Form
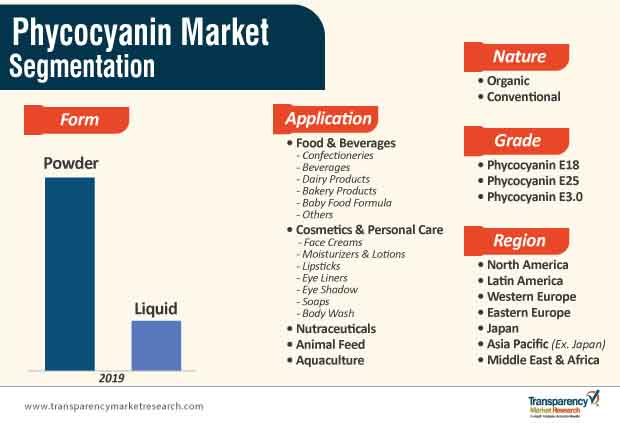
7.2.1. Powder
7.2.2. Liquid
7.3. Market Attractiveness Analysis By Form
8. Global Phycocyanin Market Analysis By Grade
8.1. Introduction
8.1.1. Y-o-Y Growth Comparison By Grade
8.1.2. Basis Point Share (BPS) Analysis By Grade
8.2. Phycocyanin Market Size (US$ Mn) and Volume (MT) Analysis (2014-2018) & Forecast (2019-2029) By Grade
8.2.1. Phycocyanin E18
8.2.2. Phycocyanin E25
8.2.3. Phycocyanin E3.0
8.3. Market Attractiveness Analysis By Grade
9. Global Phycocyanin Market Analysis and Forecast, By Application
9.1. Introduction
9.1.1. Basis Point Share (BPS) Analysis By Application
9.1.2. Y-o-Y Growth Projections By Application
9.2. Phycocyanin Market Size (US$ Mn) and Volume (MT) Analysis (2014-2018) & Forecast (2019-2029) By Application
9.2.1. Food & Beverages
9.2.1.1. Confectionery
9.2.1.2. Beverages
9.2.1.3. Dairy Products
9.2.1.4. Bakery Products
9.2.1.5. Baby Food Formula
9.2.1.6. Others
9.2.2. Cosmetics & Personal Care
9.2.2.1. Face Cream
9.2.2.2. Moisturizers & Lotions
9.2.2.3. Lipsticks
9.2.2.4. Eye Liners
9.2.2.5. Eye Shadow
9.2.2.6. Soap
9.2.2.7. Body Wash
9.2.3. Nutraceuticals
9.2.4. Animal Feed
9.2.5. Aquaculture
9.3. Market Attractiveness Analysis By Application
10. North America Phycocyanin Market Analysis and Forecast
10.1. Introduction
10.1.1. Basis Point Share (BPS) Analysis By Country
10.1.2. Y-o-Y Growth Projections By Country
10.2. Phycocyanin Market Size (Value (US$) and Volume (MT) Analysis (2014-2018) and Forecast (2019-2029)
10.2.1. By Country
10.2.1.1. U.S.
10.2.1.2. Canada
10.2.2. By Nature
10.2.3. By Form
10.2.4. By Grade
10.2.5. By Application
10.3. Market Attractiveness Analysis
10.3.1. By Country
10.3.2. By Nature
10.3.3. By Form
10.3.4. By Grade
10.3.5. By Application
10.4. Drivers and Restraints: Impact Analysis
11. Latin America Phycocyanin Market Analysis and Forecast
11.1. Introduction
11.1.1. Basis Point Share (BPS) Analysis By Country
11.1.2. Y-o-Y Growth Projections By Country
11.1.3. Key Regulations
11.2. Phycocyanin Market Size (Value (US$) and Volume (MT) Analysis (2014-2018) and Forecast (2019-2029)
11.2.1. By Country
11.2.1.1. Brazil
11.2.1.2. Mexico
11.2.1.3. Rest of Latin America
11.2.2. By Nature
11.2.3. By Form
11.2.4. By Grade
11.2.5. By Application
11.3. Market Attractiveness Analysis
11.3.1. By Country
11.3.2. By Nature
11.3.3. By Form
11.3.4. By Grade
11.3.5. By Application
11.4. Drivers and Restraints: Impact Analysis
12. Western Europe Phycocyanin Market Analysis and Forecast
12.1. Introduction
12.1.1. Basis Point Share (BPS) Analysis By Country
12.1.2. Y-o-Y Growth Projections By Country
12.1.3. Key Regulations
12.2. Phycocyanin Market Size (Value (US$) and Volume (MT) Analysis (2014-2018) and Forecast (2019-2029)
12.2.1. By Country
12.2.1.1. Germany
12.2.1.2. France
12.2.1.3. U.K.
12.2.1.4. Spain
12.2.1.5. Italy
12.2.1.6. Rest of Western Europe
12.2.2. By Nature
12.2.3. By Form
12.2.4. By Grade
12.2.5. By Application
12.3. Market Attractiveness Analysis
12.3.1. By Country
12.3.2. By Nature
12.3.3. By Form
12.3.4. By Grade
12.3.5. By Application
12.4. Drivers and Restraints: Impact Analysis
13. Eastern Europe Phycocyanin Market Analysis and Forecast
13.1. Introduction
13.1.1. Basis Point Share (BPS) Analysis By Country
13.1.2. Y-o-Y Growth Projections By Country
13.1.3. Key Regulations
13.2. Phycocyanin Market Size (Value (US$) and Volume (MT) Analysis (2014-2018) and Forecast (2019-2029)
13.2.1. By Country
13.2.1.1. Russia
13.2.1.2. Poland
13.2.1.3. Rest of Eastern Europe
13.2.2. By Nature
13.2.3. By Form
13.2.4. By Grade
13.2.5. By Application
13.3. Market Attractiveness Analysis
13.3.1. By Country
13.3.2. By Nature
13.3.3. By Form
13.3.4. By Grade
13.3.5. By Application
13.4. Drivers and Restraints: Impact Analysis
14. APEJ Phycocyanin Market Analysis and Forecast
14.1. Introduction
14.1.1. Basis Point Share (BPS) Analysis By Country
14.1.2. Y-o-Y Growth Projections By Country
14.1.3. Key Regulations
14.2. Phycocyanin Market Size (Value (US$) and Volume (MT) Analysis (2014-2018) and Forecast (2019-2029)
14.2.1. By Country
14.2.1.1. China
14.2.1.2. India
14.2.1.3. Australia & New Zealand
14.2.1.4. ASEAN
14.2.1.5. Rest of APEJ
14.2.2. By Nature
14.2.3. By Form
14.2.4. By Grade
14.2.5. By Application
14.3. Market Attractiveness Analysis
14.3.1. By Country
14.3.2. By Nature
14.3.3. By Form
14.3.4. By Grade
14.3.5. By Application
14.4. Drivers and Restraints: Impact Analysis
15. MEA Phycocyanin Market Analysis and Forecast
15.1. Introduction
15.1.1. Basis Point Share (BPS) Analysis By Country
15.1.2. Y-o-Y Growth Projections By Country
15.1.3. Key Regulations
15.2. Phycocyanin Market Size (Value (US$) and Volume (MT) Analysis (2014-2018) and Forecast (2019-2029)
15.2.1. By Country
15.2.1.1. GCC Countries
15.2.1.2. South Africa
15.2.1.3. Rest of MEA
15.2.2. By Nature
15.2.3. By Form
15.2.4. By Grade
15.2.5. By Application
15.3. Market Attractiveness Analysis
15.3.1. By Country
15.3.2. By Nature
15.3.3. By Form
15.3.4. By Grade
15.3.5. By Application
15.4. Drivers and Restraints: Impact Analysis
16. Japan Phycocyanin Market Analysis and Forecast
16.1. Introduction
16.1.1. Basis Point Share (BPS) Analysis By Country
16.1.2. Y-o-Y Growth Projections By Country
16.1.3. Key Regulations
16.2. Phycocyanin Market Size (Value (US$) and Volume (MT) Analysis (2014-2018) and Forecast (2019-2029)
16.2.1. By Nature
16.2.2. By Form
16.2.3. By Grade
16.2.4. By Application
16.3. Market Attractiveness Analysis
16.3.1. By Nature
16.3.2. By Form
16.3.3. By Grade
16.3.4. By Application
16.4. Drivers and Restraints: Impact Analysis
17. Competition Landscape (Manufacturers/Suppliers)
17.1. Competition Dashboard
17.2. Phycocyanin Market Structure
17.3. Market Players Intensity Mapping
17.4. Company Profiles
17.4.1. Chr. Hansen Holding A/S
17.4.1.1. Overview
17.4.1.2. Product Portfolio
17.4.1.3. Strategy Overview
17.4.1.3.1. Marketing Strategy
17.4.1.3.2. Culture Strategy
17.4.1.3.3. Channel Strategy
17.4.1.4. SWOT Analysis
17.4.1.5. Financial Analysis
17.4.1.6. Revenue Share
17.4.1.6.1. By Product Type
17.4.1.6.2. By Region
17.4.1.7. Analyst Comments
17.4.2. Cyanotech Corp.
17.4.2.1. Overview
17.4.2.2. Product Portfolio
17.4.2.3. Strategy Overview
17.4.2.3.1. Marketing Strategy
17.4.2.3.2. Culture Strategy
17.4.2.3.3. Channel Strategy
17.4.2.4. SWOT Analysis
17.4.2.5. Financial Analysis
17.4.2.6. Revenue Share
17.4.2.6.1. By Product Type
17.4.2.6.2. By Region
17.4.2.7. Analyst Comments
17.4.3. DDW Inc.
17.4.3.1. Overview
17.4.3.2. Product Portfolio
17.4.3.3. Strategy Overview
17.4.3.3.1. Marketing Strategy
17.4.3.3.2. Culture Strategy
17.4.3.3.3. Channel Strategy
17.4.3.4. SWOT Analysis
17.4.3.5. Financial Analysis
17.4.3.6. Revenue Share
17.4.3.6.1. By Product Type
17.4.3.6.2. By Region
17.4.3.7. Analyst Comments
17.4.4. DIC Corporation
17.4.4.1. Overview
17.4.4.2. Product Portfolio
17.4.4.3. Strategy Overview
17.4.4.3.1. Marketing Strategy
17.4.4.3.2. Culture Strategy
17.4.4.3.3. Channel Strategy
17.4.4.4. SWOT Analysis
17.4.4.5. Financial Analysis
17.4.4.6. Revenue Share
17.4.4.6.1. By Product Type
17.4.4.6.2. By Region
17.4.4.7. Analyst Comments
17.4.5. Dongtai City Spirulina Bio-Engineering Co., Ltd.
17.4.5.1. Overview
17.4.5.2. Product Portfolio
17.4.5.3. Strategy Overview
17.4.5.3.1. Marketing Strategy
17.4.5.3.2. Culture Strategy
17.4.5.3.3. Channel Strategy
17.4.5.4. SWOT Analysis
17.4.5.5. Financial Analysis
17.4.5.6. Revenue Share
17.4.5.6.1. By Product Type
17.4.5.6.2. By Region
17.4.5.7. Analyst Comments
17.4.6. Fuqing King Dnarmsa Spirulina Co., Ltd.
17.4.6.1. Overview
17.4.6.2. Product Portfolio
17.4.6.3. Strategy Overview
17.4.6.3.1. Marketing Strategy
17.4.6.3.2. Culture Strategy
17.4.6.3.3. Channel Strategy
17.4.6.4. SWOT Analysis
17.4.6.5. Financial Analysis
17.4.6.6. Revenue Share
17.4.6.6.1. By Product Type
17.4.6.6.2. By Region
17.4.6.7. Analyst Comments
17.4.7. GNT Holding B.V.
17.4.7.1. Overview
17.4.7.2. Product Portfolio
17.4.7.3. Strategy Overview
17.4.7.3.1. Marketing Strategy
17.4.7.3.2. Culture Strategy
17.4.7.3.3. Channel Strategy
17.4.7.4. SWOT Analysis
17.4.7.5. Financial Analysis
17.4.7.6. Revenue Share
17.4.7.6.1. By Product Type
17.4.7.6.2. By Region
17.4.7.7. Analyst Comments
17.4.8. Sensient Technologies Corp.
17.4.8.1. Overview
17.4.8.2. Product Portfolio
17.4.8.3. Strategy Overview
17.4.8.3.1. Marketing Strategy
17.4.8.3.2. Culture Strategy
17.4.8.3.3. Channel Strategy
17.4.8.4. SWOT Analysis
17.4.8.5. Financial Analysis
17.4.8.6. Revenue Share
17.4.8.6.1. By Product Type
17.4.8.6.2. By Region
17.4.8.7. Analyst Comments
17.4.9. Parry Nutraceuticals Limited
17.4.9.1. Overview
17.4.9.2. Product Portfolio
17.4.9.3. Strategy Overview
17.4.9.3.1. Marketing Strategy
17.4.9.3.2. Culture Strategy
17.4.9.3.3. Channel Strategy
17.4.9.4. SWOT Analysis
17.4.9.5. Financial Analysis
17.4.9.6. Revenue Share
17.4.9.6.1. By Product Type
17.4.9.6.2. By Region
17.4.9.7. Analyst Comments
17.4.10. Döhler GmbH
17.4.10.1. Overview
17.4.10.2. Product Portfolio
17.4.10.3. Strategy Overview
17.4.10.3.1. Marketing Strategy
17.4.10.3.2. Culture Strategy
17.4.10.3.3. Channel Strategy
17.4.10.4. SWOT Analysis
17.4.10.5. Financial Analysis
17.4.10.6. Revenue Share
17.4.10.6.1. By Product Type
17.4.10.6.2. By Region
17.4.10.7. Analyst Comments
17.4.11. Naturex S.A.
17.4.11.1. Overview
17.4.11.2. Product Portfolio
17.4.11.3. Strategy Overview
17.4.11.3.1. Marketing Strategy
17.4.11.3.2. Culture Strategy
17.4.11.3.3. Channel Strategy
17.4.11.4. SWOT Analysis
17.4.11.5. Financial Analysis
17.4.11.6. Revenue Share
17.4.11.6.1. By Product Type
17.4.11.6.2. By Region
17.4.11.7. Analyst Comments
17.4.12. Naturalin Bio-Resources Co., Ltd.
17.4.12.1. Overview
17.4.12.2. Product Portfolio
17.4.12.3. Strategy Overview
17.4.12.3.1. Marketing Strategy
17.4.12.3.2. Culture Strategy
17.4.12.3.3. Channel Strategy
17.4.12.4. SWOT Analysis
17.4.12.5. Financial Analysis
17.4.12.6. Revenue Share
17.4.12.6.1. By Product Type
17.4.12.6.2. By Region
17.4.12.7. Analyst Comments
17.4.13. Far East Bio-Tec Co., Ltd.
17.4.13.1. Overview
17.4.13.2. Product Portfolio
17.4.13.3. Strategy Overview
17.4.13.3.1. Marketing Strategy
17.4.13.3.2. Culture Strategy
17.4.13.3.3. Channel Strategy
17.4.13.4. SWOT Analysis
17.4.13.5. Financial Analysis
17.4.13.6. Revenue Share
17.4.13.6.1. By Product Type
17.4.13.6.2. By Region
17.4.13.7. Analyst Comments
17.4.14. Fraken Biochem Co., Ltd.
17.4.14.1. Overview
17.4.14.2. Product Portfolio
17.4.14.3. Strategy Overview
17.4.14.3.1. Marketing Strategy
17.4.14.3.2. Culture Strategy
17.4.14.3.3. Channel Strategy
17.4.14.4. SWOT Analysis
17.4.14.5. Financial Analysis
17.4.14.6. Revenue Share
17.4.14.6.1. By Product Type
17.4.14.6.2. By Region
17.4.14.7. Analyst Comments
17.4.15. Others (On Request)
18. Assumptions & Acronyms Used
19. Research & Methodology
List of Table
Table 1: Global Phycocyanin Market Value (US$ Mn) Forecast, By Region, 2019–2029
Table 2: Global Phycocyanin Market Volume (MT) Forecast, By Region, 2019–2029
Table 3: Global Phycocyanin Market Value (US$ Mn), By Nature, 2019–2029
Table 4: Global Phycocyanin Market Volume (MT), By Nature, 2019–2029
Table 5: Global Phycocyanin Market Value (US$ Mn), By Form, 2019–2029
Table 6: Global Phycocyanin Market Volume (MT), By Form, 2019–2029
Table 7: Global Phycocyanin Market Value (US$ Mn), By Grade, 2019–2029
Table 8: Global Phycocyanin Market Volume (MT), By Grade, 2019–2029
Table 9: Global Phycocyanin Market Value (US$ Mn), By Application, 2019–2029
Table 10: Global Phycocyanin Market Volume (MT), By Application, 2019–2029
Table 11: North America Phycocyanin Market Value (US$ Mn), By Country, 2019–2029
Table 12: North America Phycocyanin Market Volume (MT), By Country, 2019–2029
Table 13: North America Phycocyanin Market Value (US$ Mn), By Nature, 2019–2029
Table 14: North America Phycocyanin Market Volume (MT), By Nature, 2019–2029
Table 15: North America Phycocyanin Market Value (US$ Mn), By Form, 2019–2029
Table 16: North America Phycocyanin Market Volume (MT), By Form, 2019–2029
Table 17: North America Phycocyanin Market Value (US$ Mn), By Grade, 2019–2029
Table 18: North America Phycocyanin Market Volume (MT), By Grade, 2019–2029
Table 19: North America Phycocyanin Market Value (US$ Mn), By Application, 2019–2029
Table 20: North America Phycocyanin Market Volume (US$ Mn), By Application, 2019–2029
Table 21: Latin America Phycocyanin Market Value (US$ Mn), By Country, 2019–2029
Table 22: Latin America Phycocyanin Market Volume (MT), By Country, 2019–2029
Table 23: Latin America Phycocyanin Market Value (US$ Mn), By Nature, 2019–2029
Table 24: Latin America Phycocyanin Market Volume (MT), By Nature, 2019–2029
Table 25: Latin America Phycocyanin Market Value (US$ Mn), By Form, 2019–2029
Table 26: Latin America Phycocyanin Market Volume (MT), By Form, 2019–2029
Table 27: Latin America Phycocyanin Market Value (US$ Mn), By Grade, 2019–2029
Table 28: Latin America Phycocyanin Market Volume (MT), By Grade, 2019–2029
Table 29: Latin America Phycocyanin Market Value (US$ Mn), By Application, 2019–2029
Table 30: Latin America Phycocyanin Market Volume (US$ Mn), By Application, 2019–2029
Table 31: Western Europe Phycocyanin Market Value (US$ Mn) Forecast, By Country, 2019–2029
Table 32: Western Europe Phycocyanin Market Volume (MT) Forecast, By Country, 2019–2029
Table 33: Western Europe Phycocyanin Market Value (US$ Mn), By Nature, 2019–2029
Table 34: Western Europe Phycocyanin Market Volume (MT), By Nature, 2019–2029
Table 35: Western Europe Phycocyanin Market Value (US$ Mn), By Form, 2019–2029
Table 36: Western Europe Phycocyanin Market Volume (MT), By Form, 2019–2029
Table 37: Western Europe Phycocyanin Market Value (US$ Mn), By Grade, 2019–2029
Table 38: Western Europe Phycocyanin Market Volume (MT), By Grade, 2019–2029
Table 39: Western Europe Phycocyanin Market Value (US$ Mn), By Application, 2019–2029
Table 40: Western Europe Phycocyanin Market Volume (US$ Mn), By Application, 2019–2029
Table 41: Eastern Europe Phycocyanin Market Value (US$ Mn), By Country, 2019–2029
Table 42: Eastern Europe Phycocyanin Market Volume (MT), By Country, 2019–2029
Table 43: Eastern Europe Phycocyanin Market Value (US$ Mn), By Nature, 2019–2029
Table 44: Eastern Europe Phycocyanin Market Volume (MT), By Nature, 2019–2029
Table 45: Eastern Europe Phycocyanin Market Value (US$ Mn), By Form, 2019–2029
Table 46: Eastern Europe Phycocyanin Market Volume (MT), By Form, 2019–2029
Table 47: Eastern Europe Phycocyanin Market Value (US$ Mn), By Grade, 2019–2029
Table 48: Eastern Europe Phycocyanin Market Volume (MT), By Grade, 2019–2029
Table 49: Eastern Europe Phycocyanin Market Value (US$ Mn), By Application, 2019–2029
Table 50: Eastern Europe Phycocyanin Market Volume (US$ Mn), By Application, 2019–2029
Table 51: APEJ Phycocyanin Market Value (US$ Mn) Forecast, By Country, 2019–2029
Table 52: APEJ Phycocyanin Market Volume (MT) Forecast, By Country, 2019–2029
Table 53: APEJ Phycocyanin Market Value (US$ Mn), By Nature, 2019–2029
Table 54: APEJ Phycocyanin Market Volume (MT), By Nature, 2019–2029
Table 55: APEJ Phycocyanin Market Value (US$ Mn), By Form, 2019–2029
Table 56: APEJ Phycocyanin Market Volume (MT), By Form, 2019–2029
Table 57: APEJ Phycocyanin Market Value (US$ Mn), By Grade, 2019–2029
Table 58: APEJ Phycocyanin Market Volume (MT), By Grade, 2019–2029
Table 59: APEJ Phycocyanin Market Value (US$ Mn), By Application, 2019–2029
Table 60: APEJ Phycocyanin Market Volume (US$ Mn), By Application, 2019–2029
Table 61: MEA Phycocyanin Market Value (US$ Mn) Forecast, By Country, 2019–2029
Table 62: MEA Phycocyanin Market Volume (MT) Forecast, By Country, 2019–2029
Table 63: MEA Phycocyanin Market Value (US$ Mn), By Nature, 2019–2029
Table 64: MEA Phycocyanin Market Volume (MT), By Nature, 2019–2029
Table 65: MEA Phycocyanin Market Value (US$ Mn), By Form, 2019–2029
Table 66: MEA Phycocyanin Market Volume (MT), By Form, 2019–2029
Table 67: MEA Phycocyanin Market Value (US$ Mn), By Grade, 2019–2029
Table 68: MEA Phycocyanin Market Volume (MT), By Grade, 2019–2029
Table 69: MEA Phycocyanin Market Value (US$ Mn), By Application, 2019–2029
Table 70: MEA Phycocyanin Market Volume (US$ Mn), By Application, 2019–2029
Table 71: Japan Phycocyanin Market Value (US$ Mn), By Nature, 2019–2029
Table 72: Japan Phycocyanin Market Volume (MT), By Nature, 2019–2029
Table 73: Japan Phycocyanin Market Value (US$ Mn), By Form, 2019–2029
Table 74: Japan Phycocyanin Market Volume (MT), By Form, 2019–2029
Table 75: Japan Phycocyanin Market Value (US$ Mn), By Grade, 2019–2029
Table 76: Japan Phycocyanin Market Volume (MT), By Grade, 2019–2029
Table 77: Japan Phycocyanin Market Value (US$ Mn), By Application, 2019–2029
Table 78: Japan Phycocyanin Market Volume (US$ Mn), By Application, 2019–2029
List of Figure
Figure 1: Global Phycocyanin Extract Market Value (US$ Mn) and Volume (MT) Forecast, 2019–2029
Figure 2: Global Phycocyanin Extract Market Absolute $ Opportunity (US$ Mn), 2019–2029
Figure 3: Global Phycocyanin Market Value Share (%) & BPS Analysis, by Region, 2019 & 2029
Figure 4: Global Phycocyanin Market Value Y-o-Y Growth (%), by Region, 2019–2029
Figure 5: Global Phycocyanin Market Attractiveness, By Region, 2019–2029
Figure 6: Global Phycocyanin Market Value Share (%) & BPS Analysis, by Nature, 2019 & 2029
Figure 7: Global Phycocyanin Market Value Y-o-Y Growth (%), by Nature, 2019–2029
Figure 8: Global Phycocyanin Market Attractiveness, By Nature, 2019–2029
Figure 9: Global Phycocyanin Market Value Share (%) & BPS Analysis, by Form, 2019 & 2029
Figure 10: Global Phycocyanin Market Value Y-o-Y Growth (%), by Form, 2019–2029
Figure 11: Global Phycocyanin Market Attractiveness, By Form, 2019–2029
Figure 12: Global Phycocyanin Market Value Share (%) & BPS Analysis, by Grade, 2019 & 2029
Figure 13: Global Phycocyanin Market Value Y-o-Y Growth (%), by Grade, 2019–2029
Figure 14: Global Phycocyanin Market Attractiveness, By Grade, 2019–2029
Figure 15: Global Phycocyanin Market Value Share (%) & BPS Analysis, by Application, 2019 & 2029
Figure 16: Global Phycocyanin Market Value Y-o-Y Growth (%), by Application, 2019–2029
Figure 17: Global Phycocyanin Market Attractiveness, By Application, 2019–2029
Figure 18: North America Phycocyanin Market Value (US$ Mn) and Volume (MT) Forecast, 2019–2029
Figure 19: North America Phycocyanin Market Absolute $ Opportunity (US$ Mn), 2019–2029
Figure 20: North America Phycocyanin Market Value Share (%) & BPS Analysis, by Country, 2019 & 2029
Figure 21: North America Phycocyanin Market Value Y-o-Y Growth (%), By Country, 2019–2029
Figure 22: North America Market Attractiveness Index, By Country, 2019–2029
Figure 23: North America Phycocyanin Market Value Share (%) & BPS Analysis, by Nature, 2019 & 2029
Figure 24: North America Phycocyanin Market Value Y-o-Y Growth (%), by Nature, 2019–2029
Figure 25: North America Phycocyanin Market Attractiveness, By Nature, 2019–2029
Figure 26: North America Phycocyanin Market Value Share (%) & BPS Analysis, by Form, 2019 & 2029
Figure 27: North America Phycocyanin Market Value Y-o-Y Growth (%), by Form, 2019–2029
Figure 28: North America Phycocyanin Market Attractiveness, By Form, 2019–2029
Figure 29: North America Phycocyanin Market Value Share (%) & BPS Analysis, by Grade, 2019 & 2029
Figure 30: North America Phycocyanin Market Value Y-o-Y Growth (%), by Grade, 2019–2029
Figure 31: North America Phycocyanin Market Attractiveness, By Grade, 2019–2029
Figure 32: North America Phycocyanin Market Value Share (%) & BPS Analysis, by Application, 2019 & 2029
Figure 33: North America Phycocyanin Market Value Y-o-Y Growth (%), by Application, 2019–2029
Figure 34: North America Phycocyanin Market Attractiveness, By Application, 2019–2029
Figure 35: Latin America Phycocyanin Market Value (US$ Mn) and Volume (MT) Forecast, 2019–2029
Figure 36: Latin America Phycocyanin Market Absolute $ Opportunity (US$ Mn), 2019–2029
Figure 37: Latin America Phycocyanin Market Value Share (%) & BPS Analysis, by Country, 2019 & 2029
Figure 38: Latin America Phycocyanin Market Value Y-o-Y Growth (%), By Country, 2019–2029
Figure 39: Latin America Market Attractiveness Index, By Country, 2019–2029
Figure 40: Latin America Phycocyanin Market Value Share (%) & BPS Analysis, by Nature, 2019 & 2029
Figure 41: Latin America Phycocyanin Market Value Y-o-Y Growth (%), by Nature, 2019–2029
Figure 42: Latin America Phycocyanin Market Attractiveness, By Nature, 2019–2029
Figure 43: Latin America Phycocyanin Market Value Share (%) & BPS Analysis, by Form, 2019 & 2029
Figure 44: Latin America Phycocyanin Market Value Y-o-Y Growth (%), by Form, 2019–2029
Figure 45: Latin America Phycocyanin Market Attractiveness, By Form, 2019–2029
Figure 46: Latin America Phycocyanin Market Value Share (%) & BPS Analysis, by Grade, 2019 & 2029
Figure 47: Latin America Phycocyanin Market Value Y-o-Y Growth (%), by Grade, 2019–2029
Figure 48: Latin America Phycocyanin Market Attractiveness, By Grade, 2019–2029
Figure 49: Latin America Phycocyanin Market Value Share (%) & BPS Analysis, by Application, 2019 & 2029
Figure 50: Latin America Phycocyanin Market Value Y-o-Y Growth (%), by Application, 2019–2029
Figure 51: Latin America Phycocyanin Market Attractiveness, By Application, 2019–2029
Figure 52: Western Europe Phycocyanin Market Value (US$ Mn) and Volume (MT) Forecast, 2019–2029
Figure 53: Western Europe Phycocyanin Market Absolute $ Opportunity (US$ Mn), 2019–2029
Figure 54: Western Europe Phycocyanin Market Value Share (%) & BPS Analysis, by Country, 2019 & 2029
Figure 55: Western Europe Phycocyanin Market Value Y-o-Y Growth (%), By Country, 2019–2029
Figure 56: Western Europe Market Attractiveness Index, By Country, 2019–2029
Figure 57: Western Europe Phycocyanin Market Value Share (%) & BPS Analysis, by Nature, 2019 & 2029
Figure 58: Western Europe Phycocyanin Market Value Y-o-Y Growth (%), by Nature, 2019–2029
Figure 59: Western Europe Phycocyanin Market Attractiveness, By Nature, 2019–2029
Figure 60: Western Europe Phycocyanin Market Value Share (%) & BPS Analysis, by Form, 2019 & 2029
Figure 61: Western Europe Phycocyanin Market Value Y-o-Y Growth (%), by Form, 2019–2029
Figure 62: Western Europe Phycocyanin Market Attractiveness, By Form, 2019–2029
Figure 63: Western Europe Phycocyanin Market Value Share (%) & BPS Analysis, by Grade, 2019 & 2029
Figure 64: Western Europe Phycocyanin Market Value Y-o-Y Growth (%), by Grade, 2019–2029
Figure 65: Western Europe Phycocyanin Market Attractiveness, By Grade, 2019–2029
Figure 66: Western Europe Phycocyanin Market Value Share (%) & BPS Analysis, by Application, 2019 & 2029
Figure 67: Western Europe Phycocyanin Market Value Y-o-Y Growth (%), by Application, 2019–2029
Figure 68: Western Europe Phycocyanin Market Attractiveness, By Application, 2019–2029
Figure 69: Eastern Europe Phycocyanin Market Value (US$ Mn) and Volume (MT) Forecast, 2019–2029
Figure 70: Eastern Europe Phycocyanin Market Absolute $ Opportunity (US$ Mn), 2019–2029
Figure 71: Eastern Europe Phycocyanin Market Value Share (%) & BPS Analysis, by Country, 2019 & 2029
Figure 72: Eastern Europe Phycocyanin Market Value Y-o-Y Growth (%), By Country, 2019–2029
Figure 73: Eastern Europe Market Attractiveness Index, By Country, 2019–2029
Figure 74: Eastern Europe Phycocyanin Market Value Share (%) & BPS Analysis, by Nature, 2019 & 2029
Figure 75: Eastern Europe Phycocyanin Market Value Y-o-Y Growth (%), by Nature, 2019–2029
Figure 76: Eastern Europe Phycocyanin Market Attractiveness, By Nature, 2019–2029
Figure 77: Eastern Europe Phycocyanin Market Value Share (%) & BPS Analysis, by Form, 2019 & 2029
Figure 78: Eastern Europe Phycocyanin Market Value Y-o-Y Growth (%), by Form, 2019–2029
Figure 79: Eastern Europe Phycocyanin Market Attractiveness, By Form, 2019–2029
Figure 80: Eastern Europe Phycocyanin Market Value Share (%) & BPS Analysis, by Grade, 2019 & 2029
Figure 81: Eastern Europe Phycocyanin Market Value Y-o-Y Growth (%), by Grade, 2019–2029
Figure 82: Eastern Europe Phycocyanin Market Attractiveness, By Grade, 2019–2029
Figure 83: Eastern Europe Phycocyanin Market Value Share (%) & BPS Analysis, by Application, 2019 & 2029
Figure 84: Eastern Europe Phycocyanin Market Value Y-o-Y Growth (%), by Application, 2019–2029
Figure 85: Eastern Europe Phycocyanin Market Attractiveness, By Application, 2019–2029
Figure 86: APEJ Phycocyanin Market Value (US$ Mn) and Volume (MT) Forecast, 2019–2029
Figure 87: APEJ Phycocyanin Market Absolute $ Opportunity (US$ Mn), 2019–2029
Figure 88: APEJ Phycocyanin Market Value Share (%) & BPS Analysis, by Country, 2019 & 2029
Figure 89: APEJ Phycocyanin Market Value Y-o-Y Growth (%), By Country, 2019–2029
Figure 90: APEJ Market Attractiveness Index, By Country, 2019–2029
Figure 91: APEJ Phycocyanin Market Value Share (%) & BPS Analysis, by Nature, 2019 & 2029
Figure 92: APEJ Phycocyanin Market Value Y-o-Y Growth (%), by Nature, 2019–2029
Figure 93: APEJ Phycocyanin Market Attractiveness, By Nature, 2019–2029
Figure 94: APEJ Phycocyanin Market Value Share (%) & BPS Analysis, by Form, 2019 & 2029
Figure 95: APEJ Phycocyanin Market Value Y-o-Y Growth (%), by Form, 2019–2029
Figure 96: APEJ Phycocyanin Market Attractiveness, By Form, 2019–2029
Figure 97: APEJ Phycocyanin Market Value Share (%) & BPS Analysis, by Grade, 2019 & 2029
Figure 98: APEJ Phycocyanin Market Value Y-o-Y Growth (%), by Grade, 2019–2029
Figure 99: APEJ Phycocyanin Market Attractiveness, By Grade, 2019–2029
Figure 100: APEJ Phycocyanin Market Value Share (%) & BPS Analysis, by Application, 2019 & 2029
Figure 101: APEJ Phycocyanin Market Value Y-o-Y Growth (%), by Application, 2019–2029
Figure 102: APEJ Phycocyanin Market Attractiveness, By Application, 2019–2029
Figure 103: MEA Phycocyanin Market Value (US$ Mn) and Volume (MT) Forecast, 2019–2029
Figure 104: MEA Phycocyanin Market Absolute $ Opportunity (US$ Mn), 2019–2029
Figure 105: MEA Phycocyanin Market Value Share (%) & BPS Analysis, by Country, 2019 & 2029
Figure 106: MEA Phycocyanin Market Value Y-o-Y Growth (%), By Country, 2019–2029
Figure 107: MEA Market Attractiveness Index, By Country, 2019–2029
Figure 108: MEA Phycocyanin Market Value Share (%) & BPS Analysis, by Nature, 2019 & 2029
Figure 199: MEA Phycocyanin Market Value Y-o-Y Growth (%), by Nature, 2019–2029
Figure 110: MEA Phycocyanin Market Attractiveness, By Nature, 2019–2029
Figure 111: MEA Phycocyanin Market Value Share (%) & BPS Analysis, by Form, 2019 & 2029
Figure 112: MEA Phycocyanin Market Value Y-o-Y Growth (%), by Form, 2019–2029
Figure 113: MEA Phycocyanin Market Attractiveness, By Form, 2019–2029
Figure 114: MEA Phycocyanin Market Value Share (%) & BPS Analysis, by Grade, 2019 & 2029
Figure 115: MEA Phycocyanin Market Value Y-o-Y Growth (%), by Grade, 2019–2029
Figure 116: MEA Phycocyanin Market Attractiveness, By Grade, 2019–2029
Figure 117: MEA Phycocyanin Market Value Share (%) & BPS Analysis, by Application, 2019 & 2029
Figure 118: MEA Phycocyanin Market Value Y-o-Y Growth (%), by Application, 2019–2029
Figure 119: MEA Phycocyanin Market Attractiveness, By Application, 2019–2029
Figure 120: Japan Phycocyanin Market Value (US$ Mn) and Volume (MT) Forecast, 2019–2029
Figure 121: Japan Phycocyanin Market Absolute $ Opportunity (US$ Mn), 2019–2029
Figure 122: Japan Phycocyanin Market Value Share (%) & BPS Analysis, by Nature, 2019 & 2029
Figure 123: Japan Phycocyanin Market Value Y-o-Y Growth (%), by Nature, 2019–2029
Figure 124: Japan Phycocyanin Market Attractiveness, By Nature, 2019–2029
Figure 125: Japan Phycocyanin Market Value Share (%) & BPS Analysis, by Form, 2019 & 2029
Figure 126: Japan Phycocyanin Market Value Y-o-Y Growth (%), by Form, 2019–2029
Figure 127: Japan Phycocyanin Market Attractiveness, By Form, 2019–2029
Figure 128: Japan Phycocyanin Market Value Share (%) & BPS Analysis, by Grade, 2019 & 2029
Figure 129: Japan Phycocyanin Market Value Y-o-Y Growth (%), by Grade, 2019–2029
Figure 130: Japan Phycocyanin Market Attractiveness, By Grade, 2019–2029
Figure 131: Japan Phycocyanin Market Value Share (%) & BPS Analysis, by Application, 2019 & 2029
Figure 132: Japan Phycocyanin Market Value Y-o-Y Growth (%), by Application, 2019–2029
Figure 133: Japan Phycocyanin Market Attractiveness, By Application, 2019–2029
Copyright © Transparency Market Research, Inc. All Rights reserved
Trust Online

Phycocyanin Market Trends, 2019-2029