
Reports
Reports
Organic Soups Market Digs Deep for Natural Ingredients
Organic soups market is likely to experience a healthy growth, thanks to a growing awareness about unnatural lifestyle and its extreme side-effects. Many food items today like poultry chicken are brought to the dinner table in a nick-of-time with injected hormones and other chemical substances to promote growth. Naturally available substances like fruits are not immune to this trend. Coloring, flavoring, and unnatural growth is also common among fruits. Additionally, it is not entirely possible to reverse this trend. Commercial agricultural spaces can only bring a mass-produced food products at cheap price. Hence, the growing awareness about these trends are resulting in increased opportunity for players in the organic soups market.
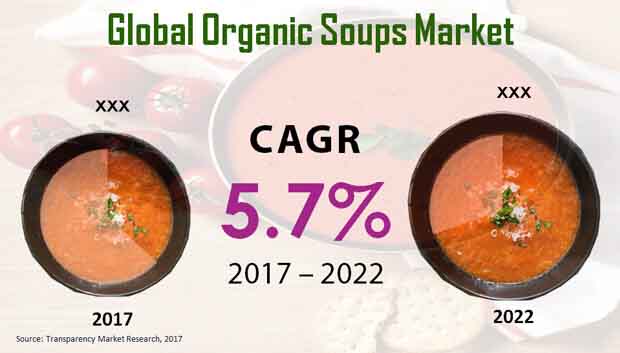
The global organic soups market was valued at US$1,895.5 Mn in 2017. It is predicted to reach US$2,497.8 mn by 2022 end. Due to profound changes in the dynamics of commercial agriculture, thanks to growing demand for organic food, the market is estimated to expand at a CAGR of 5.7% between 2017–2022.
Wet Soup to Drive Growth for the Organics Soups Market
The organic soups market includes main product segments such as ready to serve wet soups, soup pre-mixes, and condensed wet soups. The serve wet soup accounted for 32.5% share of the total revenues in the organic soups market in 2017. The share was valued at US$ 615.1 mn. The segment is expected to rise, thanks to the growing demand for ready-to-eat foods. The segment is predicted to rise at 6.1% CAGR to US$ 615.1 mn over the forecast period. The segment is expected to register an astounding US$ 42.4 Mn year-over-year growth during 2017-2022.
The relatively higher costs of products in the organic soups market are still keeping them from bursting onto mainstream. However, this is expected to bring more consolidation in the near future and result in more quality products in the long run. Additionally, packaging in the organic soups market makes way for facilitating easy storage and convenience in cooking. Furthermore, key players in the organic soup market are also working on increased quality, flavor, and inclusion of nutrients to create more opportunities in the organic soups market.
Growing Demand for Read-to-eat Soups Propels the Organic Soups Market
Growing sedentary and busy lifestyle are leading to an increased attraction of healthy lifestyle. Additionally, soups are a low-cost starter on the menu, which can also be consumed during short breaks, to improve daily nutrient intake. Furthermore, ready-to-eat products like steaks and other various fast food items are on the rise. This is expected to lead to a major growth in the organic soups market.
The rising demand for food products in emerging economies of Asia Pacific are also expected to drive revenue growth for the organic soups market. Countries like India and China are witnessing a major rise in food production, demand for ready-to-eat products, and growing disposables income. The growing private infrastructure such as retail chains, and e-commerce in Asia Pacific are also expected to create new opportunities for all players in the organic soups market.
Multiple Health Benefits to Drive Demand in the Global Organic Soups Market
Over the forecast timeframe, the global organic soup market is anticipated to benefit from increasing demand for convenience foods products. In addition to that, rising consumption of various meal replacements by people seeking safe food alternatives is likely to augur well for the market. Organic soups are made from organically grown produce and are processed without any synthetic additives, which is likely to make them a healthier alternative to traditional soup.
Due to many health benefits, such as a reduced risk of chronic diseases and allergies, the global organic soups market is predicted to expand significantly during the forecast timeframe. Intake of genetically modified or GM ingredients in soup could cause a variety of health problems, such as digestive problems and food poisoning. As a result, during the period of evaluation, these factors are expected to push consumers toward organic soup. Furthermore, trends in changing lifestyle and urbanization have prompted customers to shift to convenience foods products, wholesome meal options, and ready-to-drink beverages. These factors are likely to foster growth of the global organic soups market in the years to come.
Growth of the Market to be Influenced by Increased Awareness about Unhealthy Lifestyle
Because of an increasing awareness of unhealthy lifestyles and its adverse side effects, the organic soups market is expected to expand at a healthy rate. Many foods products, such as chicken and poultry items, are now presented on the dinner table with injected chemical substances and hormones to encourage growth. This trend extends to even naturally occurring substances such as fruits. These fruits are also prone to flavoring, coloring, and abnormal growth. Furthermore, reversing this trend is also not completely possible. Commercial farm spaces can only provide low-cost, mass-produced meals. As a result of greater understanding of these trends, players in the global organic soups market come with more opportunities.
1. Global Organic Soups Market - Executive Summary
2. Global Organic Soups Market Overview
2.1. Introduction
2.1.1. Global Organic Soups Market Taxonomy
2.1.2. Global Organic Soups Market Definition
2.2. Global Organic Soups Market Size (US$ Mn) and Forecast, 2012-2022
2.2.1. Global Organic Soups Market Y-o-Y Growth
2.3. Global Organic Soups Market Dynamics
2.4. Supply Chain
2.5. Pricing Analysis
2.6. Market Opportunities
2.7. Product Innovations
2.8. Trade Analysis
2.9. Key Participants in the Market By Region
3. Global Organic Soups Market Analysis and Forecast By Product Type
3.1. Global Organic Soups Market Size and Forecast By Product Type, 2012-2022
3.1.1. Soup Pre-mixes Market Size and Forecast, 2012-2022
3.1.1.1. Revenue (US$ Mn) Comparison, By Region
3.1.1.2. Market Share Comparison, By Region
3.1.1.3. Y-o-Y growth Comparison, By Region
3.1.2. Ready to serve wet soup Market Size and Forecast, 2012-2022
3.1.2.1. Revenue (US$ Mn) Comparison, By Region
3.1.2.2. Market Share Comparison, By Region
3.1.2.3. Y-o-Y growth Comparison, By Region
3.1.3. Condensed wet soup Market Size and Forecast, 2012-2022
3.1.3.1. Revenue (US$ Mn) Comparison, By Region
3.1.3.2. Market Share Comparison, By Region
3.1.3.3. Y-o-Y growth Comparison, By Region
3.1.4. Other Organic Soup Type Market Size and Forecast, 2012-2022
3.1.4.1. Revenue (US$ Mn) Comparison, By Region
3.1.4.2. Market Share Comparison, By Region
3.1.4.3. Y-o-Y growth Comparison, By Region
4. Global Organic Soups Market Analysis and Forecast By Ingredient
4.1. Global Organic Soups Market Size and Forecast By Ingredient, 2012-2022
4.1.1. Tomato Organic Soups Market Size and Forecast, 2012-2022
4.1.1.1. Revenue (US$ Mn) Comparison, By Region
4.1.1.2. Market Share Comparison, By Region
4.1.1.3. Y-o-Y growth Comparison, By Region
4.1.2. Beans Organic Soups Market Size and Forecast, 2012-2022
4.1.2.1. Revenue (US$ Mn) Comparison, By Region
4.1.2.2. Market Share Comparison, By Region
4.1.2.3. Y-o-Y growth Comparison, By Region
4.1.3. Chicken Organic Soup Market Size and Forecast, 2012-2022
4.1.3.1. Revenue (US$ Mn) Comparison, By Region
4.1.3.2. Market Share Comparison, By Region
4.1.3.3. Y-o-Y growth Comparison, By Region
4.1.4. Beef Organic Soup Market Size and Forecast, 2012-2022
4.1.4.1. Revenue (US$ Mn) Comparison, By Region
4.1.4.2. Market Share Comparison, By Region
4.1.4.3. Y-o-Y growth Comparison, By Region
4.1.5. Artichokes Organic Soups Market Size and Forecast, 2012-2022
4.1.5.1. Revenue (US$ Mn) Comparison, By Region
4.1.5.2. Market Share Comparison, By Region
4.1.5.3. Y-o-Y growth Comparison, By Region
4.1.6. Mixed Vegetables Organic Soup Market Size and Forecast, 2012-2022
4.1.6.1. Revenue (US$ Mn) Comparison, By Region
4.1.6.2. Market Share Comparison, By Region
4.1.6.3. Y-o-Y growth Comparison, By Region
4.1.7. Other Ingredients Organic Soup Market Size and Forecast, 2012-2022
4.1.7.1. Revenue (US$ Mn) Comparison, By Region
4.1.7.2. Market Share Comparison, By Region
4.1.7.3. Y-o-Y growth Comparison, By Region
5. Global Organic Soups Market Analysis and Forecast By Sales Channel
5.1. Global Organic Soups Market Size and Forecast By Sales Channel, 2012-2022
5.1.1. HORECA Sales Channel Market Size and Forecast, 2012-2022
5.1.1.1. Revenue (US$ Mn) Comparison, By Region
5.1.1.2. Market Share Comparison, By Region
5.1.1.3. Y-o-Y growth Comparison, By Region
5.1.2. Modern Trade Sales Channel Market Size and Forecast, 2012-2022
5.1.2.1. Revenue (US$ Mn) Comparison, By Region
5.1.2.2. Market Share Comparison, By Region
5.1.2.3. Y-o-Y growth Comparison, By Region
5.1.3. Convenience Stores Sales Channel Market Size and Forecast, 2012-2022
5.1.3.1. Revenue (US$ Mn) Comparison, By Region
5.1.3.2. Market Share Comparison, By Region
5.1.3.3. Y-o-Y growth Comparison, By Region
5.1.4. Online Stores Sales Channel Market Size and Forecast, 2012-2022
5.1.4.1. Revenue (US$ Mn) Comparison, By Region
5.1.4.2. Market Share Comparison, By Region
5.1.4.3. Y-o-Y growth Comparison, By Region
5.1.5. Other Sales Channel Market Size and Forecast, 2012-2022
5.1.5.1. Revenue (US$ Mn) Comparison, By Region
5.1.5.2. Market Share Comparison, By Region
5.1.5.3. Y-o-Y growth Comparison, By Region
6. Global Organic Soups Market Analysis and Forecast By Region
6.1. Global Organic Soups Market Size and Forecast, 2012-2022
6.1.1. North America Organic Soups Market Size and Forecast, 2012-2022
6.1.1.1. Revenue (US$ Mn) Comparison, By Product Type
6.1.1.2. Revenue (US$ Mn) Comparison, By Ingredient
6.1.1.3. Revenue (US$ Mn) Comparison, By Sales Channel
6.1.2. Latin America Organic Soups Market Size and Forecast, 2012-2022
6.1.2.1. Revenue (US$ Mn) Comparison, By Product Type
6.1.2.2. Revenue (US$ Mn) Comparison, By Ingredient
6.1.2.3. Revenue (US$ Mn) Comparison, By Sales Channel
6.1.3. Europe Organic Soups Market Size and Forecast, 2012-2022
6.1.3.1. Revenue (US$ Mn) Comparison, By Product Type
6.1.3.2. Revenue (US$ Mn) Comparison, By Ingredient
6.1.3.3. Revenue (US$ Mn) Comparison, By Sales Channel
6.1.4. Japan Organic Soups Market Size and Forecast, 2012-2022
6.1.4.1. Revenue (US$ Mn) Comparison, By Product Type
6.1.4.2. Revenue (US$ Mn) Comparison, By Ingredient
6.1.4.3. Revenue (US$ Mn) Comparison, By Sales Channel
6.1.5. APEJ Organic Soups Market Size and Forecast, 2012-2022
6.1.5.1. Revenue (US$ Mn) Comparison, By Product Type
6.1.5.2. Revenue (US$ Mn) Comparison, By Ingredient
6.1.5.3. Revenue (US$ Mn) Comparison, By Sales Channel
6.1.6. MEA Organic Soups Market Size and Forecast, 2012-2022
6.1.6.1. Revenue (US$ Mn) Comparison, By Product Type
6.1.6.2. Revenue (US$ Mn) Comparison, By Ingredient
6.1.6.3. Revenue (US$ Mn) Comparison, By Sales Channel
7. North America Organic Soups Market Analysis and Forecast, By Country, 2012-2022
7.1. US Organic Soups Market Size and Forecast, 2012-2022
7.1.1. Revenue (US$ Mn) Comparison, By Product Type
7.1.2. Revenue (US$ Mn) Comparison, By Ingredient
7.1.3. Revenue (US$ Mn) Comparison, By Sales Channel
7.2. Canada Organic Soups Market Size and Forecast, 2012-2022
7.2.1. Revenue (US$ Mn) Comparison, By Product Type
7.2.2. Revenue (US$ Mn) Comparison, By Ingredient
7.2.3. Revenue (US$ Mn) Comparison, By Sales Channel
8. Latin America Organic Soups Market Analysis and Forecast, By Country, 2012-2022
8.1. Brazil Organic Soups Market Size and Forecast, 2012-2022
8.1.1. Revenue (US$ Mn) Comparison, By Product Type
8.1.2. Revenue (US$ Mn) Comparison, By Ingredient
8.1.3. Revenue (US$ Mn) Comparison, By Sales Channel
8.2. Mexico Organic Soups Market Size and Forecast, 2012-2022
8.2.1. Revenue (US$ Mn) Comparison, By Product Type
8.2.2. Revenue (US$ Mn) Comparison, By Ingredient
8.2.3. Revenue (US$ Mn) Comparison, By Sales Channel
8.3. Argentina Organic Soups Market Size and Forecast, 2012-2022
8.3.1. Revenue (US$ Mn) Comparison, By Product Type
8.3.2. Revenue (US$ Mn) Comparison, By Ingredient
8.3.3. Revenue (US$ Mn) Comparison, By Sales Channel
9. Europe Organic Soups Market Analysis and Forecast, By Country, 2012-2022
9.1. Germany Organic Soups Market Size and Forecast, 2012-2022
9.1.1. Revenue (US$ Mn) Comparison, By Product Type
9.1.2. Revenue (US$ Mn) Comparison, By Ingredient
9.1.3. Revenue (US$ Mn) Comparison, By Sales Channel
9.2. UK Organic Soups Market Size and Forecast, 2012-2022
9.2.1. Revenue (US$ Mn) Comparison, By Product Type
9.2.2. Revenue (US$ Mn) Comparison, By Ingredient
9.2.3. Revenue (US$ Mn) Comparison, By Sales Channel
9.3. France Organic Soups Market Size and Forecast, 2012-2022
9.3.1. Revenue (US$ Mn) Comparison, By Product Type
9.3.2. Revenue (US$ Mn) Comparison, By Ingredient
9.3.3. Revenue (US$ Mn) Comparison, By Sales Channel
9.4. Spain Organic Soups Market Size and Forecast, 2012-2022
9.4.1. Revenue (US$ Mn) Comparison, By Product Type
9.4.2. Revenue (US$ Mn) Comparison, By Ingredient
9.4.3. Revenue (US$ Mn) Comparison, By Sales Channel
9.5. Italy Organic Soups Market Size and Forecast, 2012-2022
9.5.1. Revenue (US$ Mn) Comparison, By Product Type
9.5.2. Revenue (US$ Mn) Comparison, By Ingredient
9.5.3. Revenue (US$ Mn) Comparison, By Sales Channel
9.6. Nordic Organic Soups Market Size and Forecast, 2012-2022
9.6.1. Revenue (US$ Mn) Comparison, By Product Type
9.6.2. Revenue (US$ Mn) Comparison, By Ingredient
9.6.3. Revenue (US$ Mn) Comparison, By Sales Channel
10. Japan Organic Soups Market Analysis and Forecast, By Country, 2012-2022
10.1. Japan Organic Soups Market Size and Forecast, 2012-2022
10.1.1. Revenue (US$ Mn) Comparison, By Product Type
10.1.2. Revenue (US$ Mn) Comparison, By Ingredient
10.1.3. Revenue (US$ Mn) Comparison, By Sales Channel
11. APEJ Organic Soups Market Analysis and Forecast, By Country, 2012-2022
11.1. China Organic Soups Market Size and Forecast, 2012-2022
11.1.1. Revenue (US$ Mn) Comparison, By Product Type
11.1.2. Revenue (US$ Mn) Comparison, By Ingredient
11.1.3. Revenue (US$ Mn) Comparison, By Sales Channel
11.2. India Organic Soups Market Size and Forecast, 2012-2022
11.2.1. Revenue (US$ Mn) Comparison, By Product Type
11.2.2. Revenue (US$ Mn) Comparison, By Ingredient
11.2.3. Revenue (US$ Mn) Comparison, By Sales Channel
11.3. Malaysia Organic Soups Market Size and Forecast, 2012-2022
11.3.1. Revenue (US$ Mn) Comparison, By Product Type
11.3.2. Revenue (US$ Mn) Comparison, By Ingredient
11.3.3. Revenue (US$ Mn) Comparison, By Sales Channel
11.4. Thailand Organic Soups Market Size and Forecast, 2012-2022
11.4.1. Revenue (US$ Mn) Comparison, By Product Type
11.4.2. Revenue (US$ Mn) Comparison, By Ingredient
11.4.3. Revenue (US$ Mn) Comparison, By Sales Channel
11.5. Singapore Organic Soups Market Size and Forecast, 2012-2022
11.5.1. Revenue (US$ Mn) Comparison, By Product Type
11.5.2. Revenue (US$ Mn) Comparison, By Ingredient
11.5.3. Revenue (US$ Mn) Comparison, By Sales Channel
11.6. Australia Organic Soups Market Size and Forecast, 2012-2022
11.6.1. Revenue (US$ Mn) Comparison, By Product Type
11.6.2. Revenue (US$ Mn) Comparison, By Ingredient
11.6.3. Revenue (US$ Mn) Comparison, By Sales Channel
12. MEA Organic Soups Market Analysis and Forecast, By Country, 2012-2022
12.1. GCC Countries Organic Soups Market Size and Forecast, 2012-2022
12.1.1. Revenue (US$ Mn) Comparison, By Product Type
12.1.2. Revenue (US$ Mn) Comparison, By Ingredient
12.1.3. Revenue (US$ Mn) Comparison, By Sales Channel
12.2. South Africa Organic Soups Market Size and Forecast, 2012-2022
12.2.1. Revenue (US$ Mn) Comparison, By Product Type
12.2.2. Revenue (US$ Mn) Comparison, By Ingredient
12.2.3. Revenue (US$ Mn) Comparison, By Sales Channel
12.3. Nigeria Organic Soups Market Size and Forecast, 2012-2022
12.3.1. Revenue (US$ Mn) Comparison, By Product Type
12.3.2. Revenue (US$ Mn) Comparison, By Ingredient
12.3.3. Revenue (US$ Mn) Comparison, By Sales Channel
12.4. Israel Organic Soups Market Size and Forecast, 2012-2022
12.4.1. Revenue (US$ Mn) Comparison, By Product Type
12.4.2. Revenue (US$ Mn) Comparison, By Ingredient
12.4.3. Revenue (US$ Mn) Comparison, By Sales Channel
13. Global Organic Soups Market Company Share, Competition Landscape and Company Profiles
13.1. Company Share Analysis
13.2. Competition Landscape
13.3. Company Profiles
13.3.1. Campbell Soup Co.
13.3.2. Kraft Heinz Co.
13.3.3. Unilever PLC
13.3.4. Wolfgang Puck Worldwide, Inc.
13.3.5. Trader Joe's Company.
13.3.6. Blount Fine Foods.
13.3.7. Amy's Kitchen Inc.
13.3.8. Hain Celestial Group.
13.3.9. General Mills, Inc.
13.3.10. Kettle Cuisine, LLC.
14. Research Methodology
15. Secondary and Primary Sources
16. Assumptions and Acronyms
17. Disclaimer
List of Tables
TABLE 1 Global Organic Soups Market Value (US$ Mn), 2012-2016
TABLE 2 Global Organic Soups Market Value (US$ Mn), 2017-2022
TABLE 3 Global Organic Soups Market Value (US$ Mn) and Y-o-Y, 2015-2022
TABLE 4 Global Soup Pre-mixes Segment Value (US$ Mn), By Region 2012-2016
TABLE 5 Global Soup Pre-mixes Segment Value (US$ Mn), By Region 2017-2022
TABLE 6 Global Soup Pre-mixes Segment Market Share, By Region 2012-2016
TABLE 7 Global Soup Pre-mixes Segment Market Share, By Region 2017-2022
TABLE 8 Global Soup Pre-mixes Segment Y-o-Y, By Region 2015-2022
TABLE 9 Global Ready to serve wet soup Segment Value (US$ Mn), By Region 2012-2016
TABLE 10 Global Ready to serve wet soup Segment Value (US$ Mn), By Region 2017-2022
TABLE 11 Global Ready to serve wet soup Segment Market Share, By Region 2012-2016
TABLE 12 Global Ready to serve wet soup Segment Market Share, By Region 2017-2022
TABLE 13 Global Ready to serve wet soup Segment Y-o-Y, By Region 2015-2022
TABLE 14 Global Condensed wet soup Segment Value (US$ Mn), By Region 2012-2016
TABLE 15 Global Condensed wet soup Segment Value (US$ Mn), By Region 2017-2022
TABLE 16 Global Condensed wet soup Segment Market Share, By Region 2012-2016
TABLE 17 Global Condensed wet soup Segment Market Share, By Region 2017-2022
TABLE 18 Global Condensed wet soup Segment Y-o-Y, By Region 2015-2022
TABLE 19 Global Other Product Type Segment Value (US$ Mn), By Region 2012-2016
TABLE 20 Global Other Product Type Segment Value (US$ Mn), By Region 2017-2022
TABLE 21 Global Other Product Type Segment Market Share, By Region 2012-2016
TABLE 22 Global Other Product Type Segment Market Share, By Region 2017-2022
TABLE 23 Global Other Product Type Segment Y-o-Y, By Region 2015-2022
TABLE 24 Global Tomato Segment Value (US$ Mn), By Region 2012-2016
TABLE 25 Global Tomato Segment Value (US$ Mn), By Region 2017-2022
TABLE 26 Global Tomato Segment Market Share, By Region 2012-2016
TABLE 27 Global Tomato Segment Market Share, By Region 2017-2022
TABLE 28 Global Tomato Segment Y-o-Y, By Region 2015-2022
TABLE 29 Global Beans Segment Value (US$ Mn), By Region 2012-2016
TABLE 30 Global Beans Segment Value (US$ Mn), By Region 2017-2022
TABLE 31 Global Beans Segment Market Share, By Region 2012-2016
TABLE 32 Global Beans Segment Market Share, By Region 2017-2022
TABLE 33 Global Beans Segment Y-o-Y, By Region 2015-2022
TABLE 34 Global Chicken Segment Value (US$ Mn), By Region 2012-2016
TABLE 35 Global Chicken Segment Value (US$ Mn), By Region 2017-2022
TABLE 36 Global Chicken Segment Market Share, By Region 2012-2016
TABLE 37 Global Chicken Segment Market Share, By Region 2017-2022
TABLE 38 Global Chicken Segment Y-o-Y, By Region 2015-2022
TABLE 39 Global Beef Segment Value (US$ Mn), By Region 2012-2016
TABLE 40 Global Beef Segment Value (US$ Mn), By Region 2017-2022
TABLE 41 Global Beef Segment Market Share, By Region 2012-2016
TABLE 42 Global Beef Segment Market Share, By Region 2017-2022
TABLE 43 Global Beef Segment Y-o-Y, By Region 2015-2022
TABLE 44 Global Artichokes Segment Value (US$ Mn), By Region 2012-2016
TABLE 45 Global Artichokes Segment Value (US$ Mn), By Region 2017-2022
TABLE 46 Global Artichokes Segment Market Share, By Region 2012-2016
TABLE 47 Global Artichokes Segment Market Share, By Region 2017-2022
TABLE 48 Global Artichokes Segment Y-o-Y, By Region 2015-2022
TABLE 49 Global Mixed Vegetables Segment Value (US$ Mn), By Region 2012-2016
TABLE 50 Global Mixed Vegetables Segment Value (US$ Mn), By Region 2017-2022
TABLE 51 Global Mixed Vegetables Segment Market Share, By Region 2012-2016
TABLE 52 Global Mixed Vegetables Segment Market Share, By Region 2017-2022
TABLE 53 Global Mixed Vegetables Segment Y-o-Y, By Region 2015-2022
TABLE 54 Global Other Ingredients Segment Value (US$ Mn), By Region 2012-2016
TABLE 55 Global Other Ingredients Segment Value (US$ Mn), By Region 2017-2022
TABLE 56 Global Other Ingredients Segment Market Share, By Region 2012-2016
TABLE 57 Global Other Ingredients Segment Market Share, By Region 2017-2022
TABLE 58 Global Other Ingredients Segment Y-o-Y, By Region 2015-2022
TABLE 59 Global HORECA Segment Value (US$ Mn), By Region 2012-2016
TABLE 60 Global HORECA Segment Value (US$ Mn), By Region 2017-2022
TABLE 61 Global HORECA Segment Market Share, By Region 2012-2016
TABLE 62 Global HORECA Segment Market Share, By Region 2017-2022
TABLE 63 Global HORECA Segment Y-o-Y, By Region 2015-2022
TABLE 64 Global Modern Trade Segment Value (US$ Mn), By Region 2012-2016
TABLE 65 Global Modern Trade Segment Value (US$ Mn), By Region 2017-2022
TABLE 66 Global Modern Trade Segment Market Share, By Region 2012-2016
TABLE 67 Global Modern Trade Segment Market Share, By Region 2017-2022
TABLE 68 Global Modern Trade Segment Y-o-Y, By Region 2015-2022
TABLE 69 Global Convenience Stores Segment Value (US$ Mn), By Region 2012-2016
TABLE 70 Global Convenience Stores Segment Value (US$ Mn), By Region 2017-2022
TABLE 71 Global Convenience Stores Segment Market Share, By Region 2012-2016
TABLE 72 Global Convenience Stores Segment Market Share, By Region 2017-2022
TABLE 73 Global Convenience Stores Segment Y-o-Y, By Region 2015-2022
TABLE 74 Global Online Stores Segment Value (US$ Mn), By Region 2012-2016
TABLE 75 Global Online Stores Segment Value (US$ Mn), By Region 2017-2022
TABLE 76 Global Online Stores Segment Market Share, By Region 2012-2016
TABLE 77 Global Online Stores Segment Market Share, By Region 2017-2022
TABLE 78 Global Online Stores Segment Y-o-Y, By Region 2015-2022
TABLE 79 Global Others Segment Value (US$ Mn), By Region 2012-2016
TABLE 80 Global Others Segment Value (US$ Mn), By Region 2017-2022
TABLE 81 Global Others Segment Market Share, By Region 2012-2016
TABLE 82 Global Others Segment Market Share, By Region 2017-2022
TABLE 83 Global Others Segment Y-o-Y, By Region 2015-2022
TABLE 84 North America Organic Soups Market Value (US$ Mn), By Product Type 2012-2016
TABLE 85 North America Organic Soups Market Value (US$ Mn), By Product Type 2017-2022
TABLE 86 North America Organic Soups Market Value (US$ Mn), By Ingredient 2012-2016
TABLE 87 North America Organic Soups Market Value (US$ Mn), By Ingredient 2017-2022
TABLE 88 North America Organic Soups Market Value (US$ Mn), By Sales Channel2012-2016
TABLE 89 North America Organic Soups Market Value (US$ Mn), By Sales Channel2017-2022
TABLE 90 Latin America Organic Soups Market Value (US$ Mn), By Product Type 2012-2016
TABLE 91 Latin America Organic Soups Market Value (US$ Mn), By Product Type 2017-2022
TABLE 92 Latin America Organic Soups Market Value (US$ Mn), By Ingredient 2012-2016
TABLE 93 Latin America Organic Soups Market Value (US$ Mn), By Ingredient 2017-2022
TABLE 94 Latin America Organic Soups Market Value (US$ Mn), By Sales Channel2012-2016
TABLE 95 Latin America Organic Soups Market Value (US$ Mn), By Sales Channel2017-2022
TABLE 96 Europe Organic Soups Market Value (US$ Mn), By Product Type 2012-2016
TABLE 97 Europe Organic Soups Market Value (US$ Mn), By Product Type 2017-2022
TABLE 98 Europe Organic Soups Market Value (US$ Mn), By Ingredient 2012-2016
TABLE 99 Europe Organic Soups Market Value (US$ Mn), By Ingredient 2017-2022
TABLE 100 Europe Organic Soups Market Value (US$ Mn), By Sales Channel2012-2016
TABLE 101 Europe Organic Soups Market Value (US$ Mn), By Sales Channel2017-2022
TABLE 102 Japan Organic Soups Market Value (US$ Mn), By Product Type 2012-2016
TABLE 103 Japan Organic Soups Market Value (US$ Mn), By Product Type 2017-2022
TABLE 104 Japan Organic Soups Market Value (US$ Mn), By Ingredient 2012-2016
TABLE 105 Japan Organic Soups Market Value (US$ Mn), By Ingredient 2017-2022
TABLE 106 Japan Organic Soups Market Value (US$ Mn), By Sales Channel2012-2016
TABLE 107 Japan Organic Soups Market Value (US$ Mn), By Sales Channel2017-2022
TABLE 108 APEJ Organic Soups Market Value (US$ Mn), By Product Type 2012-2016
TABLE 109 APEJ Organic Soups Market Value (US$ Mn), By Product Type 2017-2022
TABLE 110 APEJ Organic Soups Market Value (US$ Mn), By Ingredient 2012-2016
TABLE 111 APEJ Organic Soups Market Value (US$ Mn), By Ingredient 2017-2022
TABLE 112 APEJ Organic Soups Market Value (US$ Mn), By Sales Channel2012-2016
TABLE 113 APEJ Organic Soups Market Value (US$ Mn), By Sales Channel2017-2022
TABLE 114 MEA Organic Soups Market Value (US$ Mn), By Product Type 2012-2016
TABLE 115 MEA Organic Soups Market Value (US$ Mn), By Product Type 2017-2022
TABLE 116 MEA Organic Soups Market Value (US$ Mn), By Ingredient 2012-2016
TABLE 117 MEA Organic Soups Market Value (US$ Mn), By Ingredient 2017-2022
TABLE 118 MEA Organic Soups Market Value (US$ Mn), By Sales Channel2012-2016
TABLE 119 MEA Organic Soups Market Value (US$ Mn), By Sales Channel2017-2022
TABLE 120 US Organic Soups Market Value (US$ Mn), By Product Type 2012-2016
TABLE 121 US Organic Soups Market Value (US$ Mn), By Product Type 2017-2022
TABLE 122 US Organic Soups Market Value (US$ Mn), By Ingredient 2012-2016
TABLE 123 US Organic Soups Market Value (US$ Mn), By Ingredient 2017-2022
TABLE 124 US Organic Soups Market Value (US$ Mn), By Sales Channel2012-2016
TABLE 125 US Organic Soups Market Value (US$ Mn), By Sales Channel2017-2022
TABLE 126 Canada Organic Soups Market Value (US$ Mn), By Product Type 2012-2016
TABLE 127 Canada Organic Soups Market Value (US$ Mn), By Product Type 2017-2022
TABLE 128 Canada Organic Soups Market Value (US$ Mn), By Ingredient 2012-2016
TABLE 129 Canada Organic Soups Market Value (US$ Mn), By Ingredient 2017-2022
TABLE 130 Canada Organic Soups Market Value (US$ Mn), By Sales Channel2012-2016
TABLE 131 Canada Organic Soups Market Value (US$ Mn), By Sales Channel2017-2022
TABLE 132 Brazil Organic Soups Market Value (US$ Mn), By Product Type 2012-2016
TABLE 133 Brazil Organic Soups Market Value (US$ Mn), By Product Type 2017-2022
TABLE 134 Brazil Organic Soups Market Value (US$ Mn), By Ingredient 2012-2016
TABLE 135 Brazil Organic Soups Market Value (US$ Mn), By Ingredient 2017-2022
TABLE 136 Brazil Organic Soups Market Value (US$ Mn), By Sales Channel2012-2016
TABLE 137 Brazil Organic Soups Market Value (US$ Mn), By Sales Channel2017-2022
TABLE 138 Mexico Organic Soups Market Value (US$ Mn), By Product Type 2012-2016
TABLE 139 Mexico Organic Soups Market Value (US$ Mn), By Product Type 2017-2022
TABLE 140 Mexico Organic Soups Market Value (US$ Mn), By Ingredient 2012-2016
TABLE 141 Mexico Organic Soups Market Value (US$ Mn), By Ingredient 2017-2022
TABLE 142 Mexico Organic Soups Market Value (US$ Mn), By Sales Channel2012-2016
TABLE 143 Mexico Organic Soups Market Value (US$ Mn), By Sales Channel2017-2022
TABLE 144 Argentina Organic Soups Market Value (US$ Mn), By Product Type 2012-2016
TABLE 145 Argentina Organic Soups Market Value (US$ Mn), By Product Type 2017-2022
TABLE 146 Argentina Organic Soups Market Value (US$ Mn), By Ingredient 2012-2016
TABLE 147 Argentina Organic Soups Market Value (US$ Mn), By Ingredient 2017-2022
TABLE 148 Argentina Organic Soups Market Value (US$ Mn), By Sales Channel2012-2016
TABLE 149 Argentina Organic Soups Market Value (US$ Mn), By Sales Channel2017-2022
TABLE 150 Germany Organic Soups Market Value (US$ Mn), By Product Type 2012-2016
TABLE 151 Germany Organic Soups Market Value (US$ Mn), By Product Type 2017-2022
TABLE 152 Germany Organic Soups Market Value (US$ Mn), By Ingredient 2012-2016
TABLE 153 Germany Organic Soups Market Value (US$ Mn), By Ingredient 2017-2022
TABLE 154 Germany Organic Soups Market Value (US$ Mn), By Sales Channel2012-2016
TABLE 155 Germany Organic Soups Market Value (US$ Mn), By Sales Channel2017-2022
TABLE 156 UK Organic Soups Market Value (US$ Mn), By Product Type 2012-2016
TABLE 157 UK Organic Soups Market Value (US$ Mn), By Product Type 2017-2022
TABLE 158 UK Organic Soups Market Value (US$ Mn), By Ingredient 2012-2016
TABLE 159 UK Organic Soups Market Value (US$ Mn), By Ingredient 2017-2022
TABLE 160 UK Organic Soups Market Value (US$ Mn), By Sales Channel2012-2016
TABLE 161 UK Organic Soups Market Value (US$ Mn), By Sales Channel2017-2022
TABLE 162 France Organic Soups Market Value (US$ Mn), By Product Type 2012-2016
TABLE 163 France Organic Soups Market Value (US$ Mn), By Product Type 2017-2022
TABLE 164 France Organic Soups Market Value (US$ Mn), By Ingredient 2012-2016
TABLE 165 France Organic Soups Market Value (US$ Mn), By Ingredient 2017-2022
TABLE 166 France Organic Soups Market Value (US$ Mn), By Sales Channel2012-2016
TABLE 167 France Organic Soups Market Value (US$ Mn), By Sales Channel2017-2022
TABLE 168 Spain Organic Soups Market Value (US$ Mn), By Product Type 2012-2016
TABLE 169 Spain Organic Soups Market Value (US$ Mn), By Product Type 2017-2022
TABLE 170 Spain Organic Soups Market Value (US$ Mn), By Ingredient 2012-2016
TABLE 171 Spain Organic Soups Market Value (US$ Mn), By Ingredient 2017-2022
TABLE 172 Spain Organic Soups Market Value (US$ Mn), By Sales Channel2012-2016
TABLE 173 Spain Organic Soups Market Value (US$ Mn), By Sales Channel2017-2022
TABLE 174 Italy Organic Soups Market Value (US$ Mn), By Product Type 2012-2016
TABLE 175 Italy Organic Soups Market Value (US$ Mn), By Product Type 2017-2022
TABLE 176 Italy Organic Soups Market Value (US$ Mn), By Ingredient 2012-2016
TABLE 177 Italy Organic Soups Market Value (US$ Mn), By Ingredient 2017-2022
TABLE 178 Italy Organic Soups Market Value (US$ Mn), By Sales Channel2012-2016
TABLE 179 Italy Organic Soups Market Value (US$ Mn), By Sales Channel2017-2022
TABLE 180 Nordic Organic Soups Market Value (US$ Mn), By Product Type 2012-2016
TABLE 181 Nordic Organic Soups Market Value (US$ Mn), By Product Type 2017-2022
TABLE 182 Nordic Organic Soups Market Value (US$ Mn), By Ingredient 2012-2016
TABLE 183 Nordic Organic Soups Market Value (US$ Mn), By Ingredient 2017-2022
TABLE 184 Nordic Organic Soups Market Value (US$ Mn), By Sales Channel2012-2016
TABLE 185 Nordic Organic Soups Market Value (US$ Mn), By Sales Channel2017-2022
TABLE 186 Japan Organic Soups Market Value (US$ Mn), By Product Type 2012-2016
TABLE 187 Japan Organic Soups Market Value (US$ Mn), By Product Type 2017-2022
TABLE 188 Japan Organic Soups Market Value (US$ Mn), By Ingredient 2012-2016
TABLE 189 Japan Organic Soups Market Value (US$ Mn), By Ingredient 2017-2022
TABLE 190 Japan Organic Soups Market Value (US$ Mn), By Sales Channel2012-2016
TABLE 191 Japan Organic Soups Market Value (US$ Mn), By Sales Channel2017-2022
TABLE 192 China Organic Soups Market Value (US$ Mn), By Product Type 2012-2016
TABLE 193 China Organic Soups Market Value (US$ Mn), By Product Type 2017-2022
TABLE 194 China Organic Soups Market Value (US$ Mn), By Ingredient 2012-2016
TABLE 195 China Organic Soups Market Value (US$ Mn), By Ingredient 2017-2022
TABLE 196 China Organic Soups Market Value (US$ Mn), By Sales Channel2012-2016
TABLE 197 China Organic Soups Market Value (US$ Mn), By Sales Channel2017-2022
TABLE 198 India Organic Soups Market Value (US$ Mn), By Product Type 2012-2016
TABLE 199 India Organic Soups Market Value (US$ Mn), By Product Type 2017-2022
TABLE 200 India Organic Soups Market Value (US$ Mn), By Ingredient 2012-2016
TABLE 201 India Organic Soups Market Value (US$ Mn), By Ingredient 2017-2022
TABLE 202 India Organic Soups Market Value (US$ Mn), By Sales Channel2012-2016
TABLE 203 India Organic Soups Market Value (US$ Mn), By Sales Channel2017-2022
TABLE 204 Malaysia Organic Soups Market Value (US$ Mn), By Product Type 2012-2016
TABLE 205 Malaysia Organic Soups Market Value (US$ Mn), By Product Type 2017-2022
TABLE 206 Malaysia Organic Soups Market Value (US$ Mn), By Ingredient 2012-2016
TABLE 207 Malaysia Organic Soups Market Value (US$ Mn), By Ingredient 2017-2022
TABLE 208 Malaysia Organic Soups Market Value (US$ Mn), By Sales Channel2012-2016
TABLE 209 Malaysia Organic Soups Market Value (US$ Mn), By Sales Channel2017-2022
TABLE 210 Thailand Organic Soups Market Value (US$ Mn), By Product Type 2012-2016
TABLE 211 Thailand Organic Soups Market Value (US$ Mn), By Product Type 2017-2022
TABLE 212 Thailand Organic Soups Market Value (US$ Mn), By Ingredient 2012-2016
TABLE 213 Thailand Organic Soups Market Value (US$ Mn), By Ingredient 2017-2022
TABLE 214 Thailand Organic Soups Market Value (US$ Mn), By Sales Channel2012-2016
TABLE 215 Thailand Organic Soups Market Value (US$ Mn), By Sales Channel2017-2022
TABLE 216 Singapore Organic Soups Market Value (US$ Mn), By Product Type 2012-2016
TABLE 217 Singapore Organic Soups Market Value (US$ Mn), By Product Type 2017-2022
TABLE 218 Singapore Organic Soups Market Value (US$ Mn), By Ingredient 2012-2016
TABLE 219 Singapore Organic Soups Market Value (US$ Mn), By Ingredient 2017-2022
TABLE 220 Singapore Organic Soups Market Value (US$ Mn), By Sales Channel2012-2016
TABLE 221 Singapore Organic Soups Market Value (US$ Mn), By Sales Channel2017-2022
TABLE 222 Australia Organic Soups Market Value (US$ Mn), By Product Type 2012-2016
TABLE 223 Australia Organic Soups Market Value (US$ Mn), By Product Type 2017-2022
TABLE 224 Australia Organic Soups Market Value (US$ Mn), By Ingredient 2012-2016
TABLE 225 Australia Organic Soups Market Value (US$ Mn), By Ingredient 2017-2022
TABLE 226 Australia Organic Soups Market Value (US$ Mn), By Sales Channel2012-2016
TABLE 227 Australia Organic Soups Market Value (US$ Mn), By Sales Channel2017-2022
TABLE 228 GCC Countries Organic Soups Market Value (US$ Mn), By Product Type 2012-2016
TABLE 229 GCC Countries Organic Soups Market Value (US$ Mn), By Product Type 2017-2022
TABLE 230 GCC Countries Organic Soups Market Value (US$ Mn), By Ingredient 2012-2016
TABLE 231 GCC Countries Organic Soups Market Value (US$ Mn), By Ingredient 2017-2022
TABLE 232 GCC Countries Organic Soups Market Value (US$ Mn), By Sales Channel2012-2016
TABLE 233 GCC Countries Organic Soups Market Value (US$ Mn), By Sales Channel2017-2022
TABLE 234 South Africa Organic Soups Market Value (US$ Mn), By Product Type 2012-2016
TABLE 235 South Africa Organic Soups Market Value (US$ Mn), By Product Type 2017-2022
TABLE 236 South Africa Organic Soups Market Value (US$ Mn), By Ingredient 2012-2016
TABLE 237 South Africa Organic Soups Market Value (US$ Mn), By Ingredient 2017-2022
TABLE 238 South Africa Organic Soups Market Value (US$ Mn), By Sales Channel2012-2016
TABLE 239 South Africa Organic Soups Market Value (US$ Mn), By Sales Channel2017-2022
TABLE 240 Nigeria Organic Soups Market Value (US$ Mn), By Product Type 2012-2016
TABLE 241 Nigeria Organic Soups Market Value (US$ Mn), By Product Type 2017-2022
TABLE 242 Nigeria Organic Soups Market Value (US$ Mn), By Ingredient 2012-2016
TABLE 243 Nigeria Organic Soups Market Value (US$ Mn), By Ingredient 2017-2022
TABLE 244 Nigeria Organic Soups Market Value (US$ Mn), By Sales Channel2012-2016
TABLE 245 Nigeria Organic Soups Market Value (US$ Mn), By Sales Channel2017-2022
TABLE 246 Israel Organic Soups Market Value (US$ Mn), By Product Type 2012-2016
TABLE 247 Israel Organic Soups Market Value (US$ Mn), By Product Type 2017-2022
TABLE 248 Israel Organic Soups Market Value (US$ Mn), By Ingredient 2012-2016
TABLE 249 Israel Organic Soups Market Value (US$ Mn), By Ingredient 2017-2022
TABLE 250 Israel Organic Soups Market Value (US$ Mn), By Sales Channel2012-2016
TABLE 251 Israel Organic Soups Market Value (US$ Mn), By Sales Channel2017-2022
List of Figures
FIG. 1 Global Organic Soups Market Value (US$ Mn), 2012-2016
FIG. 2 Global Organic Soups Market Value (US$ Mn) Forecast, 2017-2022
FIG. 3 Global Organic Soups Market Value (US$ Mn) and Y-o-Y, 2015-2022
FIG. 4 Global Soup Pre-mixes Segment Market Value (US$ Mn) By Region, 2012-2016
FIG. 5 Global Soup Pre-mixes Segment Market Value (US$ Mn) By Region, 2017-2022
FIG. 6 Global Soup Pre-mixes Segment Y-o-Y Growth Rate, By Region, 2015-2022
FIG. 7 Global Ready to serve wet soup Segment Market Value (US$ Mn) By Region, 2012-2016
FIG. 8 Global Ready to serve wet soup Segment Market Value (US$ Mn) By Region, 2017-2022
FIG. 9 Global Ready to serve wet soup Segment Y-o-Y Growth Rate, By Region, 2015-2022
FIG. 10 Global Condensed wet soup Segment Market Value (US$ Mn) By Region, 2012-2016
FIG. 11 Global Condensed wet soup Segment Market Value (US$ Mn) By Region, 2017-2022
FIG. 12 Global Condensed wet soup Segment Y-o-Y Growth Rate, By Region, 2015-2022
FIG. 13 Global Other Product Type Segment Market Value (US$ Mn) By Region, 2012-2016
FIG. 14 Global Other Product Type Segment Market Value (US$ Mn) By Region, 2017-2022
FIG. 15 Global Other Product Type Segment Y-o-Y Growth Rate, By Region, 2015-2022
FIG. 16 Global Tomato Segment Market Value (US$ Mn) By Region, 2012-2016
FIG. 17 Global Tomato Segment Market Value (US$ Mn) By Region, 2017-2022
FIG. 18 Global Tomato Segment Y-o-Y Growth Rate, By Region, 2015-2022
FIG. 19 Global Beans Segment Market Value (US$ Mn) By Region, 2012-2016
FIG. 20 Global Beans Segment Market Value (US$ Mn) By Region, 2017-2022
FIG. 21 Global Beans Segment Y-o-Y Growth Rate, By Region, 2015-2022
FIG. 22 Global Chicken Segment Market Value (US$ Mn) By Region, 2012-2016
FIG. 23 Global Chicken Segment Market Value (US$ Mn) By Region, 2017-2022
FIG. 24 Global Chicken Segment Y-o-Y Growth Rate, By Region, 2015-2022
FIG. 25 Global Beef Segment Market Value (US$ Mn) By Region, 2012-2016
FIG. 26 Global Beef Segment Market Value (US$ Mn) By Region, 2017-2022
FIG. 27 Global Beef Segment Y-o-Y Growth Rate, By Region, 2015-2022
FIG. 28 Global Artichokes Segment Market Value (US$ Mn) By Region, 2012-2016
FIG. 29 Global Artichokes Segment Market Value (US$ Mn) By Region, 2017-2022
FIG. 30 Global Artichokes Segment Y-o-Y Growth Rate, By Region, 2015-2022
FIG. 31 Global Mixed Vegetables Segment Market Value (US$ Mn) By Region, 2012-2016
FIG. 32 Global Mixed Vegetables Segment Market Value (US$ Mn) By Region, 2017-2022
FIG. 33 Global Mixed Vegetables Segment Y-o-Y Growth Rate, By Region, 2015-2022
FIG. 34 Global Other Ingredients Segment Market Value (US$ Mn) By Region, 2012-2016
FIG. 35 Global Other Ingredients Segment Market Value (US$ Mn) By Region, 2017-2022
FIG. 36 Global Other Ingredients Segment Y-o-Y Growth Rate, By Region, 2015-2022
FIG. 37 Global HORECA Segment Market Value (US$ Mn) By Region, 2012-2016
FIG. 38 Global HORECA Segment Market Value (US$ Mn) By Region, 2017-2022
FIG. 39 Global HORECA Segment Y-o-Y Growth Rate, By Region, 2015-2022
FIG. 40 Global Modern Trade Segment Market Value (US$ Mn) By Region, 2012-2016
FIG. 41 Global Modern Trade Segment Market Value (US$ Mn) By Region, 2017-2022
FIG. 42 Global Modern Trade Segment Y-o-Y Growth Rate, By Region, 2015-2022
FIG. 43 Global Convenience Stores Segment Market Value (US$ Mn) By Region, 2012-2016
FIG. 44 Global Convenience Stores Segment Market Value (US$ Mn) By Region, 2017-2022
FIG. 45 Global Convenience Stores Segment Y-o-Y Growth Rate, By Region, 2015-2022
FIG. 46 Global Online Stores Segment Market Value (US$ Mn) By Region, 2012-2016
FIG. 47 Global Online Stores Segment Market Value (US$ Mn) By Region, 2017-2022
FIG. 48 Global Online Stores Segment Y-o-Y Growth Rate, By Region, 2015-2022
FIG. 49 Global Others Segment Market Value (US$ Mn) By Region, 2012-2016
FIG. 50 Global Others Segment Market Value (US$ Mn) By Region, 2017-2022
FIG. 51 Global Others Segment Y-o-Y Growth Rate, By Region, 2015-2022
FIG. 52 North America Organic Soups Market Value (US$ Mn), By Product Type 2012-2016
FIG. 53 North America Organic Soups Market Value (US$ Mn), By Product Type 2017-2022
FIG. 54 North America Organic Soups Market Value (US$ Mn), By Ingredient 2012-2016
FIG. 55 North America Organic Soups Market Value (US$ Mn), By Ingredient 2017-2022
FIG. 56 North America Organic Soups Market Value (US$ Mn), By Sales Channel2012-2016
FIG. 57 North America Organic Soups Market Value (US$ Mn), By Sales Channel2017-2022
FIG. 58 Latin America Organic Soups Market Value (US$ Mn), By Product Type 2012-2016
FIG. 59 Latin America Organic Soups Market Value (US$ Mn), By Product Type 2017-2022
FIG. 60 Latin America Organic Soups Market Value (US$ Mn), By Ingredient 2012-2016
FIG. 61 Latin America Organic Soups Market Value (US$ Mn), By Ingredient 2017-2022
FIG. 62 Latin America Organic Soups Market Value (US$ Mn), By Sales Channel2012-2016
FIG. 63 Latin America Organic Soups Market Value (US$ Mn), By Sales Channel2017-2022
FIG. 64 Europe Organic Soups Market Value (US$ Mn), By Product Type 2012-2016
FIG. 65 Europe Organic Soups Market Value (US$ Mn), By Product Type 2017-2022
FIG. 66 Europe Organic Soups Market Value (US$ Mn), By Ingredient 2012-2016
FIG. 67 Europe Organic Soups Market Value (US$ Mn), By Ingredient 2017-2022
FIG. 68 Europe Organic Soups Market Value (US$ Mn), By Sales Channel2012-2016
FIG. 69 Europe Organic Soups Market Value (US$ Mn), By Sales Channel2017-2022
FIG. 70 Japan Organic Soups Market Value (US$ Mn), By Product Type 2012-2016
FIG. 71 Japan Organic Soups Market Value (US$ Mn), By Product Type 2017-2022
FIG. 72 Japan Organic Soups Market Value (US$ Mn), By Ingredient 2012-2016
FIG. 73 Japan Organic Soups Market Value (US$ Mn), By Ingredient 2017-2022
FIG. 74 Japan Organic Soups Market Value (US$ Mn), By Sales Channel2012-2016
FIG. 75 Japan Organic Soups Market Value (US$ Mn), By Sales Channel2017-2022
FIG. 76 APEJ Organic Soups Market Value (US$ Mn), By Product Type 2012-2016
FIG. 77 APEJ Organic Soups Market Value (US$ Mn), By Product Type 2017-2022
FIG. 78 APEJ Organic Soups Market Value (US$ Mn), By Ingredient 2012-2016
FIG. 79 APEJ Organic Soups Market Value (US$ Mn), By Ingredient 2017-2022
FIG. 80 APEJ Organic Soups Market Value (US$ Mn), By Sales Channel2012-2016
FIG. 81 APEJ Organic Soups Market Value (US$ Mn), By Sales Channel2017-2022
FIG. 82 MEA Organic Soups Market Value (US$ Mn), By Product Type 2012-2016
FIG. 83 MEA Organic Soups Market Value (US$ Mn), By Product Type 2017-2022
FIG. 84 MEA Organic Soups Market Value (US$ Mn), By Ingredient 2012-2016
FIG. 85 MEA Organic Soups Market Value (US$ Mn), By Ingredient 2017-2022
FIG. 86 MEA Organic Soups Market Value (US$ Mn), By Sales Channel2012-2016
FIG. 87 MEA Organic Soups Market Value (US$ Mn), By Sales Channel2017-2022
Copyright © Transparency Market Research, Inc. All Rights reserved
Trust Online

Organic Soups Market