
Reports
Reports
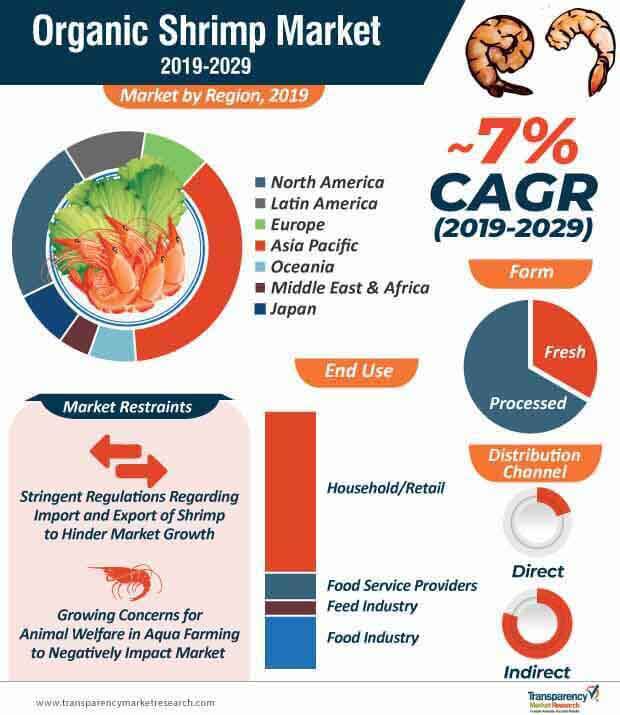
The growing demand for seafood, globally, has led to the controlled cultivation of aquatic organisms specifically meant for human consumption. Rising awareness among people about the methods employed in aquatic farming, and the detrimental effects that they can have on both, humans and the environment, when practiced incorrectly, has led to a growing inclination toward responsible aquaculture practices. This shift toward improved farming, in recent years, has had a positive impact on the growth of the global organic shrimp market.
Growth in the popularity of organic shrimp can be attributed to the nutritional benefits it offers. These include iodine, selenium, and others, which can promote heart health. Increasing demand can also be attributed to the rise the consumption of wholesome protein-rich products, as healthy lifestyle foods gain traction in the global food & beverage industry.
Manufacturers in the global organic shrimp market are looking to capitalize on this trend as they ramp up production to keep pace with the global demand for the same. In 2018, the organic shrimp market witnessed sales of ~33 Bn tons, which is projected to increase at a CAGR of ~7% over the forecast period, to reach ~68 Bn tons by 2029.
The trend of transparency and clean packaging that is sweeping through the food & beverage industry has also influenced the global organic shrimp market, where market players are looking to incorporate the tenets of clean packaging to improve sales, globally. Coupled with this, producers in the organic shrimp market are also looking to preserve the quality and integrity of the product as it travels through the supply chain, right from hatching and harvesting, until it reaches the end user. They are doing this primarily by adhering to the various regulations set out by governing bodies, and keeping up with the certifications and labels that pertain to them, including organic labels and BAP certification. This has resulted in the standardization of the quality of organic shrimp, and, in turn, a reduction in consumer mistrust, which has had a positive impact on the growth of the global organic shrimp market.
Food packaging has also had an indisputable impact, as consumer preference is shifting to ready-to-eat foods that is available in convenient packaging. With the rising popularity of seafood as a snack, manufacturers are exploiting this trend by focusing on convenience packaging, which has had an instrumental effect on the organic shrimp market as well.
In 2018, Asia Pacific accounted for nearly one-third of the total share of the global organic shrimp market, making it the most significant region in the landscape. The region is expected to hold its place at the head of the table during the forecast period, with more than 2X increase in value to reach the ~US$ 270 Mn mark by 2029. This is due to rising awareness of the health benefits of organic food, focus on the quality of products, and demand for convenient packaging or ready-to-eat food. Also contributing to this popularity is the presence of facilities in the region that cater to this rising demand from consumers.
Due to increasing responsible aquaculture and sustainable farming, there has been an increase in the consumption of seafood in North America, including shrimp. The organic shrimp market in North America, which was valued at ~US$ 80 Mn in 2018, is expected to grow the fastest during the forecast period, doubling in value by the end of 2029.
Analysts’ Overview of Organic Shrimp Market
The growing popularity of organic products and consumers demanding information about the source and production processes have contributed to the popularity of organic foods in recent years. This trend has also had a positive impact on the global organic shrimp market, which, according to analysts at Transparency Market Research, is expected to grow steadily at a decent CAGR of ~7% over the forecast period. Manufacturers in the organic shrimp market, focusing on enhancing the quality of packaging to improve the shelf life and protect the integrity of shrimp, are likely to witness profitable gains and strengthen their foothold in the market.
Asia Pacific is set to remain the umost lucrative region for players in the global organic shrimp market, as awareness of the health benefits of organic food is rising in this region. This has also had an impact on the market in North America, which is set to expand the fastest by both, value and volume. Manufacturers looking to expand into these regions are likely to benefit from lucrative opportunities and maximize profits during the forecast period.
Organic Shrimp Market: Overview
Organic Shrimp Market: Stable Supply in the U.S. to Create Favorable Environment
Organic Shrimp Gaining Retail Shelf Space in Potential Markets
Organic Shrimp Market: Selective Breeding Programs to Enable Better Yield
Restaurants & Hotels to Boost Demand for Organic Marine Products
Organic Shrimp Market: Competitive Landscape
Organic Shrimp Market: Key Developments
Some of the key developments witnessed in the organic shrimp market during the past few years are as follows:
1. Executive Summary
1.1. Market Overview
1.2. Market Analysis
1.3. TMR Analysis and Recommendations
1.4. Opportunity Matrix
2. Market Introduction
2.1. Market Definition
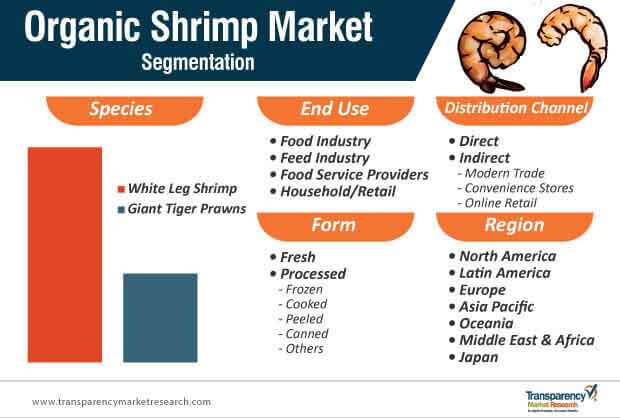
2.2. Market Taxonomy
3. Organic Shrimp Market Background
3.1. Global Organic Aquaculture Market Overview
3.2. Key Developments and Product Launches
3.3. Overview of Claims and Certifications for Organic Shrimp Products
3.4. Overview of Production and Processing Methods
3.5. Macro-Economic Indicators
3.5.1. Global GDP by Region and Country
3.5.2. Global Industry Value Added
3.5.3. Global Food and Beverage Industry Outlook
3.6. Value Chain Analysis
3.6.1. Raw Material Suppliers
3.6.2. Product Manufacturers
3.6.3. Distributors/Suppliers/Wholesalers
3.6.4. Private Label
3.6.5. End Users
3.7. Market Dynamics
3.7.1. Drivers
3.7.2. Restraints
3.7.3. Opportunities
3.7.4. Trends
3.8. Consumer Perception and End User Survey
3.9. Forecast Factors – Relevance and Impact
4. Global Organic Shrimp Market Analysis 2014–2018 and Forecast 2019–2029
4.1. Market Size (US$ Mn) and Forecast
4.1.1. Market Size (US$ Mn) and Y-o-Y Growth
4.1.2. Absolute $ Opportunity
5. Global Organic Shrimp Market Pricing Analysis
5.1. Regional Average Pricing Analysis (US$)
5.1.1. North America
5.1.2. Latin America
5.1.3. Europe
5.1.4. Asia Pacific
5.1.5. Oceania
5.1.6. Middle East & Africa
5.1.7. Japan
5.2. Pricing Analysis, By Species
6. Global Organic Shrimp Market Analysis 2014–2018 and Forecast 2019–2029, by Region
6.1. Introduction
6.2. Historical Market Size (US$ Mn) By Region, 2014–2018
6.3. Market Size (US$ Mn) Forecast By Region, 2019-2029
6.3.1. North America
6.3.2. Latin America
6.3.3. Europe
6.3.4. Asia Pacific
6.3.5. Oceania
6.3.6. Middle East & Africa
6.3.7. Japan
6.4. Attractiveness Analysis by Region
7. Global Organic Shrimp Market Analysis 2014–2018 and Forecast 2019–2029, by Species
7.1. Introduction
7.2. Historical Market Size (US$ Mn) By Species, 2014–2018
7.3. Market Size (US$ Mn) Forecast By Species, 2019-2029
7.3.1. White Leg Shrimp
7.3.2. Giant Tiger Prawn
7.4. Market Attractiveness Analysis By Species
8. Global Organic Shrimp Market Analysis 2014–2018 and Forecast 2019–2029, by Form
8.1. Introduction
8.2. Historical Market Size (US$ Mn) By Form, 2014–2018
8.3. Market Size (US$ Mn) Forecast By Form, 2019-2029
8.3.1. Fresh
8.3.2. Processed
8.3.2.1 Frozen
8.3.2.2 Cooked
8.3.2.3 Peeled
8.3.2.4 Canned
8.3.2.5 Others
8.4. Market Attractiveness Analysis By Form,
9. Global Organic Shrimp Market Analysis 2014–2018 and Forecast 2019–2029, by End Use
9.1. Introduction
9.2. Historical Market Size (US$ Mn) By End Use, 2014–2018
9.3. Market Size (US$ Mn) Forecast By End Use, 2019-2029
9.3.1. Food Industry
9.3.2. Feed Industry
9.3.3. Food Service Provider
9.3.4. Household/Retail
9.4. Market Attractiveness Analysis By End Use,
10. Global Organic Shrimp Market Analysis 2014–2018 and Forecast 2019–2029, by Distribution Channel
10.1. Introduction
10.2. Historical Market Size (US$ Mn) By Distribution Channel, 2014–2018
10.3. Market Size (US$ Mn) Forecast By Distribution Channel, 2019-2029
10.3.1. Direct
10.3.2. Indirect
10.3.2.1. Modern Trade
10.3.2.2. Convenience Stores
10.3.2.3. Online Retail
10.4. Market Attractiveness Analysis By Distribution Channel,
11. North America Organic Shrimp Market Analysis 2014–2018 and Forecast 2019–2029
11.1. Introduction
11.2. Historical Market Value (US$ Mn) By Market Segments, 2014–2018
11.3. Market Value (US$ Mn) Forecast By Market Segments, 2019-2029
11.3.1. By Country
11.3.1.1. U.S.
11.3.1.2. Canada
11.3.2. By Species
11.3.3. By Form
11.3.4. End Use
11.3.5. Distribution Channel
11.4. Market Attractiveness Analysis
11.4.1. By Country
11.4.2. By Species
11.4.3. By Form
11.4.4. End Use
11.4.5. Distribution Channel
11.5. Drivers and Restraints: Impact Analysis
11.6. Key Participants Market Presence Intensity Mapping
12. Latin America Organic Shrimp Market Analysis 2014–2018 and Forecast 2019–2029
12.1. Introduction
12.2. Historical Market Value (US$ Mn) By Market Segments, 2014–2018
12.3. Market Value (US$ Mn) Forecast By Market Segments, 2019-2029
12.3.1. By Country
12.3.1.1. Mexico
12.3.1.2. Brazil
12.3.1.3. Euclador
12.3.1.4. Peru
12.3.1.5. Rest of Latin America
12.3.2. By Species
12.3.3. By Form
12.3.4. End Use
12.3.5. Distribution Channel
12.4. Market Attractiveness Analysis
12.4.1. By Country
12.4.2. By Species
12.4.3. By Form
12.4.4. End Use
12.4.5. Distribution Channel
12.5. Drivers and Restraints: Impact Analysis
12.6. Key Participants Market Presence Intensity Mapping
13. Europe Organic Shrimp Market Analysis 2014–2018 and Forecast 2019–2029
13.1. Introduction
13.2. Historical Market Value (US$ Mn) By Market Segments, 2014–2018
13.3. Market Value (US$ Mn) Forecast By Market Segments, 2019-2029
13.3.1. By Country
13.3.1.1. EU-5
13.3.1.2. Nordic Countries
13.3.1.3. BENELUX Countries
13.3.1.4. Poland
13.3.1.5. Russia
13.3.1.6. Rest of Europe
13.3.2. By Species
13.3.3. By Form
13.3.4. End Use
13.3.5. Distribution Channel
13.4. Market Attractiveness Analysis
13.4.1. By Country
13.4.2. By Species
13.4.3. By Form
13.4.4. End Use
13.4.5. Distribution Channel
13.5. Drivers and Restraints: Impact Analysis
13.6. Key Participants Market Presence Intensity Mapping
14. Asia Pacific Organic Shrimp Market Analysis 2014–2018 and Forecast 2019–2029
14.1. Introduction
14.2. Historical Market Value (US$ Mn) By Market Segments, 2014–2018
14.3. Market Value (US$ Mn) Forecast By Market Segments, 2019-2029
14.3.1. By Country
14.3.1.1. China
14.3.1.2. India
14.3.1.3. Thailand
14.3.1.4. Vietnam
14.3.1.5. Indonesia
14.3.1.6. South Korea
14.3.1.7. Rest of Asia Pacific
14.3.2. By Species
14.3.3. By Form
14.3.4. End Use
14.3.5. Distribution Channel
14.4. Market Attractiveness Analysis
14.4.1. By Country
14.4.2. By Species
14.4.3. By Form
14.4.4. End Use
14.4.5. Distribution Channel
14.5. Drivers and Restraints: Impact Analysis
14.6. Key Participants Market Presence Intensity Mapping
15. Oceania Organic Shrimp Market Analysis 2014–2018 and Forecast 2019–2029
15.1. Introduction
15.2. Historical Market Value (US$ Mn) By Market Segments, 2014–2018
15.3. Market Value (US$ Mn) Forecast By Market Segments, 2019-2029
15.3.1. By Country
15.3.1.1. Australia
15.3.1.2. New Zealand
15.3.2. By Species
15.3.3. By Form
15.3.4. End Use
15.3.5. Distribution Channel
15.4. Market Attractiveness Analysis
15.4.1. By Country
15.4.2. By Species
15.4.3. By Form
15.4.4. End Use
15.4.5. Distribution Channel
15.5. Drivers and Restraints: Impact Analysis
15.6. Key Participants Market Presence Intensity Mapping
16. Middle East & Africa Organic Shrimp Market Analysis 2014–2018 and Forecast 2019–2029
16.1. Introduction
16.2. Historical Market Value (US$ Mn) By Market Segments, 2014–2018
16.3. Market Value (US$ Mn) Forecast By Market Segments, 2019-2029
16.3.1. By Country
16.3.1.1. GCC Countries
16.3.1.2. South Africa
16.3.1.3. Israel
16.3.1.4. Turkey
16.3.1.5. Rest of MEA
16.3.2. By Species
16.3.3. By Form
16.3.4. End Use
16.3.5. Distribution Channel
16.4. Market Attractiveness Analysis
16.4.1. By Country
16.4.2. By Species
16.4.3. By Form
16.4.4. End Use
16.4.5. Distribution Channel
16.5. Drivers and Restraints: Impact Analysis
16.6. Key Participants Market Presence Intensity Mapping
17. Japan Organic Shrimp Market Analysis 2014–2018 and Forecast 2019–2029
17.1. Introduction
17.2. Historical Market Value (US$ Mn) By Market Segments, 2014–2018
17.3. Market Value (US$ Mn) Forecast By Market Segments, 2019-2029
17.3.1. By Species
17.3.2. By Form
17.3.3. End Use
17.3.4. Distribution Channel
17.4. Market Attractiveness Analysis
17.4.1. By Species
17.4.2. By Form
17.4.3. End Use
17.4.4. Distribution Channel
17.5. Drivers and Restraints: Impact Analysis
17.6. Key Participants Market Presence Intensity Mapping
18. Organic Shrimp Market Industry Structure
18.1. Market Analysis by Tier of Companies
18.2. Market Concentration
18.3. Market Share Analysis of Top 10 Players
18.4. Market Presence Analysis
18.4.1. By Regional Footprint
18.4.2. By Product Footprint
18.4.3. By Channel Footprint
19. Competition Analysis
19.1. Competition Dashboard
19.2. Competition Developments (Mergers, Acquisitions and Expansions)
19.3. Competition Deepdive
19.3.1. Omarsa S.A
19.3.1.1. Overview
19.3.1.2. Product Portfolio
19.3.1.3. Profitability by Market Segments (Product/Channel/Region)
19.3.1.4. Sales Footprint
19.3.1.5. Channel Footprint
19.3.1.6. Strategy Overview
19.3.1.6.1. Marketing Strategy
19.3.1.6.2. Product Strategy
19.3.1.6.3. Channel Strategy
19.3.2. MSeafood Corp
19.3.2.1. Overview
19.3.2.2. Product Portfolio
19.3.2.3. Profitability by Market Segments (Product/Channel/Region)
19.3.2.4. Sales Footprint
19.3.2.5. Channel Footprint
19.3.2.6. Strategy Overview
19.3.2.6.1. Marketing Strategy
19.3.2.6.2. Product Strategy
19.3.2.6.3. Channel Strategy
19.3.3. Ristic GmbH
19.3.3.1. Overview
19.3.3.2. Product Portfolio
19.3.3.3. Profitability by Market Segments (Product/Channel/Region)
19.3.3.4. Sales Footprint
19.3.3.5. Channel Footprint
19.3.3.6. Strategy Overview
19.3.3.6.1. Marketing Strategy
19.3.3.6.2. Product Strategy
19.3.3.6.3. Channel Strategy
19.3.4. Vinnbio India Pvt. Ltd
19.3.4.1. Overview
19.3.4.2. Product Portfolio
19.3.4.3. Profitability by Market Segments (Product/Channel/Region)
19.3.4.4. Sales Footprint
19.3.4.5. Channel Footprint
19.3.4.6. Strategy Overview
19.3.4.6.1. Marketing Strategy
19.3.4.6.2. Product Strategy
19.3.4.6.3. Channel Strategy
19.3.5. Seajoy Group
19.3.5.1. Overview
19.3.5.2. Product Portfolio
19.3.5.3. Profitability by Market Segments (Product/Channel/Region)
19.3.5.4. Sales Footprint
19.3.5.5. Channel Footprint
19.3.5.6. Strategy Overview
19.3.5.6.1. Marketing Strategy
19.3.5.6.2. Product Strategy
19.3.5.6.3. Channel Strategy
19.3.6. Dom International Limited
19.3.6.1. Overview
19.3.6.2. Product Portfolio
19.3.6.3. Profitability by Market Segments (Product/Channel/Region)
19.3.6.4. Sales Footprint
19.3.6.5. Channel Footprint
19.3.6.6. Strategy Overview
19.3.6.6.1. Marketing Strategy
19.3.6.6.2. Product Strategy
19.3.6.6.3. Channel Strategy
19.3.7. Carribbean Shrimp Company Limited
19.3.7.1. Overview
19.3.7.2. Product Portfolio
19.3.7.3. Profitability by Market Segments (Product/Channel/Region)
19.3.7.4. Sales Footprint
19.3.7.5. Channel Footprint
19.3.7.6. Strategy Overview
19.3.7.6.1. Marketing Strategy
19.3.7.6.2. Product Strategy
19.3.7.6.3. Channel Strategy
19.3.8. Artisanfish LLC
19.3.8.1. Overview
19.3.8.2. Product Portfolio
19.3.8.3. Profitability by Market Segments (Product/Channel/Region)
19.3.8.4. Sales Footprint
19.3.8.5. Channel Footprint
19.3.8.6. Strategy Overview
19.3.8.6.1. Marketing Strategy
19.3.8.6.2. Product Strategy
19.3.8.6.3. Channel Strategy
19.3.9. Ananda Group
19.3.9.1. Overview
19.3.9.2. Product Portfolio
19.3.9.3. Profitability by Market Segments (Product/Channel/Region)
19.3.9.4. Sales Footprint
19.3.9.5. Channel Footprint
19.3.9.6. Strategy Overview
19.3.9.6.1. Marketing Strategy
19.3.9.6.2. Product Strategy
19.3.9.6.3. Channel Strategy
19.3.10. Orchid Marine
19.3.10.1. Overview
19.3.10.2. Product Portfolio
19.3.10.3. Profitability by Market Segments (Product/Channel/Region)
19.3.10.4. Sales Footprint
19.3.10.5. Channel Footprint
19.3.10.6. Strategy Overview
19.3.10.6.1. Marketing Strategy
19.3.10.6.2. Product Strategy
19.3.10.6.3. Channel Strategy
20. Assumptions and Acronyms Used
21. Research Methodology
List of Tables
Table 1: Global Organic Shrimp Market Value (US$) Historical & Forecast by Species, 2014-2029
Table 2: Global Organic Shrimp Market Volume (MT) Historical & Forecast by Species, 2014-2029
Table 3: Global Organic Shrimp Market Value (US$ Mn) Historical & Forecast by Form, 2014-2029
Table 4: Global Organic Shrimp Market Volume (MT) Historical & Forecast by Form, 2014-2029
Table 5: Global Organic Shrimp Market Value (US$ Mn) Historical & Forecast by End Use, 2014-2029
Table 6: Global Organic Shrimp Market Volume (MT) Historical & Forecast by End Use, 2014-2029
Table 7: Global Organic Shrimp Market Value (US$) Historical & Forecast by Distribution Channel, 2014-2029
Table 8: Global Organic Shrimp Market Volume (MT) Historical & Forecast by Distribution Channel, 2014-2029
Table 9: Global Organic Shrimp Market Value (US$) Historical & Forecast by Region, 2014-2029
Table 10: Global Organic Shrimp Market Volume (MT) Historical & Forecast by Region, 2014-2029
Table 11: North America Organic Shrimp Market Value (US$) Historical & Forecast by Species, 2014-2029
Table 12: North America Organic Shrimp Market Volume (MT) Historical & Forecast by Species, 2014-2029
Table 13: North America Organic Shrimp Market Value (US$ Mn) Historical & Forecast by Form, 2014-2029
Table 14: North America Organic Shrimp Market Volume (MT) Historical & Forecast by Form, 2014-2029
Table 15: North America Organic Shrimp Market Value (US$ Mn) Historical & Forecast by End Use, 2014-2029
Table 16: North America Organic Shrimp Market Volume (MT) Historical & Forecast by End Use, 2014-2029
Table 17: North America Organic Shrimp Market Value (US$) Historical & Forecast by Distribution Channel, 2014-2029
Table 18: North America Organic Shrimp Market Volume (MT) Historical & Forecast by Distribution Channel, 2014-2029
Table 19: North America Organic Shrimp Market Value (US$) Historical & Forecast by Region, 2014-2029
Table 20: North America Organic Shrimp Market Volume (MT) Historical & Forecast by Region, 2014-2029
Table 21: Latin America Organic Shrimp Market Value (US$) Historical & Forecast by Species, 2014-2029
Table 22: Latin America Organic Shrimp Market Volume (MT) Historical & Forecast by Species, 2014-2029
Table 23: Latin America Organic Shrimp Market Value (US$ Mn) Historical & Forecast by Form, 2014-2029
Table 24: Latin America Organic Shrimp Market Volume (MT) Historical & Forecast by Form, 2014-2029
Table 25: Latin America Organic Shrimp Market Value (US$ Mn) Historical & Forecast by End Use, 2014-2029
Table 26: Latin America Organic Shrimp Market Volume (MT) Historical & Forecast by End Use, 2014-2029
Table 27: Latin America Organic Shrimp Market Value (US$) Historical & Forecast by Distribution Channel, 2014-2029
Table 28: Latin America Organic Shrimp Market Volume (MT) Historical & Forecast by Distribution Channel, 2014-2029
Table 29: Latin America Organic Shrimp Market Value (US$) Historical & Forecast by Region, 2014-2029
Table 30: Latin America Organic Shrimp Market Volume (MT) Historical & Forecast by Region, 2014-2029
Table 31: Europe Organic Shrimp Market Value (US$) Historical & Forecast by Species, 2014-2029
Table 32: Europe Organic Shrimp Market Volume (MT) Historical & Forecast by Species, 2014-2029
Table 33: Europe Organic Shrimp Market Value (US$ Mn) Historical & Forecast by Form, 2014-2029
Table 34: Europe Organic Shrimp Market Volume (MT) Historical & Forecast by Form, 2014-2029
Table 35: Europe Organic Shrimp Market Value (US$ Mn) Historical & Forecast by End Use, 2014-2029
Table 36: Europe Organic Shrimp Market Volume (MT) Historical & Forecast by End Use, 2014-2029
Table 37: Europe Organic Shrimp Market Value (US$) Historical & Forecast by Distribution Channel, 2014-2029
Table 38: Europe Organic Shrimp Market Volume (MT) Historical & Forecast by Distribution Channel, 2014-2029
Table 39: Europe Organic Shrimp Market Value (US$) Historical & Forecast by Region, 2014-2029
Table 40: Europe Organic Shrimp Market Volume (MT) Historical & Forecast by Region, 2014-2029
Table 41: Asia Pacific Organic Shrimp Market Value (US$) Historical & Forecast by Species, 2014-2029
Table 42: Asia Pacific Organic Shrimp Market Volume (MT) Historical & Forecast by Species, 2014-2029
Table 43: Asia Pacific Organic Shrimp Market Value (US$ Mn) Historical & Forecast by Form, 2014-2029
Table 44: Asia Pacific Organic Shrimp Market Volume (MT) Historical & Forecast by Form, 2014-2029
Table 45: Asia Pacific Organic Shrimp Market Value (US$ Mn) Historical & Forecast by End Use, 2014-2029
Table 46: Asia Pacific Organic Shrimp Market Volume (MT) Historical & Forecast by End Use, 2014-2029
Table 47: Asia Pacific Organic Shrimp Market Value (US$) Historical & Forecast by Distribution Channel, 2014-2029
Table 48: Asia Pacific Organic Shrimp Market Volume (MT) Historical & Forecast by Distribution Channel, 2014-2029
Table 49: Asia Pacific Organic Shrimp Market Value (US$) Historical & Forecast by Region, 2014-2029
Table 50: Latin America Organic Shrimp Market Volume (MT) Historical & Forecast by Region, 2014-2029
Table 51: Oceania Organic Shrimp Market Value (US$) Historical & Forecast by Species, 2014-2029
Table 52: Oceania Organic Shrimp Market Volume (MT) Historical & Forecast by Species, 2014-2029
Table 53: Oceania Organic Shrimp Market Value (US$ Mn) Historical & Forecast by Form, 2014-2029
Table 54: Oceania Organic Shrimp Market Volume (MT) Historical & Forecast by Form, 2014-2029
Table 55: Oceania Organic Shrimp Market Value (US$ Mn) Historical & Forecast by End Use, 2014-2029
Table 56: Oceania Organic Shrimp Market Volume (MT) Historical & Forecast by End Use, 2014-2029
Table 57: Oceania Organic Shrimp Market Value (US$) Historical & Forecast by Distribution Channel, 2014-2029
Table 58: Oceania Organic Shrimp Market Volume (MT) Historical & Forecast by Distribution Channel, 2014-2029
Table 59: Oceania Organic Shrimp Market Value (US$) Historical & Forecast by Region, 2014-2029
Table 60: Oceania Organic Shrimp Market Volume (MT) Historical & Forecast by Region, 2014-2029
Table 61: Middle East & Africa Organic Shrimp Market Value (US$) Historical & Forecast by Species, 2014-2029
Table 62: Middle East & Africa Organic Shrimp Market Volume (MT) Historical & Forecast by Species, 2014-2029
Table 63: Middle East & Africa Organic Shrimp Market Value (US$ Mn) Historical & Forecast by Form, 2014-2029
Table 64: Middle East & Africa Organic Shrimp Market Volume (MT) Historical & Forecast by Form, 2014-2029
Table 65: Middle East & Africa Organic Shrimp Market Value (US$ Mn) Historical & Forecast by End Use, 2014-2029
Table 66: Middle East & Africa Organic Shrimp Market Volume (MT) Historical & Forecast by End Use, 2014-2029
Table 67: Middle East & Africa Organic Shrimp Market Value (US$) Historical & Forecast by Distribution Channel, 2014-2029
Table 68: Middle East & Africa Organic Shrimp Market Volume (MT) Historical & Forecast by Distribution Channel, 2014-2029
Table 69: Middle East & Africa Organic Shrimp Market Value (US$) Historical & Forecast by Region, 2014-2029
Table 70: Middle East & Africa Organic Shrimp Market Volume (MT) Historical & Forecast by Region, 2014-2029
Table 71: Japan Organic Shrimp Market Value (US$) Historical & Forecast by Species, 2014-2029
Table 72: Japan Organic Shrimp Market Volume (MT) Historical & Forecast by Species, 2014-2029
Table 73: Japan Organic Shrimp Market Value (US$ Mn) Historical & Forecast by Form, 2014-2029
Table 74: Japan Organic Shrimp Market Volume (MT) Historical & Forecast by Form, 2014-2029
Table 75: Japan Organic Shrimp Market Value (US$ Mn) Historical & Forecast by End Use, 2014-2029
Table 76: Japan Organic Shrimp Market Volume (MT) Historical & Forecast by End Use, 2014-2029
Table 77: Japan Organic Shrimp Market Value (US$) Historical & Forecast by Distribution Channel, 2014-2029
Table 78: Japan Organic Shrimp Market Volume (MT) Historical & Forecast by Distribution Channel, 2014-2029
List of Figures
Figure 01: Global Organic Shrimp Market Value Share (%) and BPS Analysis by Species, 2014, 2019 & 2029
Figure 02: Global Organic Shrimp Market Y-o-Y Analysis by Species, 2019 & 2029
Figure 03: Global Organic Shrimp Market Attractiveness, by Species, 2019 to 2029
Figure 04: Global Organic Shrimp Market Value Share (%) and BPS Analysis by Form, 2014, 2019 & 2029
Figure 05: Global Organic Shrimp Market Y-o-Y Analysis by Form, 2019 & 2029
Figure 06: Global Organic Shrimp Market Attractiveness, by Form, 2019 to 2029
Figure 07: Global Organic Shrimp Market Value Share (%) and BPS Analysis by End Use, 2014, 2019 & 2029
Figure 08: Global Organic Shrimp Market Y-o-Y Analysis by End Use, 2019 & 2029
Figure 09: Global Organic Shrimp Market Attractiveness, by End Use, 2019 to 2029
Figure 10: Global Organic Shrimp Market Value Share (%) and BPS Analysis by Distribution Channel, 2014, 2019 & 2029
Figure 11: Global Organic Shrimp Market Y-o-Y Analysis by Distribution Channel, 2019 & 2029
Figure 12: Global Organic Shrimp Market Attractiveness, by Distribution Channel, 2019 to 2029
Figure 13: Global Organic Shrimp Market Value Share (%) and BPS Analysis by Region, 2014, 2019 & 2029
Figure 14: Global Organic Shrimp Market Y-o-Y Analysis by Region, 2019 & 2029
Figure 15: Global Organic Shrimp Market Attractiveness, by Region, 2019 to 2029
Figure 16: North America Organic Shrimp Market Value Share (%) and BPS Analysis by Species, 2014, 2019 & 2029
Figure 17: North America Organic Shrimp Market Y-o-Y Analysis by Species, 2019 & 2029
Figure 18: North America Organic Shrimp Market Attractiveness, by Species, 2019 to 2029
Figure 19: North America Organic Shrimp Market Value Share (%) and BPS Analysis by Form, 2014, 2019 & 2029
Figure 20: North America Organic Shrimp Market Y-o-Y Analysis by Form, 2019 & 2029
Figure 21: North America Organic Shrimp Market Attractiveness, by Form, 2019 to 2029
Figure 22: North America Organic Shrimp Market Value Share (%) and BPS Analysis by End Use, 2014, 2019 & 2029
Figure 23: North America Organic Shrimp Market Y-o-Y Analysis by End Use, 2019 & 2029
Figure 24: North America Organic Shrimp Market Attractiveness, by End Use, 2019 to 2029
Figure 25: North America Organic Shrimp Market Value Share (%) and BPS Analysis by Distribution Channel, 2014, 2019 & 2029
Figure 26: North America Organic Shrimp Market Y-o-Y Analysis by Distribution Channel, 2019 & 2029
Figure 27: North America Organic Shrimp Market Attractiveness, by Distribution Channel, 2019 to 2029
Figure 28: North America Organic Shrimp Market Value Share (%) and BPS Analysis by Region, 2014, 2019 & 2029
Figure 29: North America Organic Shrimp Market Y-o-Y Analysis by Region, 2019 & 2029
Figure 30: North America Organic Shrimp Market Attractiveness, by Region, 2019 to 2029
Figure 31: Latin America Organic Shrimp Market Value Share (%) and BPS Analysis by Species, 2014, 2019 & 2029
Figure 32: Latin America Organic Shrimp Market Y-o-Y Analysis by Species, 2019 & 2029
Figure 33: Latin America Organic Shrimp Market Attractiveness, by Species, 2019 to 2029
Figure 34: Latin America Organic Shrimp Market Value Share (%) and BPS Analysis by Form, 2014, 2019 & 2029
Figure 35: Latin America Organic Shrimp Market Y-o-Y Analysis by Form, 2019 & 2029
Figure 36: Latin America Organic Shrimp Market Attractiveness, by Form, 2019 to 2029
Figure 37: Latin America Organic Shrimp Market Value Share (%) and BPS Analysis by End Use, 2014, 2019 & 2029
Figure 38: Latin America Organic Shrimp Market Y-o-Y Analysis by End Use, 2019 & 2029
Figure 39: Latin America Organic Shrimp Market Attractiveness, by End Use, 2019 to 2029
Figure 40: Latin America Organic Shrimp Market Value Share (%) and BPS Analysis by Distribution Channel, 2014, 2019 & 2029
Figure 41: Latin America Organic Shrimp Market Y-o-Y Analysis by Distribution Channel, 2019 & 2029
Figure 42: Latin America Organic Shrimp Market Attractiveness, by Distribution Channel, 2019 to 2029
Figure 43: Latin America Organic Shrimp Market Value Share (%) and BPS Analysis by Region, 2014, 2019 & 2029
Figure 44: Latin America Organic Shrimp Market Y-o-Y Analysis by Region, 2019 & 2029
Figure 45: Latin America Organic Shrimp Market Attractiveness, by Region, 2019 to 2029
Figure 46: Europe Organic Shrimp Market Value Share (%) and BPS Analysis by Species, 2014, 2019 & 2029
Figure 47: Europe Organic Shrimp Market Y-o-Y Analysis by Species, 2019 & 2029
Figure 48: Europe Organic Shrimp Market Attractiveness, by Species, 2019 to 2029
Figure 49: Europe Organic Shrimp Market Value Share (%) and BPS Analysis by Form, 2014, 2019 & 2029
Figure 50: Europe Organic Shrimp Market Y-o-Y Analysis by Form, 2019 & 2029
Figure 51: Europe Organic Shrimp Market Attractiveness, by Form, 2019 to 2029
Figure 52: Europe Organic Shrimp Market Value Share (%) and BPS Analysis by End Use, 2014, 2019 & 2029
Figure 53: Europe Organic Shrimp Market Y-o-Y Analysis by End Use, 2019 & 2029
Figure 54: Europe Organic Shrimp Market Attractiveness, by End Use, 2019 to 2029
Figure 55: Europe Organic Shrimp Market Value Share (%) and BPS Analysis by Distribution Channel, 2014, 2019 & 2029
Figure 56: Europe Organic Shrimp Market Y-o-Y Analysis by Distribution Channel, 2019 & 2029
Figure 57: Europe Organic Shrimp Market Attractiveness, by Distribution Channel, 2019 to 2029
Figure 58: Europe Organic Shrimp Market Value Share (%) and BPS Analysis by Region, 2014, 2019 & 2029
Figure 59: Europe Organic Shrimp Market Y-o-Y Analysis by Region, 2019 & 2029
Figure 60: Europe Organic Shrimp Market Attractiveness, by Region, 2019 to 2029
Figure 61: Asia Pacific Organic Shrimp Market Value Share (%) and BPS Analysis by Species, 2014, 2019 & 2029
Figure 62: Asia Pacific Organic Shrimp Market Y-o-Y Analysis by Species, 2019 & 2029
Figure 63: Asia Pacific Organic Shrimp Market Attractiveness, by Species, 2019 to 2029
Figure 64: Asia Pacific Organic Shrimp Market Value Share (%) and BPS Analysis by Form, 2014, 2019 & 2029
Figure 65: Asia Pacific Organic Shrimp Market Y-o-Y Analysis by Form, 2019 & 2029
Figure 66: Asia Pacific Organic Shrimp Market Attractiveness, by Form, 2019 to 2029
Figure 67: Asia Pacific Organic Shrimp Market Value Share (%) and BPS Analysis by End Use, 2014, 2019 & 2029
Figure 68: Asia Pacific Organic Shrimp Market Y-o-Y Analysis by End Use, 2019 & 2029
Figure 69: Asia Pacific Organic Shrimp Market Attractiveness, by End Use, 2019 to 2029
Figure 70: Asia Pacific Organic Shrimp Market Value Share (%) and BPS Analysis by Distribution Channel, 2014, 2019 & 2029
Figure 71: Asia Pacific Organic Shrimp Market Y-o-Y Analysis by Distribution Channel, 2019 & 2029
Figure 72: Asia Pacific Organic Shrimp Market Attractiveness, by Distribution Channel, 2019 to 2029
Figure 73: Asia Pacific Organic Shrimp Market Value Share (%) and BPS Analysis by Region, 2014, 2019 & 2029
Figure 74: Asia Pacific Organic Shrimp Market Y-o-Y Analysis by Region, 2019 & 2029
Figure 75: Asia Pacific Organic Shrimp Market Attractiveness, by Region, 2019 to 2029
Figure 76: Oceania Organic Shrimp Market Value Share (%) and BPS Analysis by Species, 2014, 2019 & 2029
Figure 77: Oceania Organic Shrimp Market Y-o-Y Analysis by Species, 2019 & 2029
Figure 78: Oceania Organic Shrimp Market Attractiveness, by Species, 2019 to 2029
Figure 79: Oceania Organic Shrimp Market Value Share (%) and BPS Analysis by Form, 2014, 2019 & 2029
Figure 80: Oceania Organic Shrimp Market Y-o-Y Analysis by Form, 2019 & 2029
Figure 81: Oceania Organic Shrimp Market Attractiveness, by Form, 2019 to 2029
Figure 82: Oceania Organic Shrimp Market Value Share (%) and BPS Analysis by End Use, 2014, 2019 & 2029
Figure 83: Oceania Organic Shrimp Market Y-o-Y Analysis by End Use, 2019 & 2029
Figure 84: Oceania Organic Shrimp Market Attractiveness, by End Use, 2019 to 2029
Figure 85: Oceania Organic Shrimp Market Value Share (%) and BPS Analysis by Distribution Channel, 2014, 2019 & 2029
Figure 86: Oceania Organic Shrimp Market Y-o-Y Analysis by Distribution Channel, 2019 & 2029
Figure 87: Oceania Organic Shrimp Market Attractiveness, by Distribution Channel, 2019 to 2029
Figure 88: Oceania Organic Shrimp Market Value Share (%) and BPS Analysis by Region, 2014, 2019 & 2029
Figure 89: Oceania Organic Shrimp Market Y-o-Y Analysis by Region, 2019 & 2029
Figure 90: Oceania Organic Shrimp Market Attractiveness, by Region, 2019 to 2029
Figure 91: MEA Organic Shrimp Market Value Share (%) and BPS Analysis by Species, 2014, 2019 & 2029
Figure 92: MEA Organic Shrimp Market Y-o-Y Analysis by Species, 2019 & 2029
Figure 93: MEA Organic Shrimp Market Attractiveness, by Species, 2019 to 2029
Figure 94: MEA Organic Shrimp Market Value Share (%) and BPS Analysis by Form, 2014, 2019 & 2029
Figure 95: MEA Organic Shrimp Market Y-o-Y Analysis by Form, 2019 & 2029
Figure 96: MEA Organic Shrimp Market Attractiveness, by Form, 2019 to 2029
Figure 97: MEA Organic Shrimp Market Value Share (%) and BPS Analysis by End Use, 2014, 2019 & 2029
Figure 98: MEA Organic Shrimp Market Y-o-Y Analysis by End Use, 2019 & 2029
Figure 99: MEA Organic Shrimp Market Attractiveness, by End Use, 2019 to 2029
Figure 100: MEA Organic Shrimp Market Value Share (%) and BPS Analysis by Distribution Channel, 2014, 2019 & 2029
Figure 101: MEA Organic Shrimp Market Y-o-Y Analysis by Distribution Channel, 2019 & 2029
Figure 102: MEA Organic Shrimp Market Attractiveness, by Distribution Channel, 2019 to 2029
Figure 103: MEA Organic Shrimp Market Value Share (%) and BPS Analysis by Region, 2014, 2019 & 2029
Figure 104: MEA Organic Shrimp Market Y-o-Y Analysis by Region, 2019 & 2029
Figure 105: MEA Organic Shrimp Market Attractiveness, by Region, 2019 to 2029
Figure 106: Japan Organic Shrimp Market Value Share (%) and BPS Analysis by Species, 2014, 2019 & 2029
Figure 107: Japan Organic Shrimp Market Y-o-Y Analysis by Species, 2019 & 2029
Figure 108: Japan Organic Shrimp Market Attractiveness, by Species, 2019 to 2029
Figure 109: Japan Organic Shrimp Market Value Share (%) and BPS Analysis by Form, 2014, 2019 & 2029
Figure 110: Japan Organic Shrimp Market Y-o-Y Analysis by Form, 2019 & 2029
Figure 111: Japan Organic Shrimp Market Attractiveness, by Form, 2019 to 2029
Figure 112: Japan Organic Shrimp Market Value Share (%) and BPS Analysis by End Use, 2014, 2019 & 2029
Figure 113: Japan Organic Shrimp Market Y-o-Y Analysis by End Use, 2019 & 2029
Figure 114: Japan Organic Shrimp Market Attractiveness, by End Use, 2019 to 2029
Figure 115: Japan Organic Shrimp Market Value Share (%) and BPS Analysis by Distribution Channel, 2014, 2019 & 2029
Figure 116: Japan Organic Shrimp Market Y-o-Y Analysis by Distribution Channel, 2019 & 2029
Figure 117: Japan Organic Shrimp Market Attractiveness, by Distribution Channel, 2019 to 2029
Copyright © Transparency Market Research, Inc. All Rights reserved
Trust Online

Organic Shrimp Market