
Reports
Reports
The need to differentiate active and inactive components in drugs has helped in popularising oncology biosimilars. Research analysts can differentiate drugs on the basis of their inactive components, even when the reference component or drugs remains the same. The importance of oncology biosimilars that can have different actions on cancers of various types has helped in reconciling the growth dynamics of the market. The tremendous relevance of biosimilar therapies for cancer has also helped researchers in emphasizing on the importance of oncology biosimilars.
The Food and Drugs Administration (FDA) in the US has been at the forefront of growth within the global oncology biosimilars market. Approval of several biosimilars by the FDA have been helpful for research entities and organizations. Post 2015, FDA has been actively approving oncology biosimilars, a trend that is expected to gather momentum in the times to follow. filgrastim-sndz (Zarxio) and Bevacizumab-awwb (Mvasi) are two important biosimilars that were lately approved by the FDA. It would be interesting to see the impact of increased pace of approvals on market maturity.
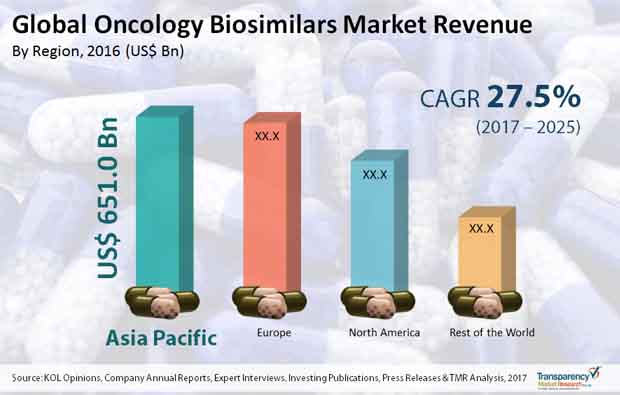
In this preview, several trends, opportunities, and segments pertaining the global oncology biosimilars market have been discussed. The presence of a seamless medical industry that focuses on developing treatment lines for cancer is an important consideration from the standpoint of market analysis. In addition to this, several University scholars have tasted success in developing possible treatment lines for cancer. TMR predicts that the global oncology biosimilars market would grow at a humongous CAGR of 27.5% over the period between 2017 and 2025. The voluminous growth rate can be attributed to investments made in cancer research and analysis. Furthermore, the total worth of the global oncology biosimilars market is set to touch US$17,478.2 mn by 2025-end.
Treatment of Breast Cancer Takes Center Stage Medicine
The global oncology biosimilars market consists of a complex of net of end-uses and applications. Based on disease indication, oncology biosimilars can be segmented into breast cancer, colorectal cancer, neutropenia, lung cancer, and blood cancer. Amongst these, the demand for oncology biosimilars in treating and understanding breast cancer has increased by a dramatic chase. Besides, rising incidence of leukaemia has played to the advantage of the market vendors.
Rising incidence of various types of cancers plays an integral role in driving sales across the global oncology biosimilars market. Clinical research related to oncology has gathered momentum in recent times, and this trend has reflected in the development of several distinct drugs. Research related to leukaemia has especially attracted increased attention from medical researchers. Considering the factors mentioned above, it is safe to predict that the global oncology biosimilars market would gain momentum in the years to follow. Advancements in drug development and analysis of active ingredients in drugs is also an important consideration from the perspective of market growth. Biologic drugs are gradually becoming an important component of the pharmaceutical industry. These drugs are poised to account for a major share of drugs mix produced by the industry.
Regional Dynamics of the Global Oncology Biosimilars Market
On the basis of regions, the global oncology biosimilars market can be segmented into Latin America, North America, Europe, Asia Pacific, and the Middle East and Africa. Investments in cancer research, especially across the UK, are central to the idea of market growth in Europe. Recently, scholars from Cardiff University discovered a potential cure for bodily cancers. The North America oncology biosimilars market is set to expand as new research centers and laboratories emerge in the region.
Some of the leading vendors in the global oncology biosimilars market are Dr. Reddy’s Laboratories Ltd., Intas Pharmaceuticals Ltd., STADA Arzneimittel AG, Pfizer Inc., and Sandoz International GmbH.
Booming Cases of Cancer around the World to Accelerate the Growth Opportunities across the Oncology Biosimilars Market
The oncology biosimilars market is expected to witness a considerable growth-share owing to the rising number of cancer cases across the globe. The increasing number of cancer cases around the world will serve as a vital growth generator for the oncology biosimilars market.
Section 01 Preface
1.1 Market Definition and Scope
1.2 Research Highlights
Section 02 Assumptions and Research Methodology
2.1 Assumptions & Acronyms Used
2.2 Research Methodology
Section 03 Executive Summary: Global Oncology Biosimilars Market
3.1 Executive Summary
3.2 Market Opportunity Map
3.3 Market Overview
3.4 Key Industry Developments
3.5 Global Oncology Biosimilars Market Size (US$ Mn) Forecast, 2015–2025
3.6 Global Oncology Biosimilars Market Outlook
Section 04 Market Dynamics
4.1 Drivers
4.2 Restraints
4.3 Opportunity
4.4 Key Trends
Section 05 Porter’s Five Force Analysis
Section 06 Oncology Biosimilars: Key Molecules
Section 07 Biosimilars Market Snapshot
Section 08 Cancer Statistics
Section 09 Global Oncology Biosimilars Market Analysis and Forecasts, By Drug Class
9.1 Introduction & Definition
9.2 Key Findings
9.3 Global Oncology Biosimilars Market Value Share, by Drug Class, 2017 and 2025
9.4 Market Attractiveness By Drug Class
9.5 Global Oncology Biosimilars Market Forecast, by Drug Class, 2015-2025
9.5.1 G-CSF
9.5.2 Monoclonal Antibody
9.5.3 Hematopoietic Agents
9.6 Global Oncology Biosimilars Market Analysis, by Drug Class, 2015-2025
9.7 Key Trends
Section 10 Global Oncology Biosimilars Market Analysis and Forecasts, By Disease Indication
10.1 Introduction & Definition
10.2 Key Findings
10.3 Global Oncology Biosimilars Market Value Share, by Disease Indication, 2017 and 2025
10.4 Market Attractiveness By Disease Indication
10.5 Global Oncology Biosimilars Market Forecast, by Disease Indication, 2015-2025
10.5.1 Breast Cancer
10.5.2 Non-Small Cell lung Cancer
10.5.3 Blood Cancer
10.5.3.1 Leukemia
10.5.3.1.1 Myeloid Leukemia
10.5.3.1.2 Chronic Lymphocytic Leukemia
10.5.3.1.3 Others
10.5.3.2 Non-Hodgkin Lymphoma
10.5.4 Colorectal Cancer
10.5.5 Neutropenia
10.5.6 Others
10.6 Global Oncology Biosimilars Market Analysis, by Disease Indication, 2015-2025
10.7 Key Trends
Section 11 Global Oncology Biosimilars Market Analysis and Forecasts, By Distribution Channel
11.1 Introduction & Definition
11.2 Key Findings
11.3 Global Oncology Biosimilars Market Value Share, by Distribution Channel, 2017 and 2025
11.4 Market Attractiveness By Distribution Channel
11.5 Global Oncology Biosimilars Market Forecast, by Distribution Channel, 2015-2025
11.5.1 Hospital Pharmacy
11.5.2 Online Pharmacy
11.5.3 Retail Pharmacy
11.6 Global Oncology Biosimilars Market Analysis, by Distribution Channel, 2015-2025
11.7 Key Trends
Section 12 Global Oncology Biosimilars Market Analysis and Forecasts, By Region
12.1 Global Market Scenario
12.2 Global Oncology Biosimilars Market Value Share, by Region, 2017 and 2025
12.3 Global Oncology Biosimilars Market Attractiveness, by Region, 2017–2025
12.4 Global Oncology Biosimilars Market Size (US$ Mn) Forecast, by Region, 2015–2025
12.4.1 North America
12.4.2 Europe
12.4.3 Asia Pacific
12.4.4 Rest of the World
Section 13 North America Oncology Biosimilars Market Analysis and Forecast
13.1 North America Oncology Biosimilars Market Revenue (US$ Mn) and Y-o-Y Growth (%) Forecast, 2015–2025
13.2 North America Oncology Biosimilars Market Value Share, by Country, 2017 and 2025
13.3 North America Oncology Biosimilars Market Attractiveness, by Country, 2017–2025
13.4 North America Oncology Biosimilars Market Size (US$ Mn) Forecast, by Country, 2015–2025
13.4.1 U.S.
13.4.2 Canada
13.5 North America Oncology Biosimilars Market Value Share, by Drug Class, 2017 and 2025
13.6 North America Oncology Biosimilars Market Attractiveness, by Drug Class, 2017–2025
13.7 North America Oncology Biosimilars Market Size (US$ Mn) Forecast, by Drug Class, 2015–2025
13.7.1 G-CSF
13.7.2 Monoclonal Antibody
13.7.3 Hematopoietic Agents
13.8 North America Oncology Biosimilars Market Value Share, by Disease Indication, 2017 and 2025
13.9 North America Oncology Biosimilars Market Attractiveness, by Disease Indication, 2017–2025
13.10 North America Oncology Biosimilars Market Size (US$ Mn) Forecast, by Disease Indication, 2015–2025
13.10.1 Breast Cancer
13.10.2 Non-Small Cell lung Cancer
13.10.3 Blood Cancer
13.10.3.1 Leukemia
13.10.3.1.1 Myeloid Leukemia
13.10.3.1.2 Chronic Lymphocytic Leukemia
13.10.3.1.3 Others
13.10.3.2 Non-Hodgkin Lymphoma
13.10.4 Colorectal Cancer
13.10.5 Neutropenia
13.10.6 Others
13.11 North America Oncology Biosimilars Market Value Share, by Distribution Channel, 2017 and 2025
13.12 North America Oncology Biosimilars Market Attractiveness, by Distribution Channel, 2017–2025
13.13 North America Oncology Biosimilars Market Size (US$ Mn) Forecast, by Distribution Channel, 2015–2025
13.13.1 Hospital Pharmacy
13.13.2 Online Pharmacy
13.13.3 Retail Pharmacy
13.14 Key Trends
Section 14 Europe Oncology Biosimilars Market Analysis and Forecast
14.1 Europe Oncology Biosimilars Market Revenue (US$ Mn) and Y-o-Y Growth (%) Forecast, 2015–2025
14.2 Europe Oncology Biosimilars Market Value Share, by Country, 2017 and 2025
14.3 Europe Oncology Biosimilars Market Attractiveness, by Country, 2017–2025
14.4 Europe Oncology Biosimilars Market Size (US$ Mn) Forecast, by Country, 2015–2025
14.4.1 U.K.
14.4.2 Germany
14.4.3 France
14.4.4 Italy
14.4.5 Russia
14.4.6 Spain
14.4.7 Rest of Europe
14.5 Europe Oncology Biosimilars Market Value Share, by Drug Class, 2017 and 2025
14.6 Europe Oncology Biosimilars Market Attractiveness, by Drug Class, 2017–2025
14.7 Europe Oncology Biosimilars Market Size (US$ Mn) Forecast, by Drug Class, 2015–2025
14.7.1 G-CSF
14.7.2 Monoclonal Antibody
14.7.3 Hematopoietic Agents
14.8 Europe Oncology Biosimilars Market Value Share, by Disease Indication, 2017 and 2025
14.9 Europe Oncology Biosimilars Market Attractiveness, by Disease Indication, 2017–2025
14.10 Europe Oncology Biosimilars Market Size (US$ Mn) Forecast, by Disease Indication, 2015–2025
14.10.1 Breast Cancer
14.10.2 Non-Small Cell lung Cancer
14.10.3 Blood Cancer
14.10.3.1 Leukemia
14.10.3.1.1 Myeloid Leukemia
14.10.3.1.2 Chronic Lymphocytic Leukemia
14.10.3.1.3 Others
14.10.3.2 Non-Hodgkin Lymphoma
14.10.4 Colorectal Cancer
14.10.5 Neutropenia
14.10.6 Others
14.11 Europe Oncology Biosimilars Market Value Share, by Distribution Channel, 2017 and 2025
14.12 Europe Oncology Biosimilars Market Attractiveness, by Distribution Channel, 2017–2025
14.13 Europe Oncology Biosimilars Market Size (US$ Mn) Forecast, by Distribution Channel, 2015–2025
14.13.1 Hospital Pharmacy
14.13.2 Online Pharmacy
14.13.3 Retail Pharmacy
14.14 Key Trends
Section 15 Asia Pacific Oncology Biosimilars Market Analysis and Forecast
15.1 Asia Pacific Oncology Biosimilars Market Revenue (US$ Mn) and Y-o-Y Growth (%) Forecast, 2015–2025
15.2 Asia Pacific Oncology Biosimilars Market Value Share, by Country, 2017 and 2025
15.3 Asia Pacific Oncology Biosimilars Market Attractiveness, by Country, 2017–2025
15.4 Asia Pacific Oncology Biosimilars Market Size (US$ Mn) Forecast, by Country, 2015–2025
15.4.1 China
15.4.2 India
15.4.3 Japan
15.4.4 Australia & New Zealand
15.4.5 Rest of Asia Pacific
15.5 Asia Pacific Oncology Biosimilars Market Value Share, by Drug Class, 2017 and 2025
15.6 Asia Pacific Oncology Biosimilars Market Attractiveness, by Drug Class, 2017–2025
15.7 Asia Pacific Oncology Biosimilars Market Size (US$ Mn) Forecast, by Drug Class, 2015–2025
15.7.1 G-CSF
15.7.2 Monoclonal Antibody
15.7.3 Hematopoietic Agents
15.8 Asia Pacific Oncology Biosimilars Market Value Share, by Disease Indication, 2017 and 2025
15.9 Asia Pacific Oncology Biosimilars Market Attractiveness, by Disease Indication, 2017–2025
15.10 Asia Pacific Oncology Biosimilars Market Size (US$ Mn) Forecast, by Disease Indication, 2015–2025
15.10.1 Breast Cancer
15.10.2 Non-Small Cell lung Cancer
15.10.3 Blood Cancer
15.10.3.1 Leukemia
15.10.3.1.1 Myeloid Leukemia
15.10.3.1.2 Chronic Lymphocytic Leukemia
15.10.3.1.3 Others
15.10.3.2 Non-Hodgkin Lymphoma
15.10.4 Colorectal Cancer
15.10.5 Neutropenia
15.10.6 Others
15.11 Asia Pacific Oncology Biosimilars Market Value Share, by Distribution Channel, 2017 and 2025
15.12 Asia Pacific Oncology Biosimilars Market Attractiveness, by Distribution Channel, 2017–2025
15.13 Asia Pacific Oncology Biosimilars Market Size (US$ Mn) Forecast, by Distribution Channel, 2015–2025
15.13.1 Hospital Pharmacy
15.13.2 Online Pharmacy
15.13.3 Retail Pharmacy
15.14 Key Trends
Section 16 Rest of the World Oncology Biosimilars Market Analysis and Forecast
16.1 Rest of the World Oncology Biosimilars Market Revenue (US$ Mn) and Y-o-Y Growth (%) Forecast, 2015–2025
16.2 Rest of the World Oncology Biosimilars Market Value Share, by Country, 2017 and 2025
16.3 Rest of the World Oncology Biosimilars Market Attractiveness, by Country, 2017–2025
16.4 Rest of the World Oncology Biosimilars Market Size (US$ Mn) Forecast, by Country, 2015–2025
16.4.1 Mexico
16.4.2 Brazil
16.4.3 Rest of the World
16.5 Rest of the World Oncology Biosimilars Market Value Share, by Drug Class, 2017 and 2025
16.6 Rest of the World Oncology Biosimilars Market Attractiveness, by Drug Class, 2017–2025
16.7 Rest of the World Oncology Biosimilars Market Size (US$ Mn) Forecast, by Drug Class, 2015–2025
16.7.1 G-CSF
16.7.2 Monoclonal Antibody
16.7.3 Hematopoietic Agents
16.8 Rest of the World Oncology Biosimilars Market Value Share, by Disease Indication, 2017 and 2025
16.9 Rest of the World Oncology Biosimilars Market Attractiveness, by Disease Indication, 2017–2025
16.10 Rest of the World Oncology Biosimilars Market Size (US$ Mn) Forecast, by Disease Indication, 2015–2025
16.10.1 Breast Cancer
16.10.2 Non-Small Cell lung Cancer
16.10.3 Blood Cancer
16.10.3.1 Leukemia
16.10.3.1.1 Myeloid Leukemia
16.10.3.1.2 Chronic Lymphocytic Leukemia
16.10.3.1.3 Others
16.10.3.2 Non-Hodgkin Lymphoma
16.10.4 Colorectal Cancer
16.10.5 Neutropenia
16.10.6 Others
16.11 Rest of the World Oncology Biosimilars Market Value Share, by Distribution Channel, 2017 and 2025
16.12 Rest of the World Oncology Biosimilars Market Attractiveness, by Distribution Channel, 2017–2025
16.13 Rest of the World Oncology Biosimilars Market Size (US$ Mn) Forecast, by Distribution Channel, 2015–2025
16.13.1 Hospital Pharmacy
16.13.2 Online Pharmacy
16.13.3 Retail Pharmacy
16.14 Key Trends
Section 17 Competition Landscape
17.1 Market Player – Competition Matrix (By Tier and Size of companies)
17.2 Market Share Analysis By Company (2016)
Section 18 Company Profiles
18.1 Sandoz International GmbH
18.1.1 Company Details
18.1.2 Business Overview
18.1.3 Financial Overview
18.1.4 Strategic Overview
18.1.5 SWOT Analysis
18.2 Pfizer, Inc.
18.2.1 Company Details
18.2.2 Business Overview
18.2.3 Financial Overview
18.2.4 Strategic Overview
18.2.5 SWOT Analysis
18.3 Celltrion Inc.
18.3.1 Company Details
18.3.2 Business Overview
18.3.3 Financial Overview
18.3.4 Strategic Overview
18.3.5 SWOT Analysis
18.4 Dr. Reddy’s Laboratories Ltd.
18.4.1 Company Details
18.4.2 Business Overview
18.4.3 Financial Overview
18.4.4 Strategic Overview
18.4.5 SWOT Analysis
18.5 Biocon
18.5.1 Company Details
18.5.2 Business Overview
18.5.3 Financial Overview
18.5.4 Strategic Overview
18.5.5 SWOT Analysis
18.6 Teva Pharmaceutical Industries Ltd.
18.6.1 Company Details
18.6.2 Business Overview
18.6.3 Financial Overview
18.6.4 Strategic Overview
18.6.5 SWOT Analysis
18.7 STADA Arzneimittel AG
18.7.1 Company Details
18.7.2 Business Overview
18.7.3 Financial Overview
18.7.4 Strategic Overview
18.7.5 SWOT Analysis
18.8 Apotex Inc. (Apobiologix)
18.8.1 Company Details
18.8.2 Business Overview
18.8.3 Financial Overview
18.8.4 Strategic Overview
18.8.5 SWOT Analysis
18.9 Intas Pharmaceuticals Ltd.
18.9.1 Company Details
18.9.2 Business Overview
18.9.3 Financial Overview
18.9.4 Strategic Overview
18.9.5 SWOT Analysis
18.10 BIOCAD
18.10.1 Company Details
18.10.2 Business Overview
18.10.3 Financial Overview
18.10.4 Strategic Overview
18.10.5 SWOT Analysis
List of Tables
Table 01 Global Biosimilars Market Snapshot
Table 02 Global Oncology Biosimilars Market Size (US$ Mn) Forecast, by Drug Class, 2015–2025
Table 03 Global Oncology Biosimilars Market Size (US$ Mn) Forecast, by Disease Indication, 2015–2025
Table 04 Global Oncology Biosimilars Market Size (US$ Mn) Forecast, Blood Cancer, 2015–2025
Table 05 Global Oncology Biosimilars Market Size (US$ Mn) Forecast, by Leukemia, 2015–2025
Table 06 Global Oncology Biosimilars Market Size (US$ Mn) Forecast, by Distribution Channel, 2015–2025
Table 07 Global Oncology Biosimilars Market Size (US$ Mn) Forecast, by Region, 2015–2025
Table 08 Approved Oncology Biosimilars by USFDA in new biosimilars pathway established under BPCIA Act
Table 09 North America Oncology Biosimilars: Pipeline Overview, 2017-2020
Table 10 North America Oncology Biosimilars Market Size (US$ Mn) Forecast, by Country, 2015–2025
Table 11 North America Oncology Biosimilars Market Size (US$ Mn) Forecast, by Distribution Channel, 2015–2025
Table 12 Europe Oncology Biosimilars Market Size (US$ Mn) Forecast, by Country, 2015–2025
Table 13 Europe Oncology Biosimilars Market Size (US$ Mn) Forecast, by Drug Class, 2015–2025
Table 14 Europe Oncology Biosimilars Market Size (US$ Mn) Forecast, by Disease Indication, 2015–2025
Table 15 Europe Oncology Biosimilars Market Size (US$ Mn) Forecast, by Blood Cancer, 2015–2025
Table 16 Europe Oncology Biosimilars Market Size (US$ Mn) Forecast, by Leukemia, 2015–2025
Table 17 Europe Oncology Biosimilars Market Size (US$ Mn) Forecast, by Distribution Channel, 2015–2025
Table 18 Asia Pacific Oncology Biosimilars Market Size (US$ Mn) Forecast, by Country, 2015–2025
Table 19 Asia Pacific Oncology Biosimilars Market Size (US$ Mn) Forecast, by Drug Class, 2015–2025
Table 20 Asia Pacific Oncology Biosimilars Market Size (US$ Mn) Forecast, by Disease Indication, 2015–2025
Table 21 Asia Pacific Oncology Biosimilars Market Size (US$ Mn) Forecast, by Blood Cancer, 2015–2025
Table 22 Asia Pacific Oncology Biosimilars Market Size (US$ Mn) Forecast, by Leukemia, 2015–2025
Table 23 Asia Pacific Oncology Biosimilars Market Size (US$ Mn) Forecast, by Distribution Channel, 2015–2025
Table 24 Rest of the World Oncology Biosimilars Market Size (US$ Mn) Forecast, by Country, 2015–2025
Table 25 Rest of the World Oncology Biosimilars Market Size (US$ Mn) Forecast, Drug Class, 2015–2025
Table 26 Rest of the World Oncology Biosimilars Market Size (US$ Mn) Forecast, by Disease Indication, 2015–2025
Table 27 Rest of the World Oncology Biosimilars Market Size (US$ Mn) Forecast, by Blood Cancer, 2015–2025
Table 28 Rest of the World Oncology Biosimilars Market Size (US$ Mn) Forecast, by Leukemia, 2015–2025
Table 29 Rest of the World Oncology Biosimilars Market Size (US$ Mn) Forecast, by Distribution Channel, 2015–2025
List of Figures
Fig. 01 Global Oncology Biosimilars Market Size (US$ Mn) Forecast, 2015–2025
Fig. 02 Global Oncology Biosimilars Market Value Share, by Drug Class (2016)
Fig. 03 Global Oncology Biosimilars Market Value Share, by Disease Indication (2016)
Fig. 04 Global Oncology Biosimilars Market Value Share, by Distribution Channel (2016)
Fig. 05 Global Oncology Biosimilars Market Value Share, by Region (2016)
Fig. 06 U.S. Prevalence Share (%), By Cancer Type, 2015
Fig. 07 Global Estimation of Cancer, By New Cases & Deaths, 2017
Fig. 08 Global Oncology Biosimilars Market Value Share, by Drug Class, 2017 and 2025
Fig. 09 Global Oncology Biosimilars Market Attractiveness, by Drug Class, 2017–2025
Fig. 10 Global Oncology Biosimilars Market Revenue (US$ Mn) and Y-o-Y Growth (%) Forecast, by Monoclonal Antibody, 2015–2025
Fig. 11 Global Oncology Biosimilars Market Revenue (US$ Mn) and Y-o-Y Growth (%) Forecast, by Hematopoietic Agents, 2015–2025
Fig. 12 Global Oncology Biosimilars Market Revenue (US$ Mn) and Y-o-Y Growth (%) Forecast, by G-CSF, 2015–2025
Fig. 13 Global Oncology Biosimilars Market Value Share, by Disease Indication, 2017 and 2025
Fig. 14 Global Oncology Biosimilars Market Attractiveness, by Disease Indication, 2017–2025
Fig. 15 Global Oncology Biosimilars Market Revenue (US$ Mn) and Y-o-Y Growth (%) Forecast, by Breast Cancer, 2015–2025
Fig. 16 Global Oncology Biosimilars Market Revenue (US$ Mn) and Y-o-Y Growth (%) Forecast, by Non-small Cell Lung Cancer, 2015–2025
Fig. 17 Global Oncology Biosimilars Market Revenue (US$ Mn) and Y-o-Y Growth (%) Forecast, by Blood Cancer, 2015–2025
Fig. 18 Global Oncology Biosimilars Market Revenue (US$ Mn) and Y-o-Y Growth (%) Forecast, by Colorectal Cancer, 2015–2025
Fig. 19 Global Oncology Biosimilars Market Revenue (US$ Mn) and Y-o-Y Growth (%) Forecast, by Neutropenia, 2015–2025
Fig. 20 Global Oncology Biosimilars Market Revenue (US$ Mn) and Y-o-Y Growth (%) Forecast, by Others, 2015–2025
Fig. 21 Global Oncology Biosimilars Market Value Share, by Distribution Channel, 2017 and 2025
Fig. 22 Global Oncology Biosimilars Market Attractiveness, by Distribution Channel, 2017–2025
Fig. 23 Global Oncology Biosimilars Market Revenue (US$ Mn) and Y-o-Y Growth (%) Forecast, by Online Pharmacy, 2015–2025
Fig. 24 Global Oncology Biosimilars Market Revenue (US$ Mn) and Y-o-Y Growth (%) Forecast, by Retail Pharmacy, 2015–2025
Fig. 25 Global Oncology Biosimilars Market Revenue (US$ Mn) and Y-o-Y Growth (%) Forecast, by Hospital Pharmacy, 2015–2025
Fig. 26 Global Oncology Biosimilars Market Value Share, by Region, 2017 and 2025
Fig. 27 Global Oncology Biosimilars Market Attractiveness, by Region, 2017–2025
Fig. 28 North America Oncology Biosimilars Market Revenue (US$ Mn) and Y-o-Y Growth (%) Forecast, 2015–2025
Fig. 29 North America Oncology Biosimilars Market Value Share, by Country, 2017 and 2025
Fig. 30 North America Oncology Biosimilars Market Attractiveness, by Country, 2017–2025
Fig. 31 North America Oncology Biosimilars Market Value Share, by Distribution Channel, 2017 and 2025
Fig. 32 North America Oncology Biosimilars Market Attractiveness, by Distribution Channel, 2017–2025
Fig. 33 Europe Oncology Biosimilars Market Revenue (US$ Mn) and Y-o-Y Growth (%) Forecast, 2015–2025
Fig. 34 Europe Oncology Biosimilars Market Value Share, by Country, 2017 and 2025
Fig. 35 Europe Oncology Biosimilars Market Attractiveness, by Country, 2017–2025
Fig. 36 Europe Oncology Biosimilars Market Value Share, by Drug Class, 2017 and 2025
Fig. 37 Europe Oncology Biosimilars Market Attractiveness, by Drug Class, 2017–2025
Fig. 38 Europe Oncology Biosimilars Market Value Share, by Disease Indication, 2017 and 2025
Fig. 39 Europe Oncology Biosimilars Market Attractiveness, by Disease Indication, 2017–2025
Fig. 40 Europe Oncology Biosimilars Market Value Share, by Distribution Channel, 2017 and 2025
Fig. 41 Europe Oncology Biosimilars Market Attractiveness, by Distribution Channel, 2017–2025
Fig. 42 Asia Pacific Oncology Biosimilars Market Size (US$ Mn) Forecast and Y-o-Y Growth (%), 2015–2025
Fig. 43 Asia Pacific Oncology Biosimilars Market Value Share, by Country, 2017 and 2025
Fig. 44 Asia Pacific Oncology Biosimilars, Market Attractiveness, by Country, 2017–2025
Fig. 45 Asia Pacific Oncology Biosimilars Market Value Share, by Drug Class, 2017 and 2025
Fig. 46 Asia Pacific Oncology Biosimilars Market Attractiveness, by Drug Class, 2017–2025
Fig. 47 Asia Pacific Oncology Biosimilars Market Value Share, by Disease Indication, 2017 and 2025
Fig. 48 Asia Pacific Oncology Biosimilars Market Attractiveness, by Disease Indication, 2017–2025
Fig. 49 Asia Pacific Oncology Biosimilars Market Value Share, by Distribution Channel, 2017 and 2025
Fig. 50 Asia Pacific Oncology Biosimilars Market Attractiveness, by Distribution Channel, 2017–2025
Fig. 51 Rest of the World Oncology Biosimilars, Market Size (US$ Mn) Forecast and Y-o-Y Growth (%), 2015–2025
Fig. 52 Rest of the World Oncology Biosimilars Market Value Share, by Country, 2017 and 2025
Fig. 53 Rest of the World Oncology Biosimilars, Market Attractiveness, by Country, 2017–2025
Fig. 54 Rest of the World Oncology Biosimilars Market Value Share, by Drug Class, 2017 and 2025
Fig. 55 Rest of the World Oncology Biosimilars Market Attractiveness, by Drug Class, 2017–2025
Fig. 56 Rest of the World Oncology Biosimilars Market Value Share, by Disease Indication, 2017 and 2025
Fig. 57 Rest of the World Oncology Biosimilars Market Attractiveness, by Disease Indication, 2017–2025
Fig. 58 Rest of the World Oncology Biosimilars Market Value Share, by Distribution Channel, 2017 and 2025
Fig. 59 Rest of the World Oncology Biosimilars Market Attractiveness, by Distribution Channel, 2017–2025
Fig. 60 Global Oncology Biosimilars Market Share, by Company, 2016
Fig. 61 Breakdown of Net Sales of Sandoz International GmbH (A Novartis Division), by Franchise, 2016 (%)
Fig. 62 Revenue (US$ Bn) & Y-o-Y Growth (%) of Sandoz International GmbH (A Novartis Division), 2013–2016
Fig. 63 Breakdown of Net Sales of Pfizer, Inc., by Region, 2016 (%)
Fig. 64 Revenue (US$ Bn) & Y-o-Y Growth (%) of Pfizer, Inc., 2013–2016
Fig. 65 Breakdown of Net Sales of Celltrion Inc., by Business Segments , 2016
Fig. 66 Revenue (US$ Mn) & Y-o-Y Growth (%) of Celltrion Inc., 2013–2016
Fig. 67 Breakdown of Net Sales of Dr. Reddy’s Laboratories Ltd., by Business Segments, 2016 (%)
Fig. 68 Revenue (US$ Bn) & Y-o-Y Growth (%) of Dr. Reddy’s Laboratories Ltd., 2013–2016
Fig. 69 Breakdown of Net Sales of Biocon, by Business Segments, 2016 (%)
Fig. 70 Revenue (US$ Mn) & Y-o-Y Growth (%) of Biocon, 2013–2016
Fig. 71 Breakdown of Net Sales of Teva Pharmaceutical Industries Ltd., by Business Segments, 2016 (%)
Fig. 72 Revenue (US$ Bn) & Y-o-Y Growth (%) of Teva Pharmaceutical Industries Ltd., 2013–2016
Fig. 73 Breakdown of Net Sales of STADA Arzneimittel AG, by Business Segments, 2016 (%)
Fig. 74 Revenue (US$ Bn) & Y-o-Y Growth (%) of STADA Arzneimittel AG, 2013–2016
Fig. 75 Revenue (US$ Mn) & Y-o-Y Growth (%) of Intas Pharmaceuticals Ltd., 2013–2016
Copyright © Transparency Market Research, Inc. All Rights reserved
Trust Online

Oncology Biosimilars Market