
Reports
Reports
Off-grid solar lighting products are rapidly becoming the primary mode of illuminating remote areas in developing and under-developed countries where grid infrastructure is either non-existent or is highly unreliable and incompetent. Nearly 18% of the world’s population had no access to electricity as of 2013, making the demographic directly dependent on solid fuels such as coal and wood and liquid fuels such as kerosene for lighting purposes.
Of these, kerosene takes a major share and is estimated to account for nearly US$30 bn in expenses directly incurred by millions of households across the globe every year for lighting purposes only. Off-grid solar lighting products are efficient contenders to this supposedly cleaner fuel (as compared to solid fuels such as wood and coal) and are gaining increased attention from governments and consumers alike.
TMR projects that by completely replacing kerosene with off-grid solar power products, the annual costs on lighting incurred by the world’s off-grid population can be brought down by 10% to 15%. Savings of this level can have a major impact on the overall development of developing economies. Environmental benefits of switching to a cleaner energy source such as solar power are also vast.
Owing to these factors, governments are focusing on raising consumer awareness about the increased use of off-grid solar lighting techniques and promoting the development of more efficient products by initiating funds and tax-abatements for vendors. The rising prices of kerosene,
Solar Lanterns to Rank High in Consumer Preference List
Solar lantern systems and solar home systems are currently two of the most popular off-grid solar lighting products in the market. Of these, solar lantern systems have been more preferred than solar home systems in the past years, majorly owing to portability, low cost, and fewer constituent elements in these systems, which make their maintenance easy. TMR states that 6.42 mn units of solar lantern systems were sold across the globe. With 3.56 mn units sold in the global market in the same year, solar home systems accounted for a comparatively low share in the market.
Over 2014-2024 as well, solar lantern systems will be the dominant product type and their sales are expected to rise to 47.53 mn units by 2024. Sales of solar home systems are projected to rise to 34.44 mn units by 2024. In terms of revenue, the market for solar lantern systems is expected to rise from US$386.31 mn in 2014 to US$2360 mn by 2024.
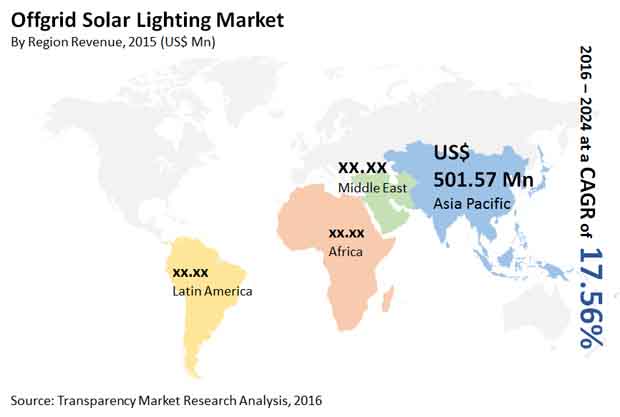
Off-grid Solar Lighting Market in Africa to Closely Follow Asia Pacific
Poor grid infrastructure in several African countries has led to major growth opportunities for the off-grid solar lighting market in the region in the past years. With rising intervention of government and increased awareness among consumers, Africa is expected to emerge as a highly lucrative regional market for off-grid solar lighting products in future years as well. Nevertheless, Asia Pacific will emerge as the leading regional market owing to favorable regulatory platform and provision of direct subsidies for solar lantern systems for household usage. Asia Pacific will account for the largest 50.51% share, Africa will account for the second largest share at 46.63% in the global off-grid solar lighting market by 2024.
The rising consumer base of mobile devices such as smartphones and tablets in Asia Pacific will also boost the consumption of innovative off-grid solar power products capable of charging these products. The unreliable grid infrastructure, frequent power cuts, and complete unavailability of grid in certain remote locations of Asia Pacific will prompt mobile users to go for the cost-efficient and reliable off grid solar products.
In India, which is one of the most lucrative markets for off-grid solar lighting systems with around 260 million households directly dependent on off-grid lighting options, government bodies are taking active measures to increase the adoption of solar lighting systems in remote parts of the country. The Ministry of New and Renewable Energy (MNRE) in India plays a major role in launching public missions such as The Jawaharlal Nehru National Solar Mission (JNNSM), which aims at increasing the adoption of solar home systems in the country to 15 mn by 2022. Meanwhile, Latin America will have a meagre 1.64% share in the global off-grid solar lighting market by 2024 owing to low consumer awareness about the innovative and cleaner solar lighting products.
Off-Grid Solar Lighting Market to Gain Impetus from Increasing Demand and declining Prices of LED lights
Off-grid solar lighting items are quickly turning into the essential method of enlightening far off regions in creating and immature nations where grid foundation is either non-existent or is profoundly inconsistent and clumsy. Almost 18% of the total populace had no admittance to power starting at 2013, making the segment straightforwardly reliant upon strong fills, for example, coal and wood and fluid energizes like lamp oil for lighting purposes.
Significant drivers for the development of the market are developing requirement for energy-effective solar lighting frameworks for interstates, expanding utilization of sustainable power for lighting, rising entrance and diminishing expense of LEDs, and developing interest from creating and arising nations. Moreover, hidden freedoms for this market remember a decrease for the expense of solar lighting frameworks, great government drives, and upgrade in innovative parts of a solar lighting framework.
Worldwide the interest for off-grid solar lighting items is increasing at a critical rate as individuals needs better and progressed lighting choices. In a few locales, particularly in creating districts individuals are exceptionally subject to normal fills like wood, lamp fuel, and coal. In any case, the utilization of these sources have a limit antagonistic impact on the climate. Consequently, off-grid solar lighting items have been presented that will help in limiting the impact of these regular energizes and increment the interest in this market.
The worldwide off-grid solar lighting market is probably going to encounter high development in the several years, yet absence of client mindfulness about this item may hamper the development in this market. Furthermore, restricted accessibility of money and frail dispersion channels are not many other limiting variables that are required to deflect the development of off-grid solar lighting market. In any case, diminishing expense of off-grid solar lighting items and exorbitant costs of lamp fuel particularly in creating locales are probably going to extend the interest for off-grid solar lighting items sooner rather than later.
Table of Content
CHAPTER 1 PREFACE
CHAPTER 2 EXECUTIVE SUMMARY
CHAPTER 3 OFF-GRID SOLAR LIGHTING OVERVIEW
CHAPTER 4 OFF-GRID SOLAR LIGHTING MARKET – BY TYPE, BY VOLUME, BY REVENUE, SEGMENT ANALYSIS, 2014 – 2024 (MILLION UNITS) (US$ MN)
CHAPTER 5 OFF-GRID SOLAR LIGHTING MARKET – BY REGION, BY REVENUE, 2014 – 2024 (MILLION UNITS) (US$ MN)
CHAPTER 6 COMPANY PROFILES
(Note: Similar data points will be provided for the companies mentioned below)
List of Figures
Figure 1 Increasing kerosene spend ($ per household, per year)
Figure 2 Mobile penetration in Asia Pacific and Africa by 2012–2020
Figure 3 Mobile penetration in Asia Pacific and Africa by Growth Rate, 2012–2020
Figure 4 Population without electricity
Figure 5 Global SLS Off Grid Solar Lighting Market, by Volume (Million Units), 2014–2024
Figure 6 Global SLS Off Grid Solar Lighting Market, by Revenue (US$ Mn), 2014–2024
Figure 7 Global SHS Off Grid Solar Lighting Market, by Volume (Million Units), 2014–2024
Figure 8 Global SHS Off Grid Solar Lighting Market, by Revenue (US$ Mn), 2014–2024
Figure 9 Global LSHS Off Grid Solar Lighting Market, by Volume (Million Units), 2014–2024
Figure 10 Global LSHS Off Grid Solar Lighting Market, by Revenue (US$ Mn), 2014–2024
Figure 11 Asia Pacific Off Grid Solar Lighting Market, by Volume (Million Units), 2014–2024
Figure 12 Asia Pacific Off Grid Solar Lighting Market, by Revenue (US$ Mn), 2014–2024
Figure 13 India Off Grid Solar Lighting Market, by Volume (Million Units), 2014–2024
Figure 14 India Off Grid Solar Lighting Market, by Revenue (US$ Mn), 2014–2024
Figure 15 India Off Grid Solar Lighting Market, by Type, by Volume (Million Units), 2014–2024
Figure 16 India Off Grid Solar Lighting Market, by Type, by Revenue (US$ Mn), 2014–2024
Figure 17 Indonesia Off Grid Solar Lighting Market, by Volume (Million Units), 2014–2024
Figure 18 Indonesia Off Grid Solar Lighting Market, by Revenue (US$ Mn), 2014–2024
Figure 19 Indonesia Off Grid Solar Lighting Market, by Type, by Volume (Million Units), 2014–2024
Figure 20 Indonesia Off Grid Solar Lighting Market, by Type, by Revenue (US$ Mn), 2014–2024
Figure 21 Bangladesh Off Grid Solar Lighting Market, by Volume (Million Units), 2014–2024
Figure 22 Bangladesh Off Grid Solar Lighting Market, by Revenue (US$ Mn), 2014–2024
Figure 23 Bangladesh Off Grid Solar Lighting Market, by Type, by Volume (Million Units), 2014– 2024
Figure 24 Bangladesh Off Grid Solar Lighting Market, by Type, by Revenue (US$ Mn), 2014–2024
Figure 25 Pakistan Off Grid Solar Lighting Market, by Volume (Million Units), 2014–2024
Figure 26 Pakistan Off Grid Solar Lighting Market, by Revenue (US$ Mn), 2014–2024
Figure 27 Pakistan Off Grid Solar Lighting Market, by Type, by Volume (‘000 Units), 2014–2024
Figure 28 Pakistan Off Grid Solar Lighting Market, by Type, by Revenue (US$ Thousand), 2014–2024
Figure 29 Nepal Off Grid Solar Lighting Market, by Volume (Million Units), 2014–2024
Figure 30 Nepal Off Grid Solar Lighting Market, by Revenue (US$ Mn), 2014–2024
Figure 31 Nepal Off Grid Solar Lighting Market, by Type, by Volume, 2014–2024 (Million Units)
Figure 32 Nepal Off Grid Solar Lighting Market, by Type, by Revenue (US$ Mn), 2014–2024
Figure 33 Philippines Off Grid Solar Lighting Market, by Volume (Million Units), 2014–2024
Figure 34 Philippines Off Grid Solar Lighting Market, by Revenue (US$ Mn), 2014–2024
Figure 35 Philippines Off Grid Solar Lighting Market, by Type, by Volume (‘000 Units), 2014–2024
Figure 36 Philippines Off Grid Solar Lighting Market, by Type, by Revenue (US$ Thousand), 2014–2024
Figure 37 Cambodia Off Grid Solar Lighting Market, by Volume (Million Units), 2014–2024
Figure 38 Cambodia Off Grid Solar Lighting Market, by Revenue (US$ Mn), 2014–2024
Figure 39 Cambodia Off Grid Solar Lighting Market, by Type, by Volume (‘000 Units), 2014–2024
Figure 40 Cambodia Off Grid Solar Lighting Market, by Type, by Revenue (US$ Thousand), 2014–2024
Figure 41 Africa Off Grid Solar Lighting Market, by Volume (Million Units), 2014–2024
Figure 42 Africa Off Grid Solar Lighting Market, by Revenue (US$ Mn), 2014–2024
Figure 43 Kenya Off Grid Solar Lighting Market, by Volume (Million Units), 2014–2024
Figure 44 Kenya Off Grid Solar Lighting Market, by Revenue (US$ Mn), 2014–2024
Figure 45 Kenya Off Grid Solar Lighting Market, by Type, by Volume (Million Units), 2014–2024
Figure 46 Kenya Off Grid Solar Lighting Market, by Type, by Revenue (US$ Mn), 2014–2024
Figure 47 Tanzania Off Grid Solar Lighting Market, by Volume (Million Units), 2014–2024
Figure 48 Tanzania Off Grid Solar Lighting Market, by Revenue (US$ Mn), 2014–2024
Figure 49 Tanzania Off Grid Solar Lighting Market, by Type, by Volume (Million Units), 2014–2024
Figure 50 Tanzania Off Grid Solar Lighting Market, by Type, by Revenue (US$ Mn), 2014–2024
Figure 51 Ghana Off Grid Solar Lighting Market, by Volume (Million Units), 2014–2024
Figure 52 Ghana Off Grid Solar Lighting Market, by Revenue (US$ Mn), 2014–2024
Figure 53 Ghana Off Grid Solar Lighting Market, by Type, by Volume (Million Units), 2014–2024
Figure 54 Ghana Off Grid Solar Lighting Market, by Type, by Revenue (US$ Mn), 2014–2024
Figure 55 Ethiopia Off Grid Solar Lighting Market, by Volume (Million Units), 2014–2024
Figure 56 Ethiopia Off Grid Solar Lighting Market, by Revenue (US$ Mn), 2014–2024
Figure 57 Ethiopia Off Grid Solar Lighting Market, by Type, by Volume (Million Units), 2014–2024
Figure 58 Ethiopia Off Grid Solar Lighting Market, by Type, by Revenue (US$ Mn), 2014–2024
Figure 59 Uganda Off Grid Solar Lighting Market, by Volume (Million Units), 2014–2024
Figure 60 Uganda Off Grid Solar Lighting Market, by Revenue (US$ Mn), 2014–2024
Figure 61 Uganda Off Grid Solar Lighting Market, by Type, by Volume (Million Units), 2014–2024
Figure 62 Uganda Off Grid Solar Lighting Market, by Type, by Revenue (US$ Mn), 2014–2024
Figure 63 Nigeria Off Grid Solar Lighting Market, by Volume (Million Units), 2014–2024
Figure 64 Nigeria Off Grid Solar Lighting Market, by Revenue (US$ Mn), 2014–2024
Figure 65 Nigeria Off Grid Solar Lighting Market, by Type, by Volume (Million Units), 2014–2024
Figure 66 Nigeria Off Grid Solar Lighting Market, by Type, by Revenue (US$ Mn), 2014–2024
Figure 67 Zambia Off Grid Solar Lighting Market, by Volume (Million Units), 2014–2024
Figure 68 Zambia Off Grid Solar Lighting Market, by Revenue (US$ Mn), 2014–2024
Figure 69 Zambia Off Grid Solar Lighting Market, by Type, by Volume (Million Units), 2014–2024
Figure 70 Zambia Off Grid Solar Lighting Market, by Type, by Revenue (US$ Mn), 2014–2024
Figure 71 Rest of Africa Off Grid Solar Lighting Market, by Volume (Million Units), 2014–2024
Figure 72 Rest Of Africa Off Grid Solar Lighting Market, by Revenue (US$ Mn), 2014–2024
Figure 73 Rest of Africa Off Grid Solar Lighting Market, by Type, by Volume (Million Units), 2014–2024
Figure 74 Rest of Africa Off Grid Solar Lighting Market, by Type, by Revenue (US$ Mn), 2014–2024
Figure 75 Latin America Off Grid Solar Lighting Market, by Volume (Million Units), 2014–2024
Figure 76 Latin America Off Grid Solar Lighting Market, by Revenue (US$ Mn), 2014–2024
Figure 77 Peru Off Grid Solar Lighting Market, by Volume (‘000 Units), 2014–2024
Figure 78 Peru Off Grid Solar Lighting Market, by Revenue (US$ Thousand), 2014–2024
Figure 79 Peru Off Grid Solar Lighting Market, by Type, by Volume (‘000 Units), 2014–2024
Figure 80 Peru Off Grid Solar Lighting Market, by Type, by Revenue (US$ Thousand), 2014–2024
Figure 81 Brazil Off Grid Solar Lighting Market, by Volume (‘000 Units), 2014–2024
Figure 82 Brazil Off Grid Solar Lighting Market, by Revenue (US$ Thousand), 2014–2024
Figure 83 Brazil off Grid Solar Lighting Market, by Type by Volume, (‘000 Units), 2014–2024
Figure 84 Brazil Off Grid Solar Lighting Market, by Type, by Revenue (US$ Thousand), 2014–2024
Figure 85 Colombia Off Grid Solar Lighting Market, by Volume (‘000 Units), 2014–2024
Figure 86 Colombia Off Grid Solar Lighting Market, by Revenue (US$ Thousand), 2014–2024
Figure 87 Colombia Off Grid Solar Lighting Market, by Type, by Volume (‘000 Units), 2014–2024
Figure 88 Colombia Off Grid Solar Lighting Market, by Type, by Revenue (US$ Thousand), 2014–2024
Figure 89 El Salvador Off Grid Solar Lighting Market, by Volume (‘000 Units), 2014–2024
Figure 90 El Salvador Off Grid Solar Lighting Market, by Revenue (US$ Thousand), 2014–2024
Figure 91 El Salvador Off Grid Solar Lighting Market, by Type, by Volume (‘000 Units), 2014–2024
Figure 92 El Salvador Off Grid Solar Lighting Market, by Type, by Revenue (US$ Thousand), 2014–2024
Figure 93 Guatemala Off Grid Solar Lighting Market, by Volume (‘000 Units), 2014–2024
Figure 94 Guatemala Off Grid Solar Lighting Market, by Revenue (US$ Thousand), 2014–2024
Figure 95 Guatemala Off Grid Solar Lighting Market, by Type, by Volume (‘000 Units), 2014–2024
Figure 96 Guatemala Off Grid Solar Lighting Market, by Type, by Revenue (US$ Thousand), 2014–2024
Figure 97 Rest of Latin America Off Grid Solar Lighting Market, by Volume (‘000 Units), 2014–2024
Figure 98 Rest of Latin America Off Grid Solar Lighting Market, by Revenue (US$ Thousand), 2014–2024
Figure 99 Rest of Latin America Off Grid Solar Lighting Market, by Type, by Volume (‘000 Units), 2014–2024
Figure 100 Rest of Latin America Off Grid Solar Lighting Market, by Type, by Revenue (US$ Thousand), 2014–2024
Figure 101 Middle East Off Grid Solar Lighting Market, by Volume (Million Units), 2014–2024
Figure 102 Middle East Off Grid Solar Lighting Market, by Revenue (US$ Mn), 2014–2024
Figure 103 Middle East Off Grid Solar Lighting Market, by Type, by Volume (‘000 Units), 2014–2024
Figure 104 Middle East Off Grid Solar Lighting Market, by Type, by Revenue (US$ Thousand), 2014–2024
Copyright © Transparency Market Research, Inc. All Rights reserved
Trust Online

Off-Grid Solar Lighting Market