
Reports
Reports
The North America wheelchair accessible vehicle converters market has been displaying significant growth rate over the last few years, thanks to the increasing number of patients with disability. In the years to come, the market is likely to gain substantially from the rising demand for user-friendly accessible vehicles and the surge in the launch of affordable mobility gadgets. Apart from this, the mounting number of trauma cases, leading to disability and the escalating geriatric population is also expected to provide lucrative growth opportunities for the wheelchair accessible vehicle manufacturers in the near future.
In 2015, the North America market for wheelchair accessible vehicle converters was worth US$1.74 bn. According to researchers, the market’s future looks bright, rising at a CAGR of 5.30% from 2016 to 2024 and reaching US$3.47 bn by the end of 2024.
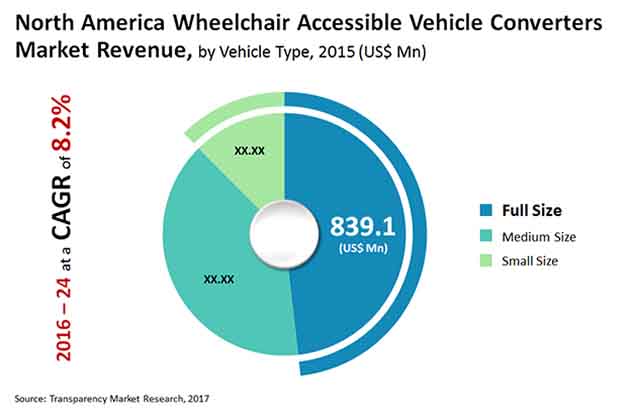
On the basis of the type of vehicle, the North America market for wheelchair accessible vehicle converters has been classified into three broad categories, i.e., full size vehicles, medium size vehicles, and small size vehicles. Full size vehicles have been leading this market in terms of revenue; however, the demand for medium size vehicle is higher in North America. In 2015, the full size vehicle segment accounted for more than 48% of the overall market. With the increasing uptake of wheelchair accessible vehicles as family cars among families with disabled people, the revenue generated from this segment is likely to augment in the near future, ensuring its lead.
Based on the entry modality, the market has been categorized into ramps and lifts. The demand for ramps, which are mainly used for the medium size and small size vehicles, has been higher than lifts, which mostly find utilization in the case of a full size vehicle. The relatively low installation and maintenance costs of ramps have kept them a step ahead of lifts. The ramps segment led the North America wheelchair accessible vehicle converters market in 2015 with a share of 48.1%. Thanks to the ease of usage, ramps are expected to remain high in demand in this region over the next few years.
In terms of geography, the market for wheelchair accessible vehicle converters in North America has been segmented into the U.S. and Canada. With a share of nearly 95%, the U.S. led the overall market in 2015. The scenario is expected to remain so over the next few years, thanks to the presence of a large base of disabled population. The rising adoption of wheelchair accessible vehicles, stimulated by the increasing number of awareness initiatives by the manufacturers of vehicle converters, increasing cases of trauma resulting in disability, and the surge in the government funding for wheelchair accessible vehicles are also projected to boost the U.S. market for wheelchair accessible vehicle converters in the years to come.
The North America market for wheelchair accessible vehicle converters is fragmented and highly competitive in nature. Mobility Ventures LLC, Vantage Mobility International, and BraunAbility are at the forefront of this market. Some of the other prominent vendors of wheelchair accessible vehicle convertibles in this region are Toyota Motor Corp., Rollx Vans, and Freedom Motors USA.
The rise in geriatric population, coupled with their vulnerability to various diseases stands as a key actor promoting the growth of the global wheelchair accessible vehicle converters market. A considerable rise in the quantity of impaired patients in North America is assessed to quicken the development of the market in the coming years. The rising mindfulness among patients with respect to the accessibility of wheelchair available vehicle converters is probably going to drive the general market. Moreover, the expanding geriatric populace and the rising buying intensity of purchasers are additionally projected to help market development all through the estimate time frame. Then again, the significant expense of these items is required to limit the development of the North America wheelchair available vehicle converters market all through the conjecture time frame.
With respect to segmentation by vehicle type, the market for wheelchair accessible converters is dominated by the full size vehicles in terms of revenue, especially in North America. On the contrary the market is likely to witness the demand for medium sized vehicles in the coming years on account of the rising uptake of wheelchair accessible vehicles as family cars. This is especially the case in terms of families with disabled people or people who recently met with an accident and are diagnosed with complete bed rest or are unable to move.
The general pandemic of the COVID19 pandemic daintily influenced the wheelchair flexible vehicle market. Huge clinical assessment associations were enchanted in the headway of antivirus to fight the COVID-19 pandemic. In any case, latest innovations are further expected to show huge degree of advancement for both the market and its players. Prominent players of the North America Wheelchair available vehicle converters market are Vantage Mobility International, BraunAbility, LLC. Mobility Ventures, and others.
Section - 1. Preface
1.1. Market Definition and Scope
1.2. Market Segmentation
1.3. Key Research Objectives
1.4. Research Highlights
Section - 2. Assumptions and Research Methodology
2.1 Assumptions and Acronyms Used
2.2 Research Methodology
Section - 3. Executive Summary: North America Wheelchair Accessible Vehicle
3.1 North America Wheelchair Accessible Vehicle Converters: Market Snapshot
Section - 4. Market Overview
4.1. Introduction
4.1.1. Product Definition
4.1.2. Industry Evolution / Developments
4.2. Market Overview
4.3. PESTEL Analysis
4.4. Key Policies & Regulations
4.5. List of Local Distributors
4.6. Value Chain Analysis
4.7 Market Dynamics
4.7.1. Drivers
4.7.1.1 Government Funding for Wheelchair Accessible Vehicles
4.7.1.2 Initiatives for Creating Awareness
4.7.1.3 Growing Infrastructure Facilities for Mobility Vehicles
4.7.1.4 Increasing Number of Patients with Disability
4.7.1.5 Increasing Number of Trauma Cases Leading to Disability
4.7.1.6 Demand for User Friendly Accessible Vehicles
4.7.1.7 Introduction of new technology in the WAVs for easy accessibility and usage
4.7.1.8 Introduction of affordable mobility gadgets
4.7.1.9 Emphasis on Customized Vehicles for Customers
4.7.2. Restraints
4.7.2.1 High Price of Vehicles
4.7.2.2 Refurbished/ Used Vehicles
4.7.2.3 Low Penetration among End Users
4.7.3. Opportunities
4.7.3.1 Changing Population Dynamics
4.7.3.2 Product Innovation and Growing Distribution Network
4.8. Market Revenue Projections in Value (US$ Mn) and Volume (Units)
4.9. Market Outlook
Section - 5. North America Wheelchair Accessible Vehicle Converters Market, by Vehicle Type
5.1. Introduction
5.2. North America Wheelchair Accessible Vehicle Converters Market Value Share Analysis by Vehicle Type
5.3 North America Wheelchair Accessible Vehicle Converters Market Size (US$ Mn) and Volume (Units) Forecast, By Vehicle Type
5.3.1. Full Size Vehicle
5.3.2. Medium Size Vehicle
5.3.3. Small Size Vehicle
5.4. Comparison Matrix
5.5. North America Wheelchair Accessible Vehicle Converters Market Attractiveness by Vehicle Type
Section - 6. North America Wheelchair Accessible Vehicle Converters Market, by Entry Modality
6.1 Introduction
6.2. North America Wheelchair Accessible Vehicle Converters Market Value Share Analysis by Entry Modality
6.3 North America Wheelchair Accessible Vehicle Converters Market Size (US$ Mn) and Volume (Units) Forecast, By Entry Modality
6.3.1. Ramp
6.3.2. Lift
6.4. Comparison Matrix
6.5. North America Wheelchair Accessible Vehicle Converters Market Attractiveness by Entry Modality
Section - 7. North America Wheelchair Accessible Vehicle Converters Market, by Entry Point
7.1. Introduction
7.2. North America Wheelchair Accessible Vehicle Converters Market Value Share Analysis by Entry Point
7.3 North America Wheelchair Accessible Vehicle Converters Market Size (US$ Mn) and Volume (Units) Forecast, By Entry Point
7.3.1. Side Entry
7.3.2. Rear Entry
7.4. Comparison Matrix
7.5. North America Wheelchair Accessible Vehicle Converters Market Attractiveness by Entry Point
Section - 8. North America Wheelchair Accessible Vehicle Converters Market, by Country
8.1. Introduction
8.2. North America Wheelchair Accessible Vehicle Converters Market Value Share Analysis by Country
8.2.1 North America Wheelchair Accessible Vehicle Converters Market Value Share Analysis by Country
8.3 North America Wheelchair Accessible Vehicle Converters Market Size (US$ Mn) and Volume (Units) Forecast, By Country
8.3.1. U.S.
8.3.2. Canada
8.4. Comparison Matrix
8.5. North America Wheelchair Accessible Vehicle Converters Market Attractiveness by Country
Section – 9 U.S. Wheelchair Accessible Vehicle Converters Market Analysis by Vehicle Type
9.1 Introduction
9.1.1 Ambulatory Disability Employment Percentage
9.1.2 Americans with Disabilities Act 1990 (ADA)
9.1.3 Financing and Incentives for Accessible Cabs
9.1.4 Accessible Taxis and Disable Population Statistics
9.2. U.S. Wheelchair Accessible Vehicle Converters Market Value Share Analysis by Vehicle Type
9.3. U.S. Wheelchair Accessible Vehicle Converters Market Size (US$ Mn) and Volume (Units) Forecast, By Vehicle Type
9.3.1. Full Size Vehicle
9.3.2. Medium Size Vehicle
9.3.3. Small Size Vehicle
9.4. U.S. Wheelchair Accessible Vehicle Converters Market Attractiveness by Vehicle Type
Section - 10. U.S. Wheelchair Accessible Vehicle Converters Market, by Entry Modality
10.1 Introduction
10.2. U.S. Wheelchair Accessible Vehicle Converters Market Value Share Analysis by Entry Modality
10.3 U.S. Wheelchair Accessible Vehicle Converters Market Size (US$ Mn) and Volume (Units) Forecast, By Entry Modality
10.3.1. Ramp
10.3.2. Lift
10.5. U.S. Wheelchair Accessible Vehicle Converters Market Attractiveness by Entry Modality
Section - 11. U.S. Wheelchair Accessible Vehicle Converters Market, by Entry Point
11.1. Introduction
11.2. U.S. Wheelchair Accessible Vehicle Converters Market Value Share Analysis by Entry Point
11.3. U.S. Wheelchair Accessible Vehicle Converters Market Size (US$ Mn) and Volume (Units) Forecast, By Entry Point
11.3.1. Side Entry
11.3.2. Rear Entry
11.4. U.S. Wheelchair Accessible Vehicle Converters Market Attractiveness by Entry Point
Section - 12 U.S. Wheelchair Accessible Vehicle Converters Market Analysis by Vehicle Type
12.1 Introduction
12.2. Canada Wheelchair Accessible Vehicle Converters Market Value Share Analysis by Vehicle Type
12.3 Canada Wheelchair Accessible Vehicle Converters Market Size (US$ Mn) and Volume (Units) Forecast, By Vehicle Type
12.3.1. Full Size Vehicle
12.3.2. Medium Size Vehicle
12.3.3. Small Size Vehicle
12.4. Canada Wheelchair Accessible Vehicle Converters Market Attractiveness by Vehicle Type
Section - 13. Canada Wheelchair Accessible Vehicle Converters Market, by Entry Modality
13.1 Introduction
13.2. Canada Wheelchair Accessible Vehicle Converters Market Value Share Analysis by Entry Modality
13.3 Canada Wheelchair Accessible Vehicle Converters Market Size (US$ Mn) and Volume (Units) Forecast, By Entry Modality
13.3.1. Ramp
13.3.2. Lift
13.4. Canada Wheelchair Accessible Vehicle Converters Market Attractiveness by Entry Modality
Section - 14. Canada Wheelchair Accessible Vehicle Converters Market, by Entry Point
14.1. Introduction
14.2. Canada Wheelchair Accessible Vehicle Converters Market Value Share Analysis by Entry Point
14.3 Canada Wheelchair Accessible Vehicle Converters Market Size (US$ Mn) and Volume (Units) Forecast, By Entry Point
14.3.1. Side Entry
14.3.2. Rear Entry
14.4. Canada Wheelchair Accessible Vehicle Converters Market Attractiveness by Entry Point
Section - 15. Competition Landscape
15.1. Market Player – Competition Matrix (By Tier and Size of company)
15.2. Market Share Analysis by Company (2015)
15.3. Company Profiles (Details – Overview, Financials, Recent Developments)
15.3.1. Toyota Motor Corporation
15.3.1.1. Company Overview (HQ, Business Segments, Employee Strength)
15.3.1.2. Financial Overview
15.3.1.3. Product Portfolio
15.3.1.4. SWOT Analysis
15.3.1.5. Strategic Overview
15.3.2. Rollx Vans
15.3.2.1. Company Overview (HQ, Business Segments, Employee Strength)
15.3.2.2. Financial Overview
15.3.2.3. Product Portfolio
15.3.2.4. SWOT Analysis
15.3.2.5. Strategic Overview
15.3.3. BraunAbility
15.3.3.1. Company Overview (HQ, Business Segments, Employee Strength)
15.3.3.2. Financial Overview
15.3.3.3. Product Portfolio
15.3.3.4. SWOT Analysis
15.3.3.5. Strategic Overview
15.3.4. Vantage Mobility International
15.3.4.1. Company Overview (HQ, Business Segments, Employee Strength)
15.3.4.2. Financial Overview
15.3.4.3. Product Portfolio
15.3.4.4. SWOT Analysis
15.3.4.5. Strategic Overview
15.3.5. Mobility Ventures LLC
15.3.5.1. Company Overview (HQ, Business Segments, Employee Strength)
15.3.5.2. Financial Overview
15.3.5.3. Product Portfolio
15.3.5.4. SWOT Analysis
15.3.5.5. Strategic Overview
15.3.6. Freedom Motors USA
15.3.6.1. Company Overview (HQ, Business Segments, Employee Strength)
15.3.6.2. Financial Overview
15.3.6.3. Product Portfolio
15.3.6.4. SWOT Analysis
15.3.6.5. Strategic Overview
16. Key Takeaways
List of Tables
Table 01: North America Wheelchair Accessible Vehicle Converters Market Size (US$ Mn) Forecast, by Vehicle Type, 2015–2024
Table 02: North America Wheelchair Accessible Vehicle Converters Market Volume (Units) Forecast, by Vehicle Type, 2015–2024
Table 03: North America Full Size Vehicle Market Size (US$ Mn) Forecast, by Vehicle Type, 2015–2024
Table 04: North America Full Size Vehicle Market Volume (Units) Forecast, by Vehicle Type, 2015–2024
Table 05: North America Medium Size Vehicle Market Size (US$ Mn) Forecast, by Vehicle Type, 2015–2024
Table 06: North America Medium Size Vehicle Market Volume (Units) Forecast, by Vehicle Type, 2015–2024
Table 07: North America Full Size Vehicle Market Size (US$ Mn) Forecast, by Vehicle Type, 2015–2024
Table 08: North America Full Size Vehicle Market Volume (Units) Forecast, by Vehicle Type, 2015–2024
Table 09: North America Wheelchair Accessible Vehicle Converters Market Size (US$ Mn) Forecast, by Entry Modality, 2015–2024
Table 10: North America Wheelchair Accessible Vehicle Converters Market Volume (Units) Forecast, by Entry Modality, 2015–2024
Table 11: North America Wheelchair Accessible Vehicle Converters Market Size (US$ Mn) Forecast, by Entry Point, 2015–2024
Table 12: North America Wheelchair Accessible Vehicle Converters Market Volume (Units) Forecast, by Entry Point, 2015–2024
Table 13: North America Wheelchair Accessible Vehicle Converters Market Size (US$ Mn) Forecast, by Country, 2015–2024
Table 14: North America Wheelchair Accessible Vehicle Converters Market Volume (Units) Forecast, by Country, 2015–2024
Table 15: U.S. Wheelchair Accessible Vehicle Converters Market Size (US$ Mn) Forecast, by Vehicle Type, 2015–2024
Table 16: U.S. Wheelchair Accessible Vehicle Converters Market Volume (Units) Forecast, by Vehicle Type, 2015–2024
Table 17: U.S. Full Size Vehicle Market Size (US$ Mn) Forecast, by Vehicle Type, 2015–2024
Table 18: U.S. Full Size Vehicle Market Volume (Units) Forecast, by Vehicle Type, 2015–2024
Table 19: U.S. Medium Size Vehicle Market Size (US$ Mn) Forecast, by Vehicle Type, 2015–2024
Table 20: U.S. Medium Size Vehicle Market Volume (Units) Forecast, by Vehicle Type, 2015–2024
Table 21: U.S. Small Size Vehicle Market Size (US$ Mn) Forecast, by Vehicle Type, 2015–2024
Table 22: U.S. Small Size Vehicle Market Volume (Units) Forecast, by Vehicle Type, 2015–2024
Table 23: U.S. Wheelchair Accessible Vehicle Converters Market Size (US$ Mn) Forecast, by Entry Modality, 2015–2024
Table 24: U.S. Wheelchair Accessible Vehicle Converters Market Volume (Units) Forecast, by Entry Modality, 2015–2024
Table 25: U.S. Wheelchair Accessible Vehicle Converters Market Size (US$ Mn) Forecast, by Entry Mode, 2015–2024
Table 26: U.S. Wheelchair Accessible Vehicle Converters Market Volume (Units) Forecast, by Entry Mode, 2015–2024
Table 27: Canada Wheelchair Accessible Vehicle Converters Market Size (US$ Mn) Forecast, by Vehicle Type, 2015–2024
Table 28: Canada Wheelchair Accessible Vehicle Converters Market Volume (Units) Forecast, by Vehicle Type, 2015–2024
Table 29: Canada Full Size Vehicle Market Size (US$ Mn) Forecast, by Vehicle Type, 2015–2024
Table 30: Canada Full Size Vehicle Market Volume (Units) Forecast, by Vehicle Type, 2015–2024
Table 31: Canada Medium Size Vehicle Market Size (US$ Mn) Forecast, by Vehicle Type, 2015–2024
Table 32: Canada Medium Size Vehicle Market Volume (Units) Forecast, by Vehicle Type, 2015–2024
Table 33: Canada Small Size Vehicle Market Size (US$ Mn) Forecast, by Vehicle Type, 2015–2024
Table 34: Canada Small Size Vehicle Market Volume (Units) Forecast, by Vehicle Type, 2015–2024
Table 35: Canada Wheelchair Accessible Vehicle Converters Market Size (US$ Mn) Forecast, by Entry Modality, 2015–2024
Table 36: Canada Wheelchair Accessible Vehicle Converters Market Volume (Units) Forecast, by Entry Modality, 2015–2024
Table 37: Canada Wheelchair Accessible Vehicle Converters Market Size (US$ Mn) Forecast, by Entry Point, 2015–2024
Table 38: Canada Wheelchair Accessible Vehicle Converters Market Volume (Units) Forecast, by Entry Point, 2015–2024
List of Figures
Figure 01: North America Wheelchair Accessible Vehicle Converters Market Size (US$ Mn) Forecast, 2014–2024
Figure 02: North America Wheelchair Accessible Vehicle Converters Market Volume (Units) Forecast, 2014–2024
Figure 03: North America Wheelchair Accessible Vehicle Converters Market Value Share Analysis, by Vehicle Type, 2016 and 2024
Figure 04: North America Wheelchair Accessible Vehicle Converters Market Size (US$ Mn) Forecast, by Full Size Vehicle, 2014–2024
Figure 05: North America Wheelchair Accessible Vehicle Converters Market Size Y-o-Y Growth Projections, by Full Size Vehicle, 2015–2024
Figure 06: North America Wheelchair Accessible Vehicle Converters Market Value Share Analysis, by Full Size Vehicle, 2016 and 2024
Figure 07: North America Wheelchair Accessible Vehicle Converters Market Size (US$ Mn) Forecast, by Medium Size Vehicle, 2014–2024
Figure 08: North America Wheelchair Accessible Vehicle Converters Market Size Y-o-Y Growth Projections, by Medium Size Vehicle, 2015–2024
Figure 09: North America Wheelchair Accessible Vehicle Converters Market Value Share Analysis, by Medium Size Vehicle, 2016 and 2024
Figure 10: North America Wheelchair Accessible Vehicle Converters Market Size (US$ Mn) Forecast, by Small Size Vehicle, 2014–2024
Figure 11: North America Wheelchair Accessible Vehicle Converters Market Size Y-o-Y Growth Projections, by Small Size Vehicle, 2015–2024
Figure 12: North America Wheelchair Accessible Vehicle Converters Market Value Share Analysis, by Small Size Vehicle, 2016 and 2024
Figure 13: North America Market Attractiveness Analysis, by Vehicle Type
Figure 14: North America Wheelchair Accessible Vehicle Converters Market Value Share Analysis, by Entry Modality, 2016 and 2024
Figure 15: North America Wheelchair Accessible Vehicle Converters Market Size (US$ Mn) Forecast, by Ramp, 2014–2024
Figure 16: North America Wheelchair Accessible Vehicle Converters Market Size Y-o-Y Growth Projections, by Ramp, 2015–2024
Figure 17: North America Wheelchair Accessible Vehicle Converters Market Size (US$ Mn) Forecast, by Lift, 2014–2024
Figure 18: North America Wheelchair Accessible Vehicle Converters Market Size Y-o-Y Growth Projections, by Lift, 2015–2024
Figure 19: North America Market Attractiveness Analysis, by Entry Modality
Figure 20: North America Wheelchair Accessible Vehicle Converters Market Value Share Analysis, by Entry Point, 2016 and 2024
Figure 21: North America Wheelchair Accessible Vehicle Converters Market Size (US$ Mn) Forecast, by Side Entry, 2014–2024
Figure 22: North America Wheelchair Accessible Vehicle Converters Market Size Y-o-Y Growth Projections, by Side Entry, 2015–2024
Figure 23: North America Wheelchair Accessible Vehicle Converters Market Size (US$ Mn) Forecast, by Rear Entry, 2014–2024
Figure 24: North America Wheelchair Accessible Vehicle Converters Market Size Y-o-Y Growth Projections, by Rear Entry, 2015–2024
Figure 25: North America Market Attractiveness Analysis, by Entry Modality
Figure 26: North America Wheelchair Accessible Vehicle Converters Market Value Share Analysis, by Country, 2016 and 2024
Figure 27: U.S. Wheelchair Accessible Vehicle Converters Market Size (US$ Mn) Forecast, 2014–2024
Figure 28: U.S. Wheelchair Accessible Vehicle Converters Market Size Y-o-Y Growth Projections, 2015-2024
Figure 29: Canada Wheelchair Accessible Vehicle Converters Market Size (US$ Mn) Forecast, 2014–2024
Figure 30: Canada Wheelchair Accessible Vehicle Converters Market Size Y-o-Y Growth Projections, 2015–2024
Figure 31: North America Market Attractiveness Analysis, by Country
Figure 32: U.S. Wheelchair Accessible Vehicle Converters Market Value Share Analysis, by Vehicle Type, 2016 and 2024
Figure 33: U.S. Wheelchair Accessible Vehicle Converters Market Size (US$ Mn) Forecast, by Full Size Vehicle, 2014–2024
Figure 34: U.S. Wheelchair Accessible Vehicle Converters Market Size Y-o-Y Growth Projections, by Full Size Vehicle, 2015–2024
Figure 35: U.S. Wheelchair Accessible Vehicle Converters Market Value Share Analysis, by Full Size Vehicle, 2016 and 2024
Figure 36: U.S. Wheelchair Accessible Vehicle Converters Market Size (US$ Mn) Forecast, by Medium Size Vehicle, 2014–2024
Figure 37: U.S. Wheelchair Accessible Vehicle Converters Market Size Y-o-Y Growth Projections, by Medium Size Vehicle, 2015–2024
Figure 38: U.S. Wheelchair Accessible Vehicle Converters Market Value Share Analysis, by Medium Size Vehicle, 2016 and 2024
Figure 39: U.S. Wheelchair Accessible Vehicle Converters Market Size (US$ Mn) Forecast, by Small Size Vehicle, 2014–2024
Figure 40: U.S. Wheelchair Accessible Vehicle Converters Market Size Y-o-Y Growth Projections, by Small Size Vehicle, 2015–2024
Figure 41: U.S. Wheelchair Accessible Vehicle Converters Market Value Share Analysis, by Small Size Vehicle, 2016 and 2024
Figure 43: U.S. Wheelchair Accessible Vehicle Converters Market Value Share Analysis, by Entry Modality, 2016 and 2024
Figure 44: U.S. Wheelchair Accessible Vehicle Converters Market Size (US$ Mn) Forecast, by Lift Entry Modality, 2015–2024
Figure 45: U.S. Wheelchair Accessible Vehicle Converters Market Size Y-o-Y Growth Projections, by Lift Entry Modality, 2016–2024
Figure 46: U.S. Wheelchair Accessible Vehicle Converters Market Size (US$ Mn) Forecast, by Ramp Entry Modality, 2015–2024
Figure 47: U.S. Wheelchair Accessible Vehicle Converters Market Size Y-o-Y Growth Projections, by Ramp Entry Modality, 2016–2024
Figure 48: U.S. Market Attractiveness Analysis, by Entry Modality
Figure 49: U.S. Wheelchair Accessible Vehicle Converters Market Value Share Analysis, by Entry Mode, 2016 and 2024
Figure 50: U.S. Wheelchair Accessible Vehicle Converters Market Size (US$ Mn) Forecast, by Side Entry Mode, 2015–2024
Figure 51: U.S. Wheelchair Accessible Vehicle Converters Market Size Y-o-Y Growth Projections, by Side Entry Mode, 2016–2024
Figure 52: U.S. Wheelchair Accessible Vehicle Converters Market Size (US$ Mn) Forecast, by Rear Entry Mode, 2015–2024
Figure 53: U.S. Wheelchair Accessible Vehicle Converters Market Size Y-o-Y Growth Projections, by Rear Entry Mode, 2016–2024
Figure 54: U.S. Market Attractiveness Analysis, by Entry Mode
Figure 55: Canada Wheelchair Accessible Vehicle Converters Market Value Share Analysis, by Vehicle Type, 2016 and 2024
Figure 56: Canada Wheelchair Accessible Vehicle Converters Market Size (US$ Mn) Forecast, by Full Size Vehicle, 2014–2024
Figure 57: Canada Wheelchair Accessible Vehicle Converters Market Size Y-o-Y Growth Projections, by Full Size Vehicle, 2015–2024
Figure 58: Canada Wheelchair Accessible Vehicle Converters Market Value Share Analysis, by Full Size Vehicle, 2016 and 2024
Figure 59: Canada Wheelchair Accessible Vehicle Converters Market Size (US$ Mn) Forecast, by Medium Size Vehicle, 2014–2024
Figure 60: Canada Wheelchair Accessible Vehicle Converters Market Size Y-o-Y Growth Projections, by Medium Size Vehicle, 2015–2024
Figure 61: Canada Wheelchair Accessible Vehicle Converters Market Value Share Analysis, by Medium Size Vehicle, 2016 and 2024
Figure 62: Canada Wheelchair Accessible Vehicle Converters Market Size (US$ Mn) Forecast, by Small Size Vehicle, 2014–2024
Figure 63: Canada Wheelchair Accessible Vehicle Converters Market Size Y-o-Y Growth Projections, by Small Size Vehicle, 2015–2024
Figure 64: Canada Wheelchair Accessible Vehicle Converters Market Value Share Analysis, by Small Size Vehicle, 2016 and 2024
Figure 65: Canada Market Attractiveness Analysis, by Vehicle Type
Figure 66: Canada Wheelchair Accessible Vehicle Converters Market Value Share Analysis, by Entry Modality, 2016 and 2024
Figure 67: Canada Wheelchair Accessible Vehicle Converters Market Size (US$ Mn) Forecast, by Ramp, 2014–2024
Figure 68: Canada Wheelchair Accessible Vehicle Converters Market Size Y-o-Y Growth Projections, by Ramp, 2015–2024
Figure 69: Canada Wheelchair Accessible Vehicle Converters Market Size (US$ Mn) Forecast, by Lift, 2014–2024
Figure 70: Canada Wheelchair Accessible Vehicle Converters Market Size Y-o-Y Growth Projections, by Lift, 2015–2024
Figure 71: Canada Market Attractiveness Analysis, by Entry Modality
Figure 72: Canada Wheelchair Accessible Vehicle Converters Market Value Share Analysis, by Entry Point, 2016 and 2024
Figure 73: Canada Wheelchair Accessible Vehicle Converters Market Size (US$ Mn) Forecast, by Side Entry, 2014–2024
Figure 74: Canada Wheelchair Accessible Vehicle Converters Market Size Y-o-Y Growth Projections, by Side Entry, 2015–2024
Figure 75: Canada Wheelchair Accessible Vehicle Converters Market Size (US$ Mn) Forecast, by Rear Entry, 2014–2024
Figure 76: Canada Wheelchair Accessible Vehicle Converters Market Size Y-o-Y Growth Projections, by Rear Entry, 2015–2024
Figure 77: Canada Market Attractiveness Analysis, by Entry Modality
Figure 78: North America Wheelchair Accessible Vehicle Converters Company Share Analysis (2015)
Copyright © Transparency Market Research, Inc. All Rights reserved
Trust Online

Wheelchair Accessible Vehicle Converters Market