
Reports
Reports
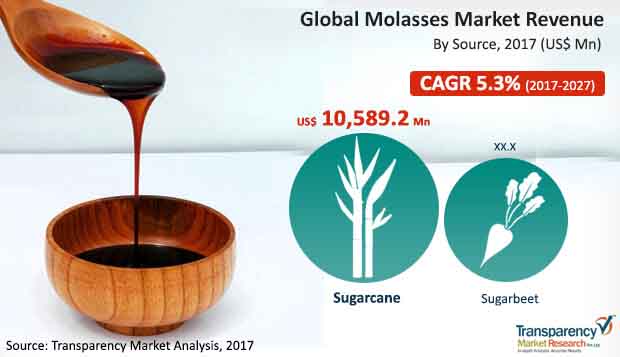
Global Molasses Market: Snapshot
The growth of global molasses market is due to its high consumption in animal feed industry and biofuel industry. The major production source of molasses is sugarcane and regions such as APAC and Latin America provides the most favorable environment for the sugarcane production and so it directly influences the molasses market. The molasses is produced as a by-product in sugar production and so regions producing large quantity of sugar serves as major molasses producing regions.
The revenue generated from molasses market is estimated to be valued at roughly US$ 12,106.3 Mn by the end of 2017 and is expected to increase at a CAGR of 5.3% over the forecast period. Global molasses market are expected to be valued at approximately US$ 18,281.7 Mn by the end of 2025.
Industrial Use Segment Boasts Clear Dominance in Global Market based on End Use
The global molasses market can be segmented on the basis of source, type, nature, end-use, and distribution. By source, the molasses market is segmented into sugarcane and sugarbeet. The sugarcane segment acts as the major source for obtaining molasses, with an accounted market share of 88.1% in 2016, in terms of volume. On the basis of type, the molasses market can be segmented into regular molasses, blackstrap molasses, and others. The blackstrap molasses segment serves as the dominant segment with an anticipated market share of 55.3%, over the forecast period. By nature, the molasses market is segmented into conventional & organic. Though the conventional segment possesses an anticipated market share of 81.2% by 2025 end but the organic segment is likely to have a relatively higher CAGR of 6.2% over the forecast period due to consumer awareness of consuming the organic food.
By end-use, the global molasses market can be segmented into industrial uses, commercial uses and household uses. The industrial segment can be further segmented into food and beverage industry, animal feed industry, biofuel industry, and other industrial applications. The industrial end-use segment is estimated to account for a significant revenue share of 76.9% in 2017 and is expected to register high growth rate during the forecast period. Furthermore, on the basis of sales channel, the molasses market is segmented into direct and indirect sales. The indirect sales segment can be further segmented into modern trade, convenience stores, online stores, and others. Amongst these segments, the direct sales segment is anticipated to occupy the largest market share of 87.2% over the forecast period, in terms of volume.
Holding Majority Share, Asia Pacific Emerged Dominant in Overall Market
On the basis of region, the market in APAC and Latin America is expected to dominate over the forecast period followed by Europe. In current era also, APAC dominates the global molasses market with an anticipated share of 42.7% over the forecast period in the global market share. The rising demand for molasses as a thickening agent, especially in bakeries and confectionaries has emerged as the chief driver of the global molasses market. Favorable policies by government and industrialization witnessed across emerging nations, will enable the molasses market prosper in Asia Pacific in the coming years.
The major key players in the global molasses market includes Michigan Sugar Company, B&G Foods, Inc., Crosby Molasses Co Ltd., Spreckels Sugar Company, Inc., Cora Texas Manufacturing Company, LLC, Malt Products Corporation, Westway Feed Products LLC, Good Food Inc., Sweet Harvest Foods Inc., Domino Specialty Ingredients.
Expansion of the Food and Beverage Sector will Augment Growth of Molasses Market
With the rapid expansion of the food and beverage industry, especially the meat and dairy products, a strong demand for adequate animal feed is gaining popularity. Molasses had been used as animal feed for a long time and is now used as a substitute to cereal grains in 1960s. Additionally, molasses, which is a viscous product that is extracted by refining sugar beets or sugarcane, also finds application in the residential, biofuel industry, and commercial sectors. This will also add impetus to the growth of the market in the coming years.
The food and refreshment industry is the essential driver of the molasses market. In this industry, the interest for prepared to eat suppers and accommodation food is heightening on the back expanded extra cash of metropolitan populaces who are noticing a fretful way of life. Furthermore, the enterprises relating to drugs and beautifiers are required to additional fuel the interest throughout the span of the following seven years. Then again, horrible climatic climate for the creation of sugarcane is relied upon to contrarily affect the market going ahead. Furthermore, the accessibility of minimal effort choices is further impeding the market from accomplishing more noteworthy productivity.
Dry molasses is progressively being utilized as an improving specialist in different food items, including prepared merchandise, pastries, snacks, chocolate confections, bars, sauces, and others. It is not difficult to utilize, has compelling usefulness, and is a straightforward wellspring of sugar. Hence, food and drink makers are progressively favoring the utilization of dry molasses as a characteristic improving specialist in items.
The food and refreshment industry is the essential factor driving the growth of the molasses market. In this industry, the interest for prepared to eat dinners and accommodation food is heightening on the back expanded extra cash of metropolitan populaces who are noticing a fretful way of life. Moreover, the enterprises relating to drugs and makeup are relied upon to additional fuel the interest throughout the span of the following seven years. Then again, horrible climatic climate for the creation of sugarcane is relied upon to adversely affect the market going ahead. Moreover, the accessibility of minimal effort choices is further frustrating the market from accomplishing more noteworthy benefit.
1. Executive Summary
2. Market Introduction
2.1. Market Definition
2.2. Market Taxonomy
3. Global Molasses Market Analysis Scenario
3.1. Market Size (US$ Mn) and Volume (MT) Forecast
3.1.1. Market Size (US$ Mn) and Volume (MT) Y-o-Y Growth
3.1.2. Absolute $ Opportunity
3.2. Industry Value and Supply Chain Analysis
3.2.1. Value Chain
3.2.2. Pricing Analysis
4. Market Dynamics
4.1. Macro-economic Factors
4.2. Drivers
4.2.1. Supply Side
4.2.2. Demand Side
4.3. Restraints
4.4. Opportunity
4.5. Trends
4.6. Forecast Factors – Relevance and Impact
4.7. Sugarcane Molasses Grades and Standards
4.8. Molasses Production and Consumption Outlook
4.9. PESTLE Analysis
5. Global Molasses Market Analysis and Forecast, By Source
5.1. Introduction
5.1.1. Basis Point Share (BPS) Analysis By Source
5.1.2. Y-o-Y Growth Projections By Source
5.2. Market Size (US$ Mn) and Volume (MT) Forecast By Source
5.2.1. Sugarcane
5.2.2. Sugarbeet
5.3. Market Attractiveness Analysis By Source
6. Global Molasses Market Analysis and Forecast, By Type
6.1. Introduction
6.1.1. Basis Point Share (BPS) Analysis By Type
6.1.2. Y-o-Y Growth Projections By Type
6.2. Market Size (US$ Mn) and Volume (MT) Forecast By Type
6.2.1. Regular Molasses
6.2.2. Blackstrap Molasses
6.2.3. Others
6.3. Market Attractiveness Analysis By Type
7. Global Molasses Market Analysis and Forecast, By Nature
7.1. Introduction
7.1.1. Basis Point Share (BPS) Analysis By Nature
7.1.2. Y-o-Y Growth Projections By Nature
7.2. Market Size (US$ Mn) and Volume (MT) Forecast By Nature
7.2.1. Organic
7.2.2. Conventional
7.3. Market Attractiveness Analysis By Nature
8. Global Molasses Market Analysis and Forecast, By End Use
8.1. Introduction
8.1.1. Basis Point Share (BPS) Analysis By End Use
8.1.2. Y-o-Y Growth Projections By End Use
8.2. Market Size (US$ Mn) and Volume (MT) Forecast By End Use
8.2.1. Industrial
8.2.1.1. Food and Beverage Industry
8.2.1.2. Animal Feed Industry
8.2.1.3. Biofuel Industry
8.2.1.4. Other Industrial Application
8.2.2. Commercial
8.2.3. Household
8.3. Market Attractiveness Analysis By End Use
9. Global Molasses Market Analysis and Forecast, By Sales Channel
9.1. Introduction
9.1.1. Basis Point Share (BPS) Analysis By Sales Channel
9.1.2. Y-o-Y Growth Projections By Sales Channel
9.2. Market Size (US$ Mn) and Volume (MT) Forecast By Sales Channel
9.2.1. Direct Sales
9.2.2. Indirect Sales
9.2.2.1. Modern Trade
9.2.2.2. Convenience Stores
9.2.2.3. Online Stores
9.2.3. Others
9.3. Market Attractiveness Analysis By Sales Channel
10. Global Molasses Market Analysis and Forecast, By Region
10.1. Introduction
10.1.1. Basis Point Share (BPS) Analysis By Region
10.1.2. Y-o-Y Growth Projections By Region
10.2. Market Size (US$ Mn) and Volume (MT) Forecast By Region
10.2.1. North America
10.2.2. Europe
10.2.3. APAC
10.2.4. Latin America
10.2.5. Middle East and Africa
10.3. Market Attractiveness Analysis By Region
11. North America Molasses Market Analysis and Forecast
11.1. Introduction
11.1.1. Basis Point Share (BPS) Analysis By Country
11.1.2. Y-o-Y Growth Projections By Country
11.2. Market Size (US$ Mn) and Volume (MT) Forecast By Country
11.2.1. U.S.
11.2.2. Canada
11.3. Market Size (US$ Mn) and Volume (MT) Forecast By Source
11.3.1. Sugarcane
11.3.2. Sugarbeet
11.4. Market Size (US$ Mn) and Volume (MT) Forecast By Type
11.4.1. Regular Molasses
11.4.2. Blackstrap Molasses
11.4.3. Others
11.5. Market Size (US$ Mn) and Volume (MT) Forecast By Nature
11.5.1. Organic
11.5.2. Conventional
11.6. Market Size (US$ Mn) and Volume (MT) Forecast By End Use
11.6.1. Industrial
11.6.1.1. Food and Beverage Industry
11.6.1.2. Animal Feed Industry
11.6.1.3. Biofuel Industry
11.6.1.4. Other Industrial Application
11.6.2. Commercial
11.6.3. Household
11.7. Market Size (US$ Mn) and Volume (MT) Forecast By Sales Channel
11.7.1. Direct Sales
11.7.2. Indirect Sales
11.7.2.1. Modern Trade
11.7.2.2. Convenience Stores
11.7.2.3. Online Stores
11.7.3. Others
11.8. Market Attractiveness Analysis
11.8.1. By Country
11.8.2. By Source
11.8.3. By Type
11.8.4. By Nature
11.8.5. By End Use
11.8.6. By Sales Channel
11.9. Prominent Trends
11.10. Drivers and Restraints: Impact Analysis
12. Latin America Molasses Market Analysis and Forecast
12.1. Introduction
12.1.1. Basis Point Share (BPS) Analysis By Country
12.1.2. Y-o-Y Growth Projections By Country
12.2. Market Size (US$ Mn) and Volume (MT) Forecast By Country
12.2.1. Brazil
12.2.2. Mexico
12.2.3. Rest of Latin America
12.3. Market Size (US$ Mn) and Volume (MT) Forecast By Source
12.3.1. Sugarcane
12.3.2. Sugarbeet
12.4. Market Size (US$ Mn) and Volume (MT) Forecast By Type
12.4.1. Regular Molasses
12.4.2. Blackstrap Molasses
12.4.3. Others
12.5. Market Size (US$ Mn) and Volume (MT) Forecast By Nature
12.5.1. Organic
12.5.2. Conventional
12.6. Market Size (US$ Mn) and Volume (MT) Forecast By End Use
12.6.1. Industrial
12.6.1.1. Food and Beverage Industry
12.6.1.2. Animal Feed Industry
12.6.1.3. Biofuel Industry
12.6.1.4. Other Industrial Application
12.6.2. Commercial
12.6.3. Household
12.7. Market Size (US$ Mn) and Volume (MT) Forecast By Sales Channel
12.7.1. Direct Sales
12.7.2. Indirect Sales
12.7.2.1. Modern Trade
12.7.2.2. Convenience Stores
12.7.2.3. Online Stores
12.7.3. Others
12.8. Market Attractiveness Analysis
12.8.1. By Country
12.8.2. By Source
12.8.3. By Type
12.8.4. By Nature
12.8.5. By End Use
12.8.6. By Sales Channel
12.9. Prominent Trends
12.10. Drivers and Restraints: Impact Analysis
13. Europe Molasses Market Analysis and Forecast
13.1. Introduction
13.1.1. Basis Point Share (BPS) Analysis By Country
13.1.2. Y-o-Y Growth Projections By Country
13.2. Market Size (US$ Mn) and Volume (MT) Forecast By Country
13.2.1. Germany
13.2.2. France
13.2.3. U.K.
13.2.4. Italy
13.2.5. Spain
13.2.6. Rest of Europe
13.3. Market Size (US$ Mn) and Volume (MT) Forecast By Source
13.3.1. Sugarcane
13.3.2. Sugarbeet
13.4. Market Size (US$ Mn) and Volume (MT) Forecast By Type
13.4.1. Regular Molasses
13.4.2. Blackstrap Molasses
13.4.3. Others
13.5. Market Size (US$ Mn) and Volume (MT) Forecast By Nature
13.5.1. Organic
13.5.2. Conventional
13.6. Market Size (US$ Mn) and Volume (MT) Forecast By End Use
13.6.1. Industrial
13.6.1.1. Food and Beverage Industry
13.6.1.2. Animal Feed Industry
13.6.1.3. Biofuel Industry
13.6.1.4. Other Industrial Application
13.6.2. Commercial
13.6.3. Household
13.7.Market Size (US$ Mn) and Volume (MT) Forecast By Sales Channel
13.7.1. Direct Sales
13.7.2. Indirect Sales
13.7.2.1. Modern Trade
13.7.2.2. Convenience Stores
13.7.2.3. Online Stores
13.7.3. Others
13.8. Market Attractiveness Analysis
13.8.1. By Country
13.8.2. By Source
13.8.3. By Type
13.8.4. By Nature
13.8.5. By End Use
13.8.6. By Sales Channel
13.9. Prominent Trends
13.10. Drivers and Restraints: Impact Analysis
14. APAC Molasses Market Analysis and Forecast
14.1. Introduction
14.1.1. Basis Point Share (BPS) Analysis By Country
14.1.2. Y-o-Y Growth Projections By Country
14.2. Market Size (US$ Mn) and Volume (MT) Forecast By Country
14.2.1. China
14.2.2. India
14.2.3. Japan
14.2.4. ASEAN
14.2.5. Australia and New Zealand
14.2.6. Rest of APAC
14.3. Market Size (US$ Mn) and Volume (MT) Forecast By Source
14.3.1. Sugarcane
14.3.2. Sugarbeet
14.4. Market Size (US$ Mn) and Volume (MT) Forecast By Type
14.4.1. Regular Molasses
14.4.2. Blackstrap Molasses
14.4.3. Others
14.5. Market Size (US$ Mn) and Volume (MT) Forecast By Nature
14.5.1. Organic
14.5.2. Conventional
14.6. Market Size (US$ Mn) and Volume (MT) Forecast By End Use
14.6.1. Industrial
14.6.1.1. Food and Beverage Industry
14.6.1.2. Animal Feed Industry
14.6.1.3. Biofuel Industry
14.6.1.4. Other Industrial Application
14.6.2. Commercial
14.6.3. Household
14.7. Market Size (US$ Mn) and Volume (MT) Forecast By Sales Channel
14.7.1. Direct Sales
14.7.2. Indirect Sales
14.7.2.1. Modern Trade
14.7.2.2. Convenience Stores
14.7.2.3. Online Stores
14.7.3. Others
14.8. Market Attractiveness Analysis
14.8.1. By Country
14.8.2. By Source
14.8.3. By Type
14.8.4. By Nature
14.8.5. By End Use
14.8.6. By Sales Channel
14.9. Prominent Trends
14.10. Drivers and Restraints: Impact Analysis
15. Middle East and Africa Molasses Market Analysis and Forecast
15.1. Introduction
15.1.1. Basis Point Share (BPS) Analysis By Country
15.1.2. Y-o-Y Growth Projections By Country
15.2. Market Size (US$ Mn) and Volume (MT) Forecast By Country
15.2.1. GCC Countries
15.2.2. Africa
15.2.3. Rest of MEA
15.3. Market Size (US$ Mn) and Volume (MT) Forecast By Source
15.3.1. Sugarcane
15.3.2. Sugarbeet
15.4. Market Size (US$ Mn) and Volume (MT) Forecast By Type
15.4.1. Regular Molasses
15.4.2. Blackstrap Molasses
15.4.3. Others
15.5. Market Size (US$ Mn) and Volume (MT) Forecast By Nature
15.5.1. Organic
15.5.2. Conventional
15.6. Market Size (US$ Mn) and Volume (MT) Forecast By End Use
15.6.1. Industrial
15.6.1.1. Food and Beverage Industry
15.6.1.2. Animal Feed Industry
15.6.1.3. Biofuel Industry
15.6.1.4. Other Industrial Application
15.6.2. Commercial
15.6.3. Household
15.7. Market Size (US$ Mn) and Volume (MT) Forecast By Sales Channel
15.7.1. Direct Sales
15.7.2. Indirect Sales
15.7.2.1. Modern Trade
15.7.2.2. Convenience Stores
15.7.2.3. Online Stores
15.7.3. Others
15.8. Market Attractiveness Analysis
15.8.1. By Country
15.8.2. By Source
15.8.3. By Type
15.8.4. By Nature
15.8.5. By End Use
15.8.6. By Sales Channel
15.9. Prominent trends
15.10. Drivers and Restraints: Impact Analysis
16. Competition Landscape (This is a tentative list of companies. However, it may change during the project kick-off)
16.1. Competition Dashboard
16.2. Market Structure
16.3. Company Profiles (Details–Overview, Product Offerings, Financials, Strategy, Recent Developments)
16.3.1. Michigan Sugar Company
16.3.2. B&G Foods, Inc.
16.3.3. Crosby Molasses Co Ltd.
16.3.4. Spreckels Sugar Company, Inc.
16.3.5. Cora Texas Manufacturing Company, LLC.
16.3.6. Malt Products Corporation
16.3.7. Westway Feed Products LLC
16.3.8. Good Food Inc.
16.3.9. Sweet Harvest Foods Inc.
16.3.10. Domino Specialty Ingredients
16.3.11. K.K. Birla Group of sugar companies
16.3.12. Indiana Sugars, Inc.
16.3.13. Nordzucker AG
16.3.14. Tully Sugar Limited
16.3.15. Mackay Sugar Limited
16.3.16. Wholesome Sweeteners, Inc.
16.3.17. Biosev
16.3.18. Argentbio
16.3.19. Nippon Beet Sugar Manufacturing Co., Ltd.
16.3.20. Bajaj Hindusthan Sugar Limited
17. Assumptions and Acronyms Used
18. Research Methodology
List of Tables
Table 1: Global Molasses Market Value (US$ Mn) Forecast by Source, 2016-2025
Table 2: Global Molasses Market Volume (MT) Forecast by Source, 2016-2025
Table 3: Global Molasses Market Value (US$ Mn) Forecast by Type, 2016-2025
Table 4: Global Molasses Market Volume (MT) Forecast by Type, 2016-2025
Table 5: Global Molasses Market Value (US$ Mn) Forecast by Nature, 2016-2025
Table 6: Global Molasses Market Volume (MT) Forecast by Nature, 2016-2025
Table 7: Global Molasses Market Value (US$ Mn) Forecast by End Use, 2016-2025
Table 8: Global Molasses Market Volume (MT) Forecast by End Use, 2016-2025
Table 9: Global Molasses Market Value (US$ Mn) Forecast by Sales Channel, 2016-2025
Table 10: Global Molasses Market Volume (MT) Forecast by Sales Channel, 2016-2025
Table 11: Global Molasses Market Value (US$ Mn) Forecast by Region, 2016-2025
Table 12: Global Molasses Market Volume (MT) Forecast by Region, 2016-2025
Table 13: North America Molasses Market Value (US$ Mn) Forecast by Country, 2016-2025
Table 14: North America Molasses Market Volume (MT) Forecast by Country, 2016-2025
Table 15: North America Molasses Market Value (US$ Mn) Forecast by Source, 2016-2025
Table 16: North America Molasses Market Volume (MT) Forecast by Source, 2016-2025
Table 17: North America Molasses Market Value (US$ Mn) Forecast by Type, 2016-2025
Table 18: North America Molasses Market Volume (MT) Forecast by Type, 2016-2025
Table 19: North America Molasses Market Value (US$ Mn) Forecast by Nature, 2016-2025
Table 20: North America Molasses Market Volume (MT) Forecast by Nature, 2016-2025
Table 21: North America Molasses Market Value (US$ Mn) Forecast by End Use, 2016-2025
Table 22: North America Molasses Market Volume (MT) Forecast by End Use, 2016-2025
Table 23: North America Molasses Market Value (US$ Mn) Forecast by Sales Channel, 2016-2025
Table 24: North America Molasses Market Volume (MT) Forecast by Sales Channel, 2016-2025
Table 25: Latin America Molasses Market Value (US$ Mn) Forecast by Country, 2016-2025
Table 26: Latin America Molasses Market Volume (MT) Forecast by Country, 2016-2025
Table 27: Latin America Molasses Market Value (US$ Mn) Forecast by Source, 2016-2025
Table 28: Latin America Molasses Market Volume (MT) Forecast by Source, 2016-2025
Table 29: Latin America Molasses Market Value (US$ Mn) Forecast by Type, 2016-2025
Table 30: Latin America Molasses Market Volume (MT) Forecast by Type, 2016-2025
Table 31: Latin America Molasses Market Value (US$ Mn) Forecast by Nature, 2016-2025
Table 32: Latin America Molasses Market Volume (MT) Forecast by Nature, 2016-2025
Table 33: Latin America Molasses Market Value (US$ Mn) Forecast by End Use, 2016-2025
Table 34: Latin America Molasses Market Volume (MT) Forecast by End Use, 2016-2025
Table 35: Latin America Molasses Market Value (US$ Mn) and Volume (MT) Forecast by Sales Channel, 2016-2025
Table 36: Latin America Molasses Market Value (US$ Mn) and Volume (MT) Forecast by Sales Channel, 2016-2025
Table 37: Europe Molasses Market Value (US$ Mn) Forecast by Country, 2016-2025
Table 38: Europe Molasses Market Volume (MT) Forecast by Country, 2016-2025
Table 39: Europe Molasses Market Value (US$ Mn) Forecast by Source, 2016-2025
Table 40: Europe Molasses Market Volume (MT) Forecast by Source, 2016-2025
Table 41: Europe Molasses Market Value (US$ Mn) Forecast by Type, 2016-2025
Table 42: Europe Molasses Market Volume (MT) Forecast by Type, 2016-2025
Table 43: Europe Molasses Market Value (US$ Mn) Forecast by Nature, 2016-2025
Table 44: Europe Molasses Market Volume (MT) Forecast by Nature, 2016-2025
Table 45: Europe Molasses Market Value (US$ Mn) Forecast by End Use, 2016-2025
Table 46: Europe Molasses Market Volume (MT) Forecast by End Use, 2016-2025
Table 47: Europe Molasses Market Value (US$ Mn) Forecast by Sales Channel, 2016-2025
Table 48: North America Molasses Market Volume (MT) Forecast by Sales Channel, 2016-2025
Table 49: APAC Molasses Market Value (US$ Mn) Forecast by Country, 2016-2025
Table 50: APAC Molasses Market Volume (MT) Forecast by Country, 2016-2025
Table 51: APAC Molasses Market Value (US$ Mn) Forecast by Source, 2016-2025
Table 52: APAC Molasses Market Volume (MT) Forecast by Source, 2016-2025
Table 53: APAC Molasses Market Value (US$ Mn) Forecast by Type, 2016-2025
Table 54: APAC Molasses Market Volume (MT) Forecast by Type, 2016-2025
Table 55: APAC Molasses Market Value (US$ Mn) Forecast by Nature, 2016-2025
Table 56: APAC Molasses Market Volume (MT) Forecast by Nature, 2016-2025
Table 57: APAC Market Value (US$ Mn) Forecast by End Use, 2016-2025
Table 58: APAC Market Volume (MT) Forecast by End Use, 2016-2025
Table 59: APAC Molasses Market Value (US$ Mn) Forecast by Sales Channel, 2016-2025
Table 60: APAC Molasses Market Volume (MT) Forecast by Sales Channel, 2016-2025
Table 61: MEA Molasses Market Value (US$ Mn) Forecast by Country, 2016-2025
Table 62: MEA Molasses Market Volume (MT) Forecast by Country, 2016-2025
Table 63: MEA Molasses Market Value (US$ Mn) Forecast by Source, 2016-2025
Table 64: MEA Molasses Market Volume (MT) Forecast by Source, 2016-2025
Table 65: MEA Molasses Market Value (US$ Mn) Forecast by Type, 2016-2025
Table 66: MEA Molasses Market Volume (MT) Forecast by Type, 2016-2025
Table 67: MEA Molasses Market Value (US$ Mn) Forecast by Nature, 2016-2025
Table 68: MEA Molasses Market Volume (MT) Forecast by Nature, 2016-2025
Table 69: MEA Molasses Market Value (US$ Mn) Forecast by End Use, 2016-2025
Table 70: MEA Molasses Market Volume (MT) Forecast by End Use, 2016-2025
Table 71: MEA Molasses Market Value (US$ Mn) and Volume (MT) Forecast by Sales Channel, 2016-2025
Table 72: MEA Molasses Market Value (US$ Mn) and Volume (MT) Forecast by Sales Channel, 2016-2025
List of Figures
Figure 01: Global Molasses Market Value (US$ Mn) and Volume (MT) Forecast, 2016-2025
Figure 02: Global Molasses Market Absolute $ Opportunity (US$ Mn), 2016-2025
Figure 03: Global Molasses Market Value Share (%) & BPS Analysis by Source, 2017 & 2025
Figure 04: Global Molasses Market Value Y-o-Y Growth (%) by Source, 2016-2025
Figure 05: Global Molasses Market Absolute $ Opportunity (US$ Mn) by Sugarcane Segment, 2017-2025
Figure 06: Global Molasses Market Absolute $ Opportunity (US$ Mn) by Sugarbeet Segment, 2017-2025
Figure 07: Global Molasses Market Attractiveness Index by Source, 2016-2025
Figure 08: Global Molasses Market Value Share (%) & BPS Analysis by Type, 2017 & 2025
Figure 09: Global Molasses Market Value Y-o-Y Growth (%) by Type, 2016-2025
Figure 10: Global Molasses Market Absolute $ Opportunity (US$ Mn) by Regular Molasses Segment, 2017-2025
Figure 11: Global Molasses Market Absolute $ Opportunity (US$ Mn) by Blackstrap Molasses Segment, 2017-2025
Figure 12: Global Molasses Market Absolute $ Opportunity (US$ Mn) by Other Molasses Segment, 2017-2025
Figure 13: Global Molasses Market Attractiveness Index by Type, 2016-2025
Figure 14: Global Molasses Market Value Share (%) & BPS
Figure 15: Global Molasses Market Value Y-o-Y Growth (%) by
Figure 16: Global Molasses Market Absolute $ Opportunity (US$ Mn) by Organic Segment, 2017-2025
Figure 17: Global Molasses Market Absolute $ Opportunity (US$ Mn) by Conventional Segment, 2017-2025
Figure 18: Global Molasses Market Attractiveness Index by Nature, 2016-2025
Figure 19: Global Molasses Market Value Share (%) & BPS Analysis by End Use, 2017 & 2025
Figure 20: Global Molasses Market Value Y-o-Y Growth (%) by End Use, 2016-2025
Figure 21: Global Molasses Market Absolute $ Opportunity (US$ Mn) by Industrial Segment, 2017-2025
Figure 22: Global Molasses Market Absolute $ Opportunity (US$ Mn) by Commercial Segment, 2017-2025
Figure 23: Global Molasses Market Absolute $ Opportunity (US$ Mn) by Household Segment, 2017-2025
Figure 24: Global Molasses Market Absolute $ Opportunity (US$ Mn) by Food & Beverages Industry Sub-Segment, 2017-2025
Figure 25: Global Molasses Market Absolute $ Opportunity (US$ Mn) by Animal Feed Industry Sub-Segment, 2017-2025
Figure 26: Global Molasses Market Absolute $ Opportunity (US$ Mn) by Biofuel Industry Sub-Segment, 2017-2025
Figure 27: Global Molasses Market Absolute $ Opportunity (US$ Mn) by Others Sub-Segment, 2017-2025
Figure 28: Global Molasses Market Attractiveness Index by End Use, 2016-2025
Figure 29: Global Molasses Market Value Share (%) & BPS Analysis by
Figure 30: Global Molasses Market Value Y-o-Y Growth (%) by
Figure 31: Global Molasses Market Absolute $ Opportunity (US$ Mn) by Direct Sales Segment, 2017-2025
Figure 32: Global Molasses Market Absolute $ Opportunity (US$ Mn) by Indirect Sales Segment, 2017-2025
Figure 33: Global Molasses Market Absolute $ Opportunity (US$ Mn) by Modern Trade Sub-Segment, 2017-2025
Figure 34: Global Molasses Market Absolute $ Opportunity (US$ Mn) by Convenience Stores Sub-Segment, 2017-2025
Figure 35: Global Molasses Market Absolute $ Opportunity (US$ Mn) by Online Stores Sub-Segment, 2017-2025
Figure 36: Global Molasses Market Absolute $ Opportunity (US$ Mn) by Others Sub-Segment, 2017-2025
Figure 37: Global Molasses Market Attractiveness Index by Sales Channel, 2016-2025
Figure 38: Global Molasses Market Value Share (%) & BPS
Figure 39: Global Molasses Market Value Y-o-Y Growth (%) by
Figure 40: North America Molasses Market Absolute $ Opportunity (US$ Mn), 2017-2025
Figure 41: Latin America Molasses Market Absolute $ Opportunity (US$ Mn), 2017-2025
Figure 42: Europe Molasses Market Absolute $ Opportunity (US$ Mn), 2017-2025
Figure 43: APAC Molasses Market Absolute $ Opportunity (US$ Mn), 2017-2025
Figure 44: MEA Molasses Market Absolute $ Opportunity (US$ Mn), 2017-2025
Figure 45: Global Molasses Market Attractiveness Index by Region, 2016-2025
Figure 46: North America Molasses Market Value Share (%) & BPS Analysis by Country, 2017 & 2025
Figure 47: North America Molasses Market Value Y-o-Y Growth (%) by Country, 2016-2025
Figure 48: U.S. Molasses Market Absolute $ Opportunity (US$ Mn), 2017-2025
Figure 49: Canada Molasses Market Absolute $ Opportunity (US$ Mn), 2017-2025
Figure 50: North America Molasses Market Attractiveness Index by Country, 2016-2025
Figure 51: North America Molasses Market Value Share (%) & BPS Analysis by Source, 2017 & 2025
Figure 52: North America Molasses Market Value Y-o-Y Growth (%) by Source, 2016-2025
Figure 53: North America Molasses Market Absolute $ Opportunity (US$ Mn) by Sugarcane Segment, 2017-2025
Figure 54: North America Molasses Market Absolute $ Opportunity (US$ Mn) by Sugarbeet Segment, 2017-2025
Figure 55: North America Molasses Market Attractiveness Index by Source, 2016-2025
Figure 56: North America Molasses Market Value Share (%) & BPS Analysis by Type, 2017 & 2025
Figure 57: North America Molasses Market Value Y-o-Y Growth (%) by Type, 2016-2025
Figure 58: North America Molasses Market Absolute $ Opportunity (US$ Mn) by Regular Molasses Segment, 2017-2025
Figure 59: North America Molasses Market Absolute $ Opportunity (US$ Mn) by Blackstrap Molasses Segment, 2017-2025
Figure 60: North America Molasses Market Absolute $ Opportunity (US$ Mn) by Other Molasses Segment, 2017-2025
Figure 61`: North America Molasses Market Attractiveness Index by Type, 2016-2025
Figure 62: North America Molasses Market Value Share (%) & BPS Analysis by Nature, 2017 & 2025
Figure 63: North America Molasses Market Value Y-o-Y Growth (%) by Nature, 2016-2025
Figure 64: North America Molasses Market Absolute $ Opportunity (US$ Mn) by Organic Segment, 2017-2025
Figure 65: North America Molasses Market Absolute $ Opportunity (US$ Mn) by Conventional Segment, 2017-2025
Figure 66: North America Molasses Market Attractiveness Index by Nature, 2016-2025
Figure 67: North America Molasses Market Value Share (%) & BPS Analysis by End Use, 2017 & 2025
Figure 68: North America Molasses Market Value Y-o-Y Growth (%) by End Use, 2016-2025
Figure 69: North America Molasses Market Absolute $ Opportunity (US$ Mn) by Industrial Segment, 2017-2025
Figure 70: North America Molasses Market Absolute $ Opportunity (US$ Mn) by Commercial Segment, 2017-2025
Figure 71: North America Molasses Market Absolute $ Opportunity (US$ Mn) by Household Segment, 2017-2025
Figure 72: North America Molasses Market Attractiveness Index by End Use, 2016-2025
Figure 73: North America Molasses Market Value Share (%) & BPS Analysis by Sales Channel, 2017 & 2025
Figure 74: North America Molasses Market Value Y-o-Y Growth (%) by Sales Channel, 2016-2025
Figure 75: North America Molasses Market Absolute $ Opportunity (US$ Mn) by Direct Sales Segment, 2017-2025
Figure 76: North America Molasses Market Absolute $ Opportunity (US$ Mn) by Indirect Sales Segment, 2017-2025
Figure 77: North America Molasses Market Attractiveness Index by Sales Channel, 2016-2025
Figure 78: Latin America Molasses Market Value Share (%) & BPS Analysis by Country, 2017 & 2025
Figure 79: Latin America Molasses Market Value Y-o-Y Growth (%) by Country, 2016-2025
Figure 80: Brazil Molasses Market Absolute $ Opportunity (US$ Mn), 2017-2025
Figure 81: Mexico Molasses Market Absolute $ Opportunity (US$ Mn), 2017-2025
Figure 82: Rest of Latin America Molasses Market Absolute $ Opportunity (US$ Mn), 2017-2025
Figure 83: Latin America Molasses Market Attractiveness Index by Country, 2016-2025
Figure 84: Latin America Molasses Market Value Share (%) & BPS Analysis by Source, 2017 & 2025
Figure 85: Latin America Molasses Market Value Y-o-Y Growth (%) by Source, 2016-2025
Figure 86: Latin America Molasses Market Absolute $ Opportunity (US$ Mn) by Sugarcane Segment, 2017-2025
Figure 87: Latin America Molasses Market Absolute $ Opportunity (US$ Mn) by Sugarbeet Segment, 2017-2025
Figure 88: Latin America Molasses Market Attractiveness Index by Source, 2016-2025
Figure 89: Latin America Molasses Market Value Share (%) & BPS Analysis by Type, 2017 & 2025
Figure 90: Latin America Molasses Market Value Y-o-Y Growth (%) by Type, 2016-2025
Figure 91: Latin America Molasses Market Absolute $ Opportunity (US$ Mn) by Regular Molasses Segment, 2017-2025
Figure 92: Latin America Molasses Market Absolute $ Opportunity (US$ Mn) by Blackstrap Molasses Segment, 2017-2025
Figure 93: Latin America Molasses Market Absolute $ Opportunity (US$ Mn) by Other Molasses Segment, 2017-2025
Figure 94: Latin America Molasses Market Attractiveness Index by Type, 2016-2025
Figure 95: Latin America Molasses Market Value Share (%) & BPS Analysis by Nature, 2017 & 2025
Figure 96: Latin America Molasses Market Value Y-o-Y Growth (%) by Nature, 2016-2025
Figure 97: Latin America Molasses Market Absolute $ Opportunity (US$ Mn) by Organic Segment, 2017-2025
Figure 98: Latin America Molasses Market Absolute $ Opportunity (US$ Mn) by Conventional Segment, 2017-2025
Figure 99: Latin America Molasses Market Attractiveness Index by Nature, 2016-2025
Figure 100: Latin America Molasses Market Value Share (%) & BPS Analysis by End Use, 2017 & 2025
Figure 101: Latin America Molasses Market Value Y-o-Y Growth (%) by End Use, 2016-2025
Figure 102: Latin America Molasses Market Absolute $ Opportunity (US$ Mn) by Industrial Segment, 2017-2025
Figure 103: Latin America Molasses Market Absolute $ Opportunity (US$ Mn) by Commercial Segment, 2017-2025
Figure 104: Latin America Molasses Market Absolute $ Opportunity (US$ Mn) by Household Segment, 2017-2025
Figure 105: Latin America Molasses Market Attractiveness Index by End Use, 2016-2025
Figure 106: Latin America Molasses Market Value Share (%) & BPS Analysis by Sales Channel, 2017 & 2025
Figure 107: Latin America Molasses Market Value Y-o-Y Growth (%) by Sales Channel, 2016-2025
Figure 108: Latin America Molasses Market Absolute $ Opportunity (US$ Mn) by Direct Sales Segment, 2017-2025
Figure 109: Latin America Molasses Market Absolute $ Opportunity (US$ Mn) by Indirect Sales Segment, 2017-2025
Figure 110: Latin America Molasses Market Attractiveness Index by Sales Channel, 2016-2025
Figure 111: Europe Molasses Market Value Share (%) & BPS Analysis by Country, 2017 & 2025
Figure 112: Europe Molasses Market Value Y-o-Y Growth (%) by Country, 2016-2025
Figure 113: U.K. Molasses Market Absolute $ Opportunity (US$ Mn), 2017-2025
Figure 114: Germany Molasses Market Absolute $ Opportunity (US$ Mn), 2017-2025
Figure 115: France Molasses Market Absolute $ Opportunity (US$ Mn), 2017-2025
Figure 116: Italy Molasses Market Absolute $ Opportunity (US$ Mn), 2017-2025
Figure 117: Spain Molasses Market Absolute $ Opportunity (US$ Mn), 2017-2025
Figure 118: Rest of Europe Molasses Market Absolute $ Opportunity (US$ Mn), 2017-2025
Figure 119: Europe Molasses Market Attractiveness Index by
Figure 120: Europe Molasses Market Value Share (%) & BPS Analysis by Source, 2017 & 2025
Figure 121: Europe Molasses Market Value Y-o-Y Growth (%) by Source, 2016-2025
Figure 122: Europe Molasses Market Absolute $ Opportunity (US$ Mn) by Sugarcane Segment, 2017-2025
Figure 123: Europe Molasses Market Absolute $ Opportunity (US$ Mn) by Sugarbeet Segment, 2017-2025
Figure 124: Europe Molasses Market Attractiveness Index by Source, 2016-2025
Figure 125: Europe Molasses Market Value Share (%) & BPS Analysis by Type, 2017 & 2025
Figure 126: Europe Molasses Market Value Y-o-Y Growth (%) by Type, 2016-2025
Figure 127: Europe Molasses Market Absolute $ Opportunity (US$ Mn) by Regular Molasses Segment, 2017-2025
Figure 128: Europe Molasses Market Absolute $ Opportunity (US$ Mn) by Blackstrap Molasses Segment, 2017-2025
Figure 129: Europe Molasses Market Absolute $ Opportunity (US$ Mn) by Other Molasses Segment, 2017-2025
Figure 130: Europe Molasses Market Attractiveness Index by Type, 2016-2025
Figure 131: Europe Molasses Market Value Share (%) & BPS Analysis by Nature, 2017 & 2025
Figure 132: Europe Molasses Market Value Y-o-Y Growth (%) by Nature, 2016-2025
Figure 133: Europe Molasses Market Absolute $ Opportunity (US$ Mn) by Organic Segment, 2017-2025
Figure 134: Europe Molasses Market Absolute $ Opportunity (US$ Mn) by Conventional Segment, 2017-2025
Figure 135: Europe Molasses Market Attractiveness Index by Nature, 2016-2025
Figure 136: Europe Molasses Market Value Share (%) & BPS Analysis by End Use, 2017 & 2025
Figure 137: Europe Molasses Market Value Y-o-Y Growth (%) by End Use, 2016-2025
Figure 138: Europe Molasses Market Absolute $ Opportunity (US$ Mn) by Industrial Segment, 2017-2025
Figure 139: Europe Molasses Market Absolute $ Opportunity (US$ Mn) by Commercial Segment, 2017-2025
Figure 140: Europe Molasses Market Absolute $ Opportunity (US$ Mn) by Household Segment, 2017-2025
Figure 141: Europe Molasses Market Attractiveness Index by End Use, 2016-2025
Figure 142: Europe Molasses Market Value Share (%) & BPS Analysis by Sales Channel, 2017 & 2025
Figure 143: Europe Molasses Market Value Y-o-Y Growth (%) by Sales Channel, 2016-2025
Figure 144: Europe Molasses Market Absolute $ Opportunity (US$ Mn) by Direct Sales Segment, 2017-2025
Figure 145: Europe Molasses Market Absolute $ Opportunity (US$ Mn) by Indirect Sales Segment, 2017-2025
Figure 146: Europe Molasses Market Attractiveness Index by Sales Channel, 2016-2025
Figure 147: APAC Molasses Market Value Share (%) & BPS Analysis by Country, 2017 & 2025
Figure 148: APAC Molasses Market Value Y-o-Y Growth (%) by Country, 2016-2025
Figure 149: China Molasses Market Absolute $ Opportunity (US$ Mn), 2017-2025
Figure 150: India Molasses Market Absolute $ Opportunity (US$ Mn), 2017-2025
Figure 151: Japan Molasses Market Absolute $ Opportunity (US$ Mn), 2017-2025
Figure 152: Australia & New Zealand Molasses Market Absolute $ Opportunity (US$ Mn), 2017-2025
Figure 153: Rest of APAC Molasses Market Absolute $ Opportunity (US$ Mn), 2017-2025
Figure 154: APAC Molasses Market Attractiveness Index by Country, 2016-2025
Figure 155: APAC Molasses Market Value Share (%) & BPS Analysis by Source, 2017 & 2025
Figure 256: APAC Molasses Market Value Y-o-Y Growth (%) by Source, 2016-2025
Figure 157: APAC Molasses Market Absolute $ Opportunity (US$ Mn) by Sugarcane Segment, 2017-2025
Figure 158: APAC Molasses Market Absolute $ Opportunity (US$ Mn) by Sugarbeet Segment, 2017-2025
Figure 159: APAC Molasses Market Attractiveness Index by Source, 2016-2025
Figure 160: APAC Molasses Market Value Share (%) & BPS Analysis by Type, 2017 & 2025
Figure 161: APAC Molasses Market Value Y-o-Y Growth (%) by Type, 2016-2025
Figure 162: APAC Molasses Market Absolute $ Opportunity (US$ Mn) by Regular Molasses Segment, 2017-2025
Figure 163: APAC Molasses Market Absolute $ Opportunity (US$ Mn) by Blackstrap Molasses Segment, 2017-2025
Figure 164: APAC Molasses Market Absolute $ Opportunity (US$ Mn) by Other Molasses Segment, 2017-2025
Figure 165: APAC Molasses Market Attractiveness Index by Type, 2016-2025
Figure 166: APAC Molasses Market Value Share (%) & BPS Analysis by Nature, 2017 & 2025
Figure 167: APAC Molasses Market Value Y-o-Y Growth (%) by Nature, 2016-2025
Figure 168: APAC Molasses Market Absolute $ Opportunity (US$ Mn) by Organic Segment, 2017-2025
Figure 169: APAC Molasses Market Absolute $ Opportunity (US$ Mn) by Conventional Segment, 2017-2025
Figure 170: APAC Molasses Market Attractiveness Index by Nature, 2016-2025
Figure 171: APAC Molasses Market Value Share (%) & BPS Analysis by End Use, 2017 & 2025
Figure 172: APAC Molasses Market Value Y-o-Y Growth (%) by End Use, 2016-2025
Figure 173: APAC Molasses Market Absolute $ Opportunity (US$ Mn) by Industrial Segment, 2017-2025
Figure 174: APAC Molasses Market Absolute $ Opportunity (US$ Mn) by Commercial Segment, 2017-2025
Figure 175: APAC Molasses Market Absolute $ Opportunity (US$ Mn) by Household Segment, 2017-2025
Figure 176: APAC Molasses Market Attractiveness Index by End Use, 2016-2025
Figure 177: APAC Molasses Market Value Share (%) & BPS Analysis by Sales Channel, 2017 & 2025
Figure 178: APAC Molasses Market Value Y-o-Y Growth (%) by Sales Channel, 2016-2025
Figure 179: APAC Molasses Market Absolute $ Opportunity (US$ Mn) by Direct Sales Segment, 2017-2025
Figure 180: APAC Molasses Market Absolute $ Opportunity (US$ Mn) by Indirect Sales Segment, 2017-2025
Figure 181: APAC Molasses Market Attractiveness Index by Sales Channel, 2016-2025
Figure 182: MEA Molasses Market Value Share (%) & BPS Analysis by Country, 2017 & 2025
Figure 183: MEA Molasses Market Value Y-o-Y Growth (%) by Country, 2016-2025
Figure 184: GCC Countries Molasses Market Absolute $ Opportunity (US$ Mn), 2017-2025
Figure 185: Africa Molasses Market Absolute $ Opportunity (US$ Mn), 2017-2025
Figure 186: Rest of MEA Molasses Market Absolute $ Opportunity (US$ Mn) by Household Segment, 2017-2025
Figure 187: MEA Molasses Market Attractiveness Index by Country, 2016-2025
Figure 188: MEA Molasses Market Value Share (%) & BPS Analysis by Source, 2017 & 2025
Figure 189: MEA Molasses Market Value Y-o-Y Growth (%) by Source, 2016-2025
Figure 190: MEA Molasses Market Absolute $ Opportunity (US$ Mn) by Sugarcane Segment, 2017-2025
Figure 191: MEA Molasses Market Absolute $ Opportunity (US$ Mn) by Sugarbeet Segment, 2017-2025
Figure 192: MEA Molasses Market Attractiveness Index by Source, 2016-2025
Figure 193: MEA Molasses Market Value Share (%) & BPS Analysis by Type, 2017 & 2025
Figure 194: MEA Molasses Market Value Y-o-Y Growth (%) by Type, 2016-2025
Figure 195: MEA Molasses Market Absolute $ Opportunity (US$ Mn) by Regular Molasses Segment, 2017-2025
Figure 196: MEA Molasses Market Absolute $ Opportunity (US$ Mn) by Blackstrap Molasses Segment, 2017-2025
Figure 197: MEA Molasses Market Absolute $ Opportunity (US$ Mn) by Other Molasses Segment, 2017-2025
Figure 198: MEA Molasses Market Attractiveness Index by Type, 2016-2025
Figure 199: MEA Molasses Market Value Share (%) & BPS Analysis by Nature, 2017 & 2025
Figure 200: MEA Molasses Market Value Y-o-Y Growth (%) by Nature, 2016-2025
Figure 201: MEA Molasses Market Absolute $ Opportunity (US$ Mn) by Organic Segment, 2017-2025
Figure 202: MEA Molasses Market Absolute $ Opportunity (US$ Mn) by Conventional Segment, 2017-2025
Figure 203: MEA Molasses Market Attractiveness Index by Nature, 2016-2025
Figure 204: MEA Molasses Market Value Share (%) & BPS Analysis by End Use, 2017 & 2025
Figure 205: MEA Molasses Market Value Y-o-Y Growth (%) by End Use, 2016-2025
Figure 206: MEA Molasses Market Absolute $ Opportunity (US$ Mn) by Industrial Segment, 2017-2025
Figure 207: MEA Molasses Market Absolute $ Opportunity (US$ Mn) by Commercial Segment, 2017-2025
Figure 208: MEA Molasses Market Absolute $ Opportunity (US$ Mn) by Household Segment, 2017-2025
Figure 209: MEA Molasses Market Attractiveness Index by End Use, 2016-2025
Figure 210: MEA Molasses Market Value Share (%) & BPS Analysis by Sales Channel, 2017 & 2025
Figure 211: MEA Molasses Market Value Y-o-Y Growth (%) by Sales Channel, 2016-2025
Figure 212: MEA Molasses Market Absolute $ Opportunity (US$ Mn) by Direct Sales Segment, 2017-2025
Figure 213: MEA Molasses Market Absolute $ Opportunity (US$ Mn) by Indirect Sales Segment, 2017-2025
Figure 214: MEA Molasses Market Attractiveness Index by Sales Channel, 2016-2025
Copyright © Transparency Market Research, Inc. All Rights reserved
Trust Online

Molasses Market