
Reports
Reports
The global micro data center market is expected to grow due to a strong demand for self–contained containers with integrated hardware to sustain the capacities of important IT parts with monitoring and control software devices. When compared to typical larger data centers, a micro data center refers to a unified physical infrastructure option that dramatically minimizes project timeline. This allows participants in the global micro data center market to cut down deployment time. Depending on available electrical capacity, space and, bandwidth, they can quickly expand their ability by building more micro data centers in a separate or the same site.
Increasing use of edge computing technologies due to demand from compute-intensive uses such as Artificial Intelligence and Internet of Things (IoT) is expected to boost market revenue. The demand for high-performance and reliable data centers has increased as a result of increased digital service usage, which has resulted in a significant increase in data. By moving data centers nearer to the application, bandwidth expenses and latency difficulties are reduced. In August 2020, EdgeMicro successfully opened mini data centers around the US to provide improved edge solutions in underserved markets and create stronger and better connectivity options.
The rising energy consumption of data centers has prompted various government administrations to place a greater emphasis on lowering consumption of energy and improving Power Usage Effectiveness (PUE). To maintain the optimal operation of data centers, market participants are focused on offering high–quality cooling solutions.
IoT, AI, and edge computing apps are driving up demand for higher chip and rack power densities in the industry. Data center owners are concentrating on ways to increase density sans sacrificing infrastructural compactness. In AI-based applications, the heat profile of GPU-based servers is twice that of traditional data centers, increasing the necessity for effective micro data center cooling solutions. Overheating is a primary cause of data center outages, which results in significant financial losses. With the increased demand for effective cooling solutions for optimal data center operations, micro data centers are estimated to gain popularity. These factors are likely to bolster growth of the global micro data center market in the years to come.
Global Micro Data Center Market: Snapshot
The global micro data center market is gaining from the changing data center needs of enterprises. A large number of enterprises are increasingly adopting micro data centers to store critical data either on premise or in remote locations. Micro data centers exhibit virtues of simplified workload that traditional data centers lack. As a result, enterprises are switching from local facilities to automated micro data centers for information storage.
Some other features of micro data centers include scalability, customizability, cost effectiveness, and are self-contained. In addition, micro data centers are portable and occupy very less space as compared to traditional data centers. Nevertheless, micro data centers are equipped with components of traditional data centers such as in-built cooling systems, security systems, fire suppression systems, monitoring systems, telecommunication and storage system, and uninterruptible power supply (UPS).
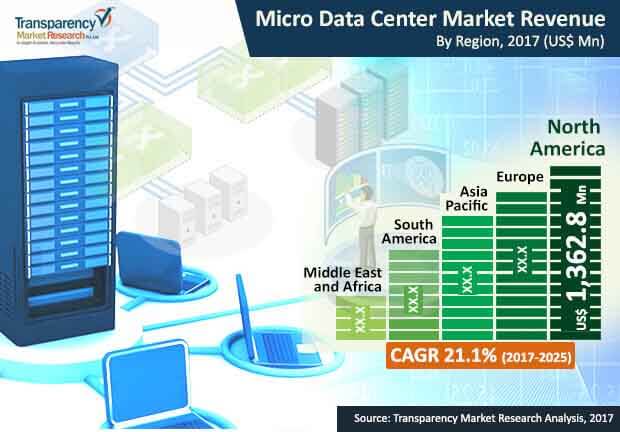
A report by Transparency Market Research (TMR) estimates the global micro data center market to rise at an impressive 21.1% CAGR over the forecast period between 2017 and 2025. At this pace, the market will be valued at US$14,813.2 mn by the end of 2025 from US$3,208.9 mn in 2016.
Less than 25 U Segment to Emerge Significant
The global micro data center market is broadly categorized on the basis of rack size, end use industry, and geography. On the basis of rack size, the market has been bifurcated into less than 25 U, 25 U – 40 U, and more than 40 U. Among them, the more than 40 U segment holds the leading market share; the segment accounted for 54.0% revenue contribution to the overall market in 2016. However, less than 25 U segment is anticipated to display the leading CAGR over the forecast period.
Based on end-use industry, the global micro data center market is segmented into IT and telecom, retail, education, BFSI, healthcare, energy, and others. Of them, in 2016, IT and telecom held the leading revenue share in the overall market. However, the retail segment is predicted to display the leading CAGR over the forecast period. The growth of the retail segment is mainly because of expansion of ecommerce and rising adoption of micro data centers for point of sale systems for improved efficiency and productivity.
Emergence of Several Regional Service Providers Makes Europe a Key Market
On the basis of region, the segments into which the global micro data center market is divided are North America, Asia Pacific, Europe, the Middle East and Africa, and South America. North America, among all, is currently the leading regional market for micro data center. In 2016, North America held 43.2% revenue of the overall micro data center market. Going forward, North America is estimated to display an impressive 18.6% CAGR over the forecast period. The growth in the region is mainly because of significant demand for micro data centers from IT and Telecom verticals in the U.S. and Canada. The retail sector also accounts for significant revenue contribution to North America micro data center market.
Europe is currently the second leading market for micro data centers. The growth in the region is mainly because of increasing demand for IT convergence and integration among enterprises from a host of industry verticals. Due to the rising demand, a number of regional players have emerged in the region to provide cost effective micro data center solutions to end users. In Europe, the U.K. is anticipated to emerge as the leading domestic market in 2017.
Leading players in the global micro data center market include Eaton Corporation plc, Hitachi Ltd., Panduit Corp., Zellabox Dataracks, Hewlett Packard Enterprise Development LP, Instant Data Centers, Huawei Technologies Co. Ltd., Rittal GmbH & Co. KG, and Schneider Electric SE.
1. Preface
1.1. Report Scope and Segmentation
1.2. Key Research Objectives and Highlights
2. Assumptions and Research Methodology
3. Executive Summary : Micro Data Center Market
4. Overview
4.1. Introduction
4.1.1. Definition
4.1.2. Functional Model
4.2. Market Dynamics
4.2.1. Drivers
4.2.2. Restraints
4.2.3. Opportunity
4.3. Key Trends
4.4. Global Micro Data Center Market Analysis and Forecasts, 2015 – 2025
4.4.1. Market Revenue Projections (US$ Mn)
4.5. Porter’s Five Force Analysis
4.6. Value Chain Analysis
4.7. Market Outlook
5. Global Micro Data Center Market Analysis and Forecast by Rack Size
5.1. Introduction & Definition
5.2. Key Findings / Developments
5.3. Micro Data Center Market Size (US$ Mn) and Forecast by Rack Size, 2015 – 2025
5.3.1. Less than 25 RU
5.3.2. 25 RU – 50 RU
5.3.3. More than 50 RU
5.4. Rack Size Comparison Matrix
5.5. Market Attractiveness by Rack Size
6. Global Micro Data Center Market Analysis and Forecast by End-Use Industry
6.1. Introduction
6.2. Key Findings / Developments
6.3. Micro Data Center Market Size (US$ Mn) and Forecast by End-Use Industry, 2015 – 2025
6.3.1. IT and telecom
6.3.2. Retail
6.3.3. BFSI
6.3.4. Healthcare
6.3.5. Energy
6.3.6. Others
6.4. End-Use Industry Comparison Matrix
6.5. Market Attractiveness by End-Use Industry
7. Global Micro Data Center Market Analysis and Forecasts, by Region
7.1. Key Findings
7.2. Micro Data Center Market Size (US$ Mn) Forecast by Region, 2015 – 2025
7.2.1. North America
7.2.2. Europe
7.2.3. Asia Pacific
7.2.4. Middle East and Africa
7.2.5. South America
7.3. Market Attractiveness by Region
8. North America Micro Data Center Market Size and Forecast
8.1. Key Findings
8.2. Key Trends
8.3. Micro Data Center Market Size (US$ Mn) and Forecast by Rack Size, 2015 – 2025
8.3.1. Less than 25 RU
8.3.2. 25 RU – 50 RU
8.3.3. More than 50 RU
8.4. Micro Data Center Market Size (US$ Mn) and Forecast by End-Use Industry, 2015 – 2025
8.4.1. IT and telecom
8.4.2. Retail
8.4.3. BFSI
8.4.4. Healthcare
8.4.5. Energy
8.4.6. Others
8.5. Micro Data Center Market Size (US$ Mn) and Forecast by Country, 2015 – 2025
8.5.1. The U.S.
8.5.1.1. Micro Data Center Market Size (US$ Mn) and Forecast by Rack Size, 2015 – 2025
8.5.1.1.1. Less than 25 RU
8.5.1.1.2. 25 RU – 50 RU
8.5.1.1.3. More than 50 RU
8.5.1.2. Micro Data Center Market Size (US$ Mn) and Forecast by End-Use Industry, 2015 – 2025
8.5.1.2.1. IT and telecom
8.5.1.2.2. Retail
8.5.1.2.3. BFSI
8.5.1.2.4. Healthcare
8.5.1.2.5. Energy
8.5.1.2.6. Others
8.5.2. Canada
8.5.2.1. Micro Data Center Market Size (US$ Mn) and Forecast by Rack Size, 2015 – 2025
8.5.2.1.1. Less than 25 RU
8.5.2.1.2. 25 RU – 50 RU
8.5.2.1.3. More than 50 RU
8.5.2.2. Micro Data Center Market Size (US$ Mn) and Forecast by End-Use Industry, 2015 – 2025
8.5.2.2.1. IT and telecom
8.5.2.2.2. Retail
8.5.2.2.3. BFSI
8.5.2.2.4. Healthcare
8.5.2.2.5. Energy
8.5.2.2.6. Others
8.5.3. Rest of North America
8.6. Micro Data Center Market Attractiveness Analysis
8.6.1. By Rack Size
8.6.2. By End-Use Industry
8.6.3. By Country
9. Europe Micro Data Center Market Size and Forecast
9.1. Key Findings
9.2. Key Trends
9.3. Micro Data Center Market Size (US$ Mn ) and Forecast by Rack Size, 2015 – 2025
9.3.1. Less than 25 RU
9.3.2. 25 RU – 50 RU
9.3.3. More than 50 RU
9.4. Micro Data Center Market Size (US$ Mn) and Forecast by End-Use Industry, 2015 – 2025
9.4.1. IT and telecom
9.4.2. Retail
9.4.3. BFSI
9.4.4. Healthcare
9.4.5. Energy
9.4.6. Others
9.5. Micro Data Center Market Size (US$ Mn ) and Forecast by Country, 2015 – 2025
9.5.1. The U.K.
9.5.1.1. Micro Data Center Market Size (US$ Mn) and Forecast by Rack Size, 2015 – 2025
9.5.1.1.1. Less than 25 RU
9.5.1.1.2. 25 RU – 50 RU
9.5.1.1.3. More than 50 RU
9.5.1.2. Micro Data Center Market Size (US$ Mn) and Forecast by End-Use Industry, 2015 – 2025
9.5.1.2.1. IT and telecom
9.5.1.2.2. Retail
9.5.1.2.3. BFSI
9.5.1.2.4. Healthcare
9.5.1.2.5. Energy
9.5.1.2.6. Others
9.5.2. Germany
9.5.2.1. Micro Data Center Market Size (US$ Mn) and Forecast by Rack Size, 2015 – 2025
9.5.2.1.1. Less than 25 RU
9.5.2.1.2. 25 RU – 50 RU
9.5.2.1.3. More than 50 RU
9.5.2.2. Micro Data Center Market Size (US$ Mn) and Forecast by End-Use Industry, 2015 – 2025
9.5.2.2.1. IT and telecom
9.5.2.2.2. Retail
9.5.2.2.3. BFSI
9.5.2.2.4. Healthcare
9.5.2.2.5. Energy
9.5.2.2.6. Others
9.5.3. France
9.5.3.1. Micro Data Center Market Size (US$ Mn) and Forecast by Rack Size, 2015 – 2025
9.5.3.1.1. Less than 25 RU
9.5.3.1.2. 25 RU – 50 RU
9.5.3.1.3. More than 50 RU
9.5.3.2. Micro Data Center Market Size (US$ Mn) and Forecast by End-Use Industry, 2015 – 2025
9.5.3.2.1. IT and telecom
9.5.3.2.2. Retail
9.5.3.2.3. BFSI
9.5.3.2.4. Healthcare
9.5.3.2.5. Energy
9.5.3.2.6. Others
9.5.4. Rest of Europe
9.6. Micro Data Center Market Attractiveness Analysis
9.6.1. By Rack Size
9.6.2. By End-Use Industry
9.6.3. By Country
10. Asia Pacific Micro Data Center Market Size and Forecast
10.1. Key Findings
10.2. Key Trends
10.3. Micro Data Center Market Size (US$ Mn ) and Forecast by Rack Size, 2015 – 2025
10.3.1. Less than 25 RU
10.3.2. 25 RU – 50 RU
10.3.3. More than 50 RU
10.4. Micro Data Center Market Size (US$ Mn) and Forecast by End-Use Industry, 2015 – 2025
10.4.1. IT and telecom
10.4.2. Retail
10.4.3. BFSI
10.4.4. Healthcare
10.4.5. Energy
10.4.6. Others
10.5. Micro Data Center Market Size (US$ Mn ) and Forecast by Country, 2015 – 2025
10.5.1. India
10.5.1.1. Micro Data Center Market Size (US$ Mn) and Forecast by Rack Size, 2015 – 2025
10.5.1.1.1. Less than 25 RU
10.5.1.1.2. 25 RU – 50 RU
10.5.1.1.3. More than 50 RU
10.5.1.2. Micro Data Center Market Size (US$ Mn) and Forecast by End-Use Industry, 2015 – 2025
10.5.1.2.1. IT and telecom
10.5.1.2.2. Retail
10.5.1.2.3. BFSI
10.5.1.2.4. Healthcare
10.5.1.2.5. Energy
10.5.1.2.6. Others
10.5.2. China
10.5.2.1. Micro Data Center Market Size (US$ Mn) and Forecast by Rack Size, 2015 – 2025
10.5.2.1.1. Less than 25 RU
10.5.2.1.2. 25 RU – 50 RU
10.5.2.1.3. More than 50 RU
10.5.2.2. Micro Data Center Market Size (US$ Mn) and Forecast by End-Use Industry,2015 – 2025
10.5.2.2.1. IT and telecom
10.5.2.2.2. Retail
10.5.2.2.3. BFSI
10.5.2.2.4. Healthcare
10.5.2.2.5. Energy
10.5.2.2.6. Others
10.5.3. Japan
10.5.3.1. Micro Data Center Market Size (US$ Mn) and Forecast by Rack Size, 2015 – 2025
10.5.3.1.1. Less than 25 RU
10.5.3.1.2. 25 RU – 50 RU
10.5.3.1.3. More than 50 RU
10.5.3.2. Micro Data Center Market Size (US$ Mn) and Forecast by End-Use Industry,2015 – 2025
10.5.3.2.1. IT and telecom
10.5.3.2.2. Retail
10.5.3.2.3. BFSI
10.5.3.2.4. Healthcare
10.5.3.2.5. Energy
10.5.3.2.6. Others
10.5.4. Rest of Asia Pacific
10.6. Micro Data Center Market Attractiveness Analysis
10.6.1. By Rack Size
10.6.2. By End-Use Industry
10.6.3. By Country
11. Middle East and Africa (MEA) Micro Data Center Market Size and Forecast
11.1. Key Findings
11.2. Key Trends
11.3. Micro Data Center Market Size (US$ Mn ) and Forecast by Rack Size, 2015 – 2025
11.3.1. Less than 25 RU
11.3.2. 25 RU – 50 RU
11.3.3. More than 50 RU
11.4. Micro Data Center Market Size (US$ Mn) and Forecast by End-Use Industry, 2015 – 2025
11.4.1. IT and telecom
11.4.2. Retail
11.4.3. BFSI
11.4.4. Healthcare
11.4.5. Energy
11.4.6. Others
11.5. Micro Data Center Market Size (US$ Mn ) and Forecast by Country, 2015 – 2025
11.5.1. GCC Countries
11.5.1.1. Micro Data Center Market Size (US$ Mn) and Forecast by Rack Size, 2015 – 2025
11.5.1.1.1. Less than 25 RU
11.5.1.1.2. 25 RU – 50 RU
11.5.1.1.3. More than 50 RU
11.5.1.2. Micro Data Center Market Size (US$ Mn) and Forecast by End-Use Industry, 2015 – 2025
11.5.1.2.1. IT and telecom
11.5.1.2.2. Retail
11.5.1.2.3. BFSI
11.5.1.2.4. Healthcare
11.5.1.2.5. Energy
11.5.1.2.6. Others
11.5.2. South Africa
11.5.2.1. Micro Data Center Market Size (US$ Mn) and Forecast by Rack Size, 2015 – 2025
11.5.2.1.1. Less than 25 RU
11.5.2.1.2. 25 RU – 50 RU
11.5.2.1.3. More than 50 RU
11.5.2.2. Micro Data Center Market Size (US$ Mn) and Forecast by End-Use Industry,2015 – 2025
11.5.2.2.1. IT and telecom
11.5.2.2.2. Retail
11.5.2.2.3. BFSI
11.5.2.2.4. Healthcare
11.5.2.2.5. Energy
11.5.2.2.6. Others
11.5.3. Rest of Middle East & Africa
11.6. Micro Data Center Market Attractiveness Analysis
11.6.1. By Rack Size
11.6.2. By End-Use Industry
11.6.3. By Country
12. South America Micro Data Center Market Size and Forecast
12.1. Key Findings
12.2. Key Trends
12.3. Micro Data Center Market Size (US$ Mn ) and Forecast by Rack Size, 2015 – 2025
12.3.1. Less than 25 RU
12.3.2. 25 RU – 50 RU
12.3.3. More than 50 RU
12.4. Micro Data Center Market Size (US$ Mn) and Forecast by End-Use Industry, 2015 – 2025
12.4.1. IT and telecom
12.4.2. Retail
12.4.3. BFSI
12.4.4. Healthcare
12.4.5. Energy
12.4.6. Others
12.5. Micro Data Center Market Size (US$ Mn ) and Forecast by Country, 2015 – 2025
12.5.1. Brazil
12.5.1.1. Micro Data Center Market Size (US$ Mn) and Forecast by Rack Size, 2015 – 2025
12.5.1.1.1. Less than 25 RU
12.5.1.1.2. 25 RU – 50 RU
12.5.1.1.3. More than 50 RU
12.5.1.2. Micro Data Center Market Size (US$ Mn) and Forecast by End-Use Industry,2015 – 2025
12.5.1.2.1. IT and telecom
12.5.1.2.2. Retail
12.5.1.2.3. BFSI
12.5.1.2.4. Healthcare
12.5.1.2.5. Energy
12.5.1.2.6. Others
12.5.2. Rest of South America
12.6. Micro Data Center Market Attractiveness Analysis
12.6.1. By Rack Size
12.6.2. By End-Use Industry
12.6.3. By Country
13. Competition Landscape
13.1. Market Player – Competition Matrix
13.2. Company Profiles (Details – Overview, Financials, Strategy, SWOT analysis)
13.2.1. Rittal GmbH
13.2.1.1. Company Details (HQ, Foundation Year, Employee Strength)
13.2.1.2. Market Presence, By Segment.
13.2.1.3. Strategy
13.2.1.4. SWOT Analysis
13.2.2. Schneider Electric
13.2.2.1. Company Details (HQ, Foundation Year, Employee Strength)
13.2.2.2. Market Presence, By Segment.
13.2.2.3. Strategy
13.2.2.4. Revenue and Operating Profits
13.2.2.5. SWOT Analysis
13.2.3. Huawei Technologies Co
13.2.3.1. Company Details (HQ, Foundation Year, Employee Strength)
13.2.3.2. Market Presence, By Segment.
13.2.3.3. Strategy
13.2.3.4. Revenue and Operating Profits
13.2.3.5. SWOT Analysis
13.2.4. Panduit Corp.
13.2.4.1. Company Details (HQ, Foundation Year, Employee Strength)
13.2.4.2. Market Presence, By Segment.
13.2.4.3. Strategy
13.2.4.4. SWOT Analysis
13.2.5. Eaton Corporation
13.2.5.1. Company Details (HQ, Foundation Year, Employee Strength)
13.2.5.2. Market Presence, By Segment.
13.2.5.3. Strategy
13.2.5.4. Revenue and Operating Profits
13.2.5.5. SWOT Analysis
13.2.6. Zellabox
13.2.6.1. Company Details (HQ, Foundation Year, Employee Strength)
13.2.6.2. Market Presence, By Segment.
13.2.6.3. Strategy
13.2.6.4. SWOT Analysis
13.2.7. Dataracks
13.2.7.1. Company Details (HQ, Foundation Year, Employee Strength)
13.2.7.2. Market Presence, By Segment.
13.2.7.3. Strategy
13.2.7.4. SWOT Analysis
13.2.8. Instant Data Centers
13.2.8.1. Company Details (HQ, Foundation Year, Employee Strength)
13.2.8.2. Market Presence, By Segment.
13.2.8.3. Strategy
13.2.8.4. SWOT Analysis
13.2.9. Hitachi, Ltd.
13.2.9.1. Company Details (HQ, Foundation Year, Employee Strength)
13.2.9.2. Market Presence, By Segment.
13.2.9.3. Strategy
13.2.9.4. Revenue and Operating Profits
13.2.9.5. SWOT Analysis
13.2.10. Hewlett Packard Enterprise Development LP
13.2.10.1. Company Details (HQ, Foundation Year, Employee Strength)
13.2.10.2. Market Presence, By Segment.
13.2.10.3. Strategy
13.2.10.4. Revenue and Operating Profits
13.2.10.5. SWOT Analysis
14. Key Takeaways
List of Figures
Figure 1: Share Analysis
Figure 2: Global Micro Data Center Market, Revenue 2015 – 2025 (US$)
Figure 3: Market Value Share By Deployment Type (2017)
Figure 4: Market Value Share By End-use Industry (2017)
Figure 5: Market Revenue Share By Region (2017)
Figure 6: Global Micro Data Center Market Value Share Analysis, By Rack Size, 2017 and 2025
Figure 7: Comparison Matrix
Figure 8: Global Micro Data Center Market, Attractiveness Analysis, By Rack Size (2017)
Figure 9: Global Micro Data Center market Value Share Analysis, By End-Use Industry, 2017 and 2025
Figure 10: Comparison Matrix
Figure 11: Global Micro Data Center Market, Attractiveness Analysis, By End – Use Industry
Figure 12: Global Micro Data Center Market, Attractiveness Analysis, By Region
Figure 13: North America Micro Data Center Market Revenue Share Analysis, by Rack Size, 2017 and 2025
Figure 14: North America Micro Data Center Market Revenue Share Analysis, by End-Use Industry, 2017 and 2025
Figure 15: North America Micro Data Center Revenue Share Analysis, By Country, 2017 and 2025
Figure 16: U.S. Micro Data Center Market Revenue Share Analysis, By Rack Size, 2017 and 2025
Figure 17: U.S. Micro Data Center Market Revenue Share Analysis, By End-Use Industry, 2017 and 2025
Figure 18: Canada Micro Data Center Market Revenue Share Analysis, By Rack Size, 2017 and 2025
Figure 19: Canada Micro Data Center Market Revenue Share Analysis, By End-Use Industry, 2017 and 2025
Figure 20: Rest of North America Micro Data Center Market Revenue Share Analysis, By Rack Size, 2017 and 2025
Figure 21: Rest of North America Micro Data Center Market Revenue Share Analysis, By End-Use Industry, 2017 and 2025
Figure 22: Micro Data Center Market, Attractiveness Analysis, By Deployment
Figure 23: Micro Data Center Market, Attractiveness Analysis, By End-Use Industry
Figure 24: Micro Data Center Market, Attractiveness Analysis, By Country
Figure 25: Europe Micro Data Center Market Revenue Share Analysis, by Rack Size, 2017 and 2025
Figure 26: North America Micro Data Center Market Revenue Share Analysis, by End-Use Industry, 2017 and 2025
Figure 27: North America Micro Data Center Revenue Share Analysis, By Country, 2017 and 2025
Figure 28: UK Micro Data Center Market Revenue Share Analysis, By Rack Size, 2017 and 2025
Figure 29: UK Micro Data Center Market Revenue Share Analysis, By End-Use Industry, 2017 and 2025
Figure 30: Germany Micro Data Center Market Revenue Share Analysis, By Rack Size, 2017 and 2025
Figure 31: Germany Micro Data Center Market Revenue Share Analysis, By End-Use Industry, 2017 and 2025
Figure 32: France Micro Data Center Market Revenue Share Analysis, By Rack Size, 2017 and 2025
Figure 33: France Micro Data Center Market Revenue Share Analysis, By End-Use Industry, 2017 and 2025
Figure 34: Rest of Europe Micro Data Center Market Revenue Share Analysis, By Rack Size, 2017 and 2025
Figure 35: Rest of Europe Micro Data Center Market Revenue Share Analysis, By End-Use Industry, 2017 and 2025
Figure 36: Micro Data Center Market, Attractiveness Analysis, By Deployment
Figure 37: Micro Data Center Market, Attractiveness Analysis, By End-Use Industry
Figure 38: Micro Data Center Market, Attractiveness Analysis, By Country
Figure 39: Asia Pacific Micro Data Center Market Revenue Share Analysis, by Rack Size, 2017 and 2025
Figure 40: Asia Pacific Micro Data Center Market Revenue Share Analysis, by End-Use Industry, 2017 and 2025
Figure 41: Asia Pacific Micro Data Center Revenue Share Analysis, By Country, 2017 and 2025
Figure 42: India Micro Data Center Market Revenue Share Analysis, By Rack Size, 2017 and 2025
Figure 43: India Micro Data Center Market Revenue Share Analysis, By End-Use Industry, 2017 and 2025
Figure 44: China Micro Data Center Market Revenue Share Analysis, By Rack Size, 2017 and 2025
Figure 45: China Micro Data Center Market Revenue Share Analysis, By End-Use Industry, 2017 and 2025
Figure 46: Japan Micro Data Center Market Revenue Share Analysis, By Rack Size, 2017 and 2025
Figure 47: Japan Micro Data Center Market Revenue Share Analysis, By End-Use Industry, 2017 and 2025
Figure 48: Rest of Asia Pacific Micro Data Center Market Revenue Share Analysis, By Rack Size, 2017 and 2025
Figure 49: Rest of Asia Pacific Micro Data Center Market Revenue Share Analysis, By End-Use Industry, 2017 and 2025
Figure 50: Micro Data Center Market, Attractiveness Analysis, By Deployment
Figure 51: Micro Data Center Market, Attractiveness Analysis, By End-Use Industry
Figure 52: Micro Data Center Market, Attractiveness Analysis, By Country
Figure 53: Middle East & Africa (MEA) Micro Data Center Market Revenue Share Analysis, by Rack Size, 2017 and 2025
Figure 54: Middle East & Africa (MEA) Micro Data Center Market Revenue Share Analysis, by End-Use Industry, 2017 and 2025
Figure 55: Middle East & Africa (MEA) Micro Data Center Market Revenue Share Analysis, By Country, 2017 and 2025
Figure 56: GCC Countries Micro Data Center Market Revenue Share Analysis, By Rack Size, 2017 and 2025
Figure 57: GCC Countries Micro Data Center Market Revenue Share Analysis, By End-Use Industry, 2017 and 2025
Figure 58: South Africa Micro Data Center Market Revenue Share Analysis, By Rack Size, 2017 and 2025
Figure 59: South Africa Micro Data Center Market Revenue Share Analysis, By End-Use Industry, 2017 and 2025
Figure 60: Rest of MEA Micro Data Center Market Revenue Share Analysis, By Rack Size, 2017 and 2025
Figure 61: Rest of MEA Micro Data Center Market Revenue Share Analysis, By End-Use Industry, 2017 and 2025
Figure 62: Micro Data Center Market, Attractiveness Analysis, By Deployment
Figure 63: Micro Data Center Market, Attractiveness Analysis, By End-Use Industry
Figure 64: Micro Data Center Market, Attractiveness Analysis, By Country
Figure 65: South America Micro Data Center Market Revenue Share Analysis, by Rack Size, 2017 and 2025
Figure 66: South America Micro Data Center Market Revenue Share Analysis, by End-Use Industry, 2017 and 2025
Figure 67: South America Micro Data Center Revenue Share Analysis, By Country, 2017 and 2025
Figure 68: Brazil Micro Data Center Market Revenue Share Analysis, By Rack Size, 2017 and 2025
Figure 69: Brazil Micro Data Center Market Revenue Share Analysis, By End-Use Industry, 2017 and 2025
Figure 70: Rest of South America Micro Data Center Market Revenue Share Analysis, By Rack Size, 2017 and 2025
Figure 71: Rest of South America Micro Data Center Market Revenue Share Analysis, By End-Use Industry, 2017 and 2025
Figure 72: Micro Data Center Market, Attractiveness Analysis, By Deployment
Figure 73: Micro Data Center Market, Attractiveness Analysis, By End-Use Industry
Figure 74: Micro Data Center Market, Attractiveness Analysis, By Country
Copyright © Transparency Market Research, Inc. All Rights reserved
Trust Online

Micro Data Center Market