
Reports
Reports
Managed Print Services (MPS) Market - Snapshot
Managed print services eliminates a lot of paper waste, which encourages organizations to only print necessary documents. There are growing concerns regarding paper wastage and unnecessary energy consumption. The level of environmental concern varies significantly. Due to these factors, organizations are progressively adopting managed print services as these services help organizations to meet their demands for sustainability and to reduce paper wastage. Cost savings might vary according to the printing usage in different industry sectors. Precision Document Solutions, a managed print services vendor, claimed to guarantee output cost savings of 30% through its comprehensive managed print service solutions for the healthcare sector. Law firms and government sectors, which are more document intensive as compared to other industries, are expected to achieve higher ROI (Return on investment) on the deployment of MPS solutions.
Managed print services provide efficient maintenance and reduction in downtime. Maintenance is important to ensure the smooth functioning of printers in the long run and also to reduce the downtime. Furthermore, the replacement of cartridges, ink toners, papers, etc. is a part of printer maintenance, using up additional time and increasing operational expenses. Thus, organizations can reduce the time utilized for maintenance and the costs related to it, as MPS takes care of maintenance without incurring additional expenses other than monthly service charges or a one-time maintenance charge.
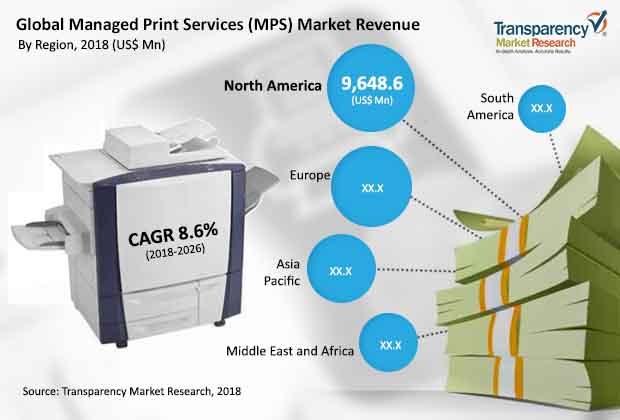
The global managed print services (MPS) market has been segmented in terms of deployment, enterprise size, channel, industry, and region. In terms of deployment, the market has been segmented into cloud, on-premise, and hybrid. The global market is divided by enterprise size into small & medium enterprises (SME’s) and large enterprise. The small and medium enterprises (SME’s) segment comprises the income generated from the sale of managed print services (MPS) to enterprise/companies with strength of 1-500 employees. Large enterprise segment reflects the revenue generated from the sale of managed print services (MPS) to enterprise/companies with a labor force of more than 500 employees. In large enterprises, adoption of managed print services (MPS) is already high as it is a cost effective process, improves security measures, and assists in compliance management. Based on channel, the global managed print services (MPS) market is categorized into printer/copier manufacturers and channel partner/core MPS providers. On the basis of industry, the market is divided into banking, financial services, and insurance (BFSI), telecom and IT, government and public, healthcare, education, legal, construction, manufacturing and others. Geographically, the market has been segmented into North America, Europe, Asia Pacific, Middle East & Africa, and South America.
The North America region is dominant in the adoption of managed print services (MPS). The high adoption of digital technology across all major verticals such as healthcare and government helps the market to expand in North America, principally in the U.S. The market is in the emerging stage in the regions of Asia Pacific (APAC), South America, and Middle East & Africa (MEA). Therefore, these regions offer immense scope for the adoption of managed print services (MPS) channels. Additionally, the growing technological developments in the field of cloud, analytics, and the emergence of mobile technologies have led to the high adoption of managed print services (MPS) channels in significant verticals such as banking, financial services, and insurance (BFSI), transportation and logistics, and construction.
This report on the global managed print services (MPS) market provides market revenue share analysis of the various vital participants. Some of the key players profiled in the report include HP Inc., Xerox Corporation, Lexmark International Inc., Fujitsu Ltd, Canon, Inc., Konica Minolta, Inc., Kyocera Corporation, Ricoh Company Ltd., Toshiba Corporation, ARC Document Channels, Inc., Seiko Epson Corporation, Wipro Limited, Honeywell Corporation, and Print Audit, Inc.
1. Preface
1.1. Market Scope
1.2. Market Segmentation
1.3. Key Research Objectives
2. Assumptions and Research Methodology
2.1. Market Taxonomy - Segment Definitions
2.2. Research Methodology
2.2.1. List of Primary and Secondary Sources
2.3. Key Assumptions for Data Modelling
3. Executive Summary : Global Managed Print Services (MPS) Market
4. Market Overview
4.1. Global Market – Macro Economic Factors Overview
4.1.1. Key Regional Socio-political-technological Developments and Their Impact Considerations
4.2. Market Definition
4.3. Market Factor Analysis
4.3.1. Porter’s Five Forces Analysis
4.3.2. PESTEL Analysis
4.3.3. Ecosystem Analysis
4.3.4. Key Market Indicators
4.3.5. 5 Phases of Managed Print Services
4.3.6. Pricing Model for Managed Print Services
4.3.7. Pricing Model Analysis (Adoption rate, %)
4.3.7.1. Subscription based
4.3.7.2. License based
4.3.7.3. Hybrid
4.3.8. Market Dynamics (Growth Influencers)
4.3.8.1. Drivers
4.3.8.2. Restraints
4.3.8.3. Opportunities
4.3.8.4. Impact Analysis of Drivers & Restraints
4.4. Key Industry Development
4.5. Global Managed Print Services (MPS) Market Analysis and Forecast, 2016 - 2026
4.5.1. Market Revenue Analysis (US$ Mn)
4.5.1.1. Historic Growth Trends, 2012-2017
4.5.1.2. Forecast Trends, 2017-2026
4.6. Market Outlook
4.7. Competitive Scenario
5. Global Managed Print Services (MPS) Market Analysis and Forecast, By Deployment
5.1. Definition
5.2. Key Segment Analysis
5.3. Managed Print Services (MPS) Market Size (US$ Mn) Forecast, By Deployment, 2016 - 2026
5.3.1. Cloud
5.3.2. On-Premise
5.3.3. Hybrid
5.4. Managed Print Services (MPS) Market Share Analysis, By Deployment
5.5. Market Attractiveness Analysis By Deployment
6. Global Managed Print Services (MPS) Market Analysis and Forecast, By Channel
6.1. Definition
6.2. Key Segment Analysis
6.3. Managed Print Services (MPS) Market Size (US$ Mn) Forecast, By Channel, 2016 - 2026
6.3.1. Printer/Copier Manufacturers
6.3.2. Channel Partner/Core MPS Providers
6.4. Managed Print Services (MPS) Market Share Analysis, By Channel
6.5. Market Attractiveness By Channel
7. Global Managed Print Services (MPS) Market Analysis and Forecast, By Enterprise Size
7.1. Definition
7.2. Key Segment Analysis
7.3. Managed Print Services (MPS) Market Size (US$ Mn) Forecast, By Enterprise Size, 2016 - 2026
7.3.1. Small & Medium Enterprises (SME’s)
7.3.2. Large Enterprises
7.4. Managed Print Services (MPS) Market Share Analysis, By Enterprise Size
7.5. Market Attractiveness By Enterprise Size
8. Global Managed Print Services (MPS) Market Analysis and Forecast, By Industry
8.1. Definition
8.2. Key Segment Analysis
8.3. Managed Print Services (MPS) Market Size (US$ Mn) Forecast, By Industry, 2016 - 2026
8.3.1. BFSI (Banking, Financial, Services and Insurance)
8.3.2. Telecom and IT
8.3.3. Government and Public
8.3.4. Healthcare
8.3.5. Education
8.3.6. Legal
8.3.7. Construction
8.3.8. Manufacturing
8.3.9. Others
8.4. Managed Print Services (MPS) Market Share Analysis, By Industry
8.5. Market Attractiveness By Industry
9. Global Managed Print Services (MPS) Market Analysis and Forecast, by Region
9.1. Regional Key Findings
9.2. Key Segment Analysis
9.3. Managed Print Services (MPS) Market Size (US$ Mn) Forecast, by Region, 2016 - 2026
9.3.1. North America
9.3.2. Europe
9.3.3. Asia Pacific
9.3.4. Middle East & Africa
9.3.5. South America
9.4. Managed Print Services Market Share Analysis, By Region
9.5. Market Attractiveness by Region
10. North America Managed Print Services (MPS) Market Analysis and Forecast
10.1. Key Findings
10.2. Impact Analysis
10.3. Managed Print Services (MPS) Market Size (US$ Mn) Forecast, By Deployment, 2016 - 2026
10.3.1. Cloud
10.3.2. On-Premise
10.3.3. Hybrid
10.4. Managed Print Services (MPS) Market Size (US$ Mn) Forecast, By Channel, 2016 - 2026
10.4.1. Printer/Copier
10.4.2. Manufacturers
10.4.3. Channel Partner/Core MPS Providers
10.5. Managed Print Services (MPS) Market Size (US$ Mn) Forecast, By Enterprise Size, 2016 - 2026
10.5.1. Small & Medium Enterprises (SME’s)
10.5.2. Large Enterprises
10.6. Managed Print Services (MPS) Market Size (US$ Mn) Forecast, By Industry, 2016 - 2026
10.6.1. BFSI (Banking, Financial, Services and Insurance)
10.6.2. Telecom and IT
10.6.3. Government and Public
10.6.4. Healthcare
10.6.5. Education
10.6.6. Legal
10.6.7. Construction
10.6.8. Manufacturing
10.6.9. Others
10.7. Managed Print Services (MPS) Market Size (US$ Mn) Forecast, By Country, 2016 - 2026
10.7.1. The U.S.
10.7.2. Canada
10.7.3. Rest of North America
10.8. Market Attractiveness Analysis
10.8.1. By Deployment
10.8.2. By Channel
10.8.3. By Enterprise Size
10.8.4. By Industry
10.8.5. By Country
11. Europe Managed Print Services (MPS) Market Analysis and Forecast
11.1. Key Findings
11.2. Impact Analysis
11.3. Managed Print Services (MPS) Market Size (US$ Mn) Forecast, By Deployment, 2016 - 2026
11.3.1. Cloud
11.3.2. On-Premise
11.3.3. Hybrid
11.4. Managed Print Services (MPS) Market Size (US$ Mn) Forecast, By Channel, 2016 - 2026
11.4.1. Printer/Copier
11.4.2. Manufacturers
11.4.3. Channel Partner/Core MPS Providers
11.5. Managed Print Services (MPS) Market Size (US$ Mn) Forecast, By Enterprise Size, 2016 - 2026
11.5.1. Small & Medium Enterprises (SME’s)
11.5.2. Large Enterprises
11.6. Managed Print Services (MPS) Market Size (US$ Mn) Forecast, By Industry, 2016 - 2026
11.6.1. BFSI (Banking, Financial, Services and Insurance)
11.6.2. Telecom and IT
11.6.3. Government and Public
11.6.4. Healthcare
11.6.5. Education
11.6.6. Legal
11.6.7. Construction
11.6.8. Manufacturing
11.6.9. Others
11.7. Managed Print Services (MPS) Market Size (US$ Mn) Forecast, By Country, 2016 - 2026
11.7.1. Germany
11.7.2. France
11.7.3. UK
11.7.4. Italy
11.7.5. Russia
11.7.6. Rest of Europe
11.8. Market Attractiveness Analysis
11.8.1. By Deployment
11.8.2. By Channel
11.8.3. By Enterprise Size
11.8.4. By Industry
11.8.5. By Country
12. Asia Pacific Managed Print Services (MPS) Market Analysis and Forecast
12.1. Key Findings
12.2. Impact Analysis
12.3. Managed Print Services (MPS) Market Size (US$ Mn) Forecast, By Deployment, 2016 - 2026
12.3.1. Cloud
12.3.2. On-Premise
12.3.3. Hybrid
12.4. Managed Print Services (MPS) Market Size (US$ Mn) Forecast, By Channel, 2016 - 2026
12.4.1. Printer/Copier
12.4.2. Manufacturers
12.4.3. Channel Partner/Core MPS Providers
12.5. Managed Print Services (MPS) Market Size (US$ Mn) Forecast, By Enterprise Size, 2016 - 2026
12.5.1. Small & Medium Enterprises (SME’s)
12.5.2. Large Enterprises
12.6. Managed Print Services (MPS) Market Size (US$ Mn) Forecast, By Industry, 2016 - 2026
12.6.1. BFSI (Banking, Financial, Services and Insurance)
12.6.2. Telecom and IT
12.6.3. Government and Public
12.6.4. Healthcare
12.6.5. Education
12.6.6. Legal
12.6.7. Construction
12.6.8. Manufacturing
12.6.9. Others
12.7. Managed Print Services (MPS) Market Size (US$ Mn) Forecast, By Country, 2016 - 2026
12.7.1. China
12.7.2. Japan
12.7.3. India
12.7.4. Australia
12.7.5. Rest of Asia Pacific
12.8. Market Attractiveness Analysis
12.8.1. By Deployment
12.8.2. By Channel
12.8.3. By Enterprise Size
12.8.4. By Industry
12.8.5. By Country
13. Middle East & Africa (MEA) Managed Print Services (MPS) Market Analysis and Forecast
13.1. Key Findings
13.2. Impact Analysis
13.3. Managed Print Services (MPS) Market Size (US$ Mn) Forecast, By Deployment, 2016 - 2026
13.3.1. Cloud
13.3.2. On-Premise
13.3.3. Hybrid
13.4. Managed Print Services (MPS) Market Size (US$ Mn) Forecast, By Channel, 2016 - 2026
13.4.1. Printer/Copier
13.4.2. Manufacturers
13.4.3. Channel Partner/Core MPS Providers
13.5. Managed Print Services (MPS) Market Size (US$ Mn) Forecast, By Enterprise Size, 2016 - 2026
13.5.1. Small & Medium Enterprises (SME’s)
13.5.2. Large Enterprises
13.6. Managed Print Services (MPS) Market Size (US$ Mn) Forecast, By Industry, 2016 - 2026
13.6.1. BFSI (Banking, Financial, Services and Insurance)
13.6.2. Telecom and IT
13.6.3. Government and Public
13.6.4. Healthcare
13.6.5. Education
13.6.6. Legal
13.6.7. Construction
13.6.8. Manufacturing
13.6.9. Others
13.7. Managed Print Services (MPS) Market Size (US$ Mn) Forecast, By Country, 2016 - 2026
13.7.1. GCC
13.7.2. South Africa
13.7.3. Rest of MEA
13.8. Market Attractiveness Analysis
13.8.1. By Deployment
13.8.2. By Channel
13.8.3. By Enterprise Size
13.8.4. By Industry
13.8.5. By Country
14. South America Managed Print Services (MPS) Market Analysis and Forecast
14.1. Key Findings
14.2. Impact Analysis
14.3. Managed Print Services (MPS) Market Size (US$ Mn) Forecast, By Deployment, 2016 - 2026
14.3.1. Cloud
14.3.2. On-Premise
14.3.3. Hybrid
14.4. Managed Print Services (MPS) Market Size (US$ Mn) Forecast, By Channel, 2016 - 2026
14.4.1. Printer/Copier
14.4.2. Manufacturers
14.4.3. Channel Partner/Core MPS Providers
14.5. Managed Print Services (MPS) Market Size (US$ Mn) Forecast, By Enterprise Size, 2016 - 2026
14.5.1. Small & Medium Enterprises (SME’s)
14.5.2. Large Enterprises
14.6. Managed Print Services (MPS) Market Size (US$ Mn) Forecast, By Industry, 2016 - 2026
14.6.1. BFSI (Banking, Financial, Services and Insurance)
14.6.2. Telecom and IT
14.6.3. Government and Public
14.6.4. Healthcare
14.6.5. Education
14.6.6. Legal
14.6.7. Construction
14.6.8. Manufacturing
14.6.9. Others
14.7. Managed Print Services (MPS) Market Size (US$ Mn) Forecast, By Country, 2016 - 2026
14.7.1. Brazil
14.7.2. Argentina
14.7.3. Rest of South America
14.8. Market Attractiveness Analysis
14.8.1. By Deployment
14.8.2. By Channel
14.8.3. By Enterprise Size
14.8.4. By Industry
14.8.5. By Country
15. Competition Landscape
15.1. Global Managed Print Services Tier Structure
15.2. Market Revenue Share Analysis (%), By Company (2017)
16. Company Profiles
16.1.1. Xerox Corporation
16.1.1.1. Overview
16.1.1.2. Business Segment
16.1.1.3. Strategic Overview
16.1.1.4. SWOT Analysis
16.1.1.5. Financial Overview
16.1.2. Canon, Inc.
16.1.2.1. Overview
16.1.2.2. Business Segment
16.1.2.3. Strategic Overview
16.1.2.4. SWOT Analysis
16.1.2.5. Financial Overview
16.1.3. Hewlett Packard Enterprise Development L.P.
16.1.3.1. Overview
16.1.3.2. Business Segment
16.1.3.3. Strategic Overview
16.1.3.4. SWOT Analysis
16.1.3.5. Financial Overview
16.1.4. Ricoh Company Ltd.
16.1.4.1. Overview
16.1.4.2. Business Segment
16.1.4.3. Strategic Overview
16.1.4.4. SWOT Analysis
16.1.4.5. Financial Overview
16.1.5. Lexmark International, Inc.
16.1.5.1. Overview
16.1.5.2. Business Segment
16.1.5.3. Strategic Overview
16.1.5.4. SWOT Analysis
16.1.5.5. Financial Overview
16.1.6. Konica Minolta, Inc.
16.1.6.1. Overview
16.1.6.2. Business Segment
16.1.6.3. Strategic Overview
16.1.6.4. SWOT Analysis
16.1.6.5. Financial Overview
16.1.7. Kyocera Corporation
16.1.7.1. Overview
16.1.7.2. Business Segment
16.1.7.3. Strategic Overview
16.1.7.4. SWOT Analysis
16.1.7.5. Financial Overview
16.1.8. Seiko Epson Corporation
16.1.8.1. Overview
16.1.8.2. Business Segment
16.1.8.3. Strategic Overview
16.1.8.4. SWOT Analysis
16.1.8.5. Financial Overview
16.1.9. Toshiba Corporation
16.1.9.1. Overview
16.1.9.2. Business Segment
16.1.9.3. Strategic Overview
16.1.9.4. SWOT Analysis
16.1.9.5. Financial Overview
16.1.10. Sharp Corporation
16.1.10.1. Overview
16.1.10.2. Business Segment
16.1.10.3. Strategic Overview
16.1.10.4. SWOT Analysis
16.1.10.5. Financial Overview
16.1.11. Fujitsu Ltd
16.1.11.1. Overview
16.1.11.2. Business Segment
16.1.11.3. Strategic Overview
16.1.11.4. SWOT Analysis
16.1.11.5. Financial Overview
16.1.12. HCL Technologies Ltd. Overview
16.1.12.1. Business Segment
16.1.12.2. Strategic Overview
16.1.12.3. SWOT Analysis
16.1.12.4. Financial Overview
16.1.13. Wipro Limited
16.1.13.1. Overview
16.1.13.2. Business Segment
16.1.13.3. Strategic Overview
16.1.13.4. SWOT Analysis
16.1.13.5. Financial Overview
16.1.14. ARC Document Solutions, Inc.
16.1.14.1. Overview
16.1.14.2. Business Segment
16.1.14.3. Strategic Overview
16.1.14.4. SWOT Analysis
16.1.14.5. Financial Overview
16.1.15. Print Audit, Inc.
16.1.15.1. Overview
16.1.15.2. Business Segment
16.1.15.3. Strategic Overview
16.1.15.4. SWOT Analysis
16.1.15.5. Financial Overview
17. Key Takeaways
List of Tables
Table 1: Global Managed Print Services (MPS) Market Revenue (US$ Mn) Forecast, by Deployment, 2016 - 2026
Table 2: Global Managed Print Services (MPS) Market Revenue (US$ Mn) Forecast, by Channel, 2016 - 2026
Table 3: Global Managed Print Services (MPS) Market Revenue (US$ Mn) Forecast, by Enterprise Size, 2016 - 2026
Table 4: Global Managed Print Services (MPS) Market Revenue (US$ Mn) Forecast, by Industry, 2016 - 2026
Table 5: Global Managed Print Services Market Revenue (US$ Mn) Forecast, by Region, 2016 - 2026
Table 6: North America Managed Print Services Market Revenue (US$ Mn) Forecast, by Deployment, 2016 - 2026
Table 7: North America Managed Print Services Market Revenue (US$ Mn) Forecast, by Channel, 2016 - 2026
Table 8: North America Managed Print Services Market Revenue (US$ Mn) Forecast, by Enterprise Size, 2016 - 2026
Table 9: North America Managed Print Services Market Revenue (US$ Mn) Forecast, by Industry, 2016 - 2026
Table 10: North America Managed Print Services Market Revenue (US$ Mn) Forecast, by Country, 2016 - 2026
Table 11: Europe Managed Print Services Market Revenue (US$ Mn) Forecast, by Deployment, 2016 - 2026
Table 12: Europe Managed Print Services Market Revenue (US$ Mn) Forecast, by Channel, 2016 - 2026
Table 13: Europe Managed Print Services Market Revenue (US$ Mn) Forecast, by Enterprise Size, 2016 - 2026
Table 14: Europe Managed Print Services Market Revenue (US$ Mn) Forecast, by Industry, 2016 - 2026
Table 15: Europe Managed Print Services Market Revenue (US$ Mn) Forecast, by Country, 2016 - 2026
Table 16: Asia Pacific Managed Print Services Market Revenue (US$ Mn) Forecast, by Deployment, 2016 - 2026
Table 17: Asia Pacific Managed Print Services Market Revenue (US$ Mn) Forecast, by Channel, 2016 - 2026
Table 18: Asia Pacific Managed Print Services Market Revenue (US$ Mn) Forecast, by Enterprise Size, 2016 - 2026
Table 19: Asia Pacific Managed Print Services Market Revenue (US$ Mn) Forecast, by Industry, 2016 - 2026
Table 20: Asia Pacific Managed Print Services Market Revenue (US$ Mn) Forecast, by Country, 2016 - 2026
Table 21: MEA Managed Print Services Market Revenue (US$ Mn) Forecast, by Deployment, 2016 - 2026
Table 22: MEA Managed Print Services Market Revenue (US$ Mn) Forecast, by Channel, 2016 - 2026
Table 23: MEA Managed Print Services Market Revenue (US$ Mn) Forecast, by Enterprise Size, 2016 - 2026
Table 24: MEA Managed Print Services Market Revenue (US$ Mn) Forecast, by Industry, 2016 - 2026
Table 25: MEA Managed Print Services Market Revenue (US$ Mn) Forecast, by Country, 2016 - 2026
Table 26: South America Managed Print Services Market Revenue (US$ Mn) Forecast, by Deployment, 2016 - 2026
Table 27: South America Managed Print Services Market Revenue (US$ Mn) Forecast, by Channel, 2016 - 2026
Table 28: South America Managed Print Services Market Revenue (US$ Mn) Forecast, by Enterprise Size, 2016 - 2026
Table 29: South America Managed Print Services Market Revenue (US$ Mn) Forecast, by Industry, 2016 - 2026
Table 30: South America Managed Print Services Market Revenue (US$ Mn) Forecast, by Country, 2016 - 2026
List of Figures
Figure 1: Global Managed Print Services (MPS) Market Analysis by Key players
Figure 2: Global Managed Print Services (MPS) Market CAGR by Deployment (2018 – 2026)
Figure 3: Global Managed Print Services (MPS) Market CAGR by Channel (2018 – 2026)
Figure 4: Global Managed Print Services (MPS) Market CAGR by Enterprise Size (2018 – 2026)
Figure 5: Global Managed Print Services (MPS) Market CAGR by Region, (2018 – 2026)
Figure 6: Global Managed Print Services (MPS) Market CAGR by Industry, (2018 – 2026)
Figure 7: Global Managed Print Services (MPS) Market Size (US$ Mn) Forecast, 2016 – 2026
Figure 8: Global Managed Print Services (MPS) Market Y-o-Y Growth (Value %) Forecast, 2017 – 2026
Figure 9: Global Managed Print Services (MPS) Market Opportunity Growth Analysis (US$ Mn), 2016 – 2026
Figure 10: Global Managed Print Services (MPS) Market Share Analysis, by Deployment (2018)
Figure 11: Global Managed Print Services (MPS) Market Share Analysis, by Deployment (2026)
Figure 11: Managed Print Services (MPS) Market Attractiveness Analysis, by Deployment
Figure 12: Global Managed Print Services (MPS) Market Value Share, by Channel (2018)
Figure 13: Global Managed Print Services (MPS) Market Value Share, by Channel (2026)
Figure 14: Managed Print Services (MPS) Market Attractiveness Analysis, by Channel
Figure 15: Global Managed Print Services (MPS) Market Share Analysis, by Enterprise Size (2018)
Figure 16: Global Managed Print Services (MPS) Market Share Analysis, by Enterprise Size (2026)
Figure 17: Global Managed Print Services (MPS) Market Revenue (US$ Mn) Forecast, by Enterprise Size, 2016 - 2026
Figure 18: Global Managed Print Services (MPS) Market Share Analysis, by Industry (2018)
Figure 19: Global Managed Print Services (MPS) Market Share Analysis, by Industry (2026)
Figure 20: Managed Print Services (MPS) Market Attractiveness Analysis, by Industry
Figure 21: Global Managed Print Services Market Share Analysis, by Region, 2018 and 2026
Figure 22: Managed Print Services (MPS) Market Attractiveness Analysis, by Region
Figure 23: North America Managed Print Services Market Value Share, by Deployment (2018)
Figure 24: North America Managed Print Services Market Value Share, by Deployment (2026)
Figure 25: North America Managed Print Services Market Value Share, by Channel (2018)
Figure 26: North America Managed Print Services Market Value Share, by Channel (2026)
Figure 27: North America Managed Print Services Market Value Share, by Enterprise Size (2018)
Figure 28: North America Managed Print Services Market Value Share, by Enterprise Size (2026)
Figure 29: North America Managed Print Services Market Value Share, by Industry (2018)
Figure 30: North America Managed Print Services Market Value Share, by Industry (2026)
Figure 31: North America Managed Print Services Market Value Share, by Country (2018)
Figure 32: North America Managed Print Services Market Value Share, by Country (2026)
Figure 34: North Managed Print Services Market Attractiveness Analysis, by Enterprise Size
Figure 33: North Managed Print Services Market Attractiveness Analysis, by Deployment
Figure 35: North Managed Print Services Market Attractiveness Analysis, by Channel
Figure 36: North Managed Print Services Market Attractiveness Analysis, by Industry
Figure 37: North Managed Print Services Market Attractiveness Analysis, by Country
Figure 38: Europe Managed Print Services Market Value Share, by Deployment (2018)
Figure 39: Europe Managed Print Services Market Value Share, by Deployment (2026)
Figure 40: Europe Managed Print Services Market Value Share, by Channel (2018)
Figure 41: Europe Managed Print Services Market Value Share, by Channel (2026)
Figure 42: Europe Managed Print Services Market Value Share, by Enterprise Size (2018)
Figure 43: Europe Managed Print Services Market Value Share, by Enterprise Size (2026)
Figure 44: Europe Managed Print Services Market Value Share, by Industry (2018)
Figure 45: Europe Managed Print Services Market Value Share, by Industry (2026)
Figure 46: Europe Managed Print Services Market Value Share, by Country (2018)
Figure 47: Europe Managed Print Services Market Value Share, by Country (2026)
Figure 49: Europe Managed Print Services Market Attractiveness Analysis, by Enterprise Size
Figure 48: Europe Print Services Market Attractiveness Analysis, by Deployment
Figure 50: Europe Managed Print Services Market Attractiveness Analysis, by Channel
Figure 51: Europe Managed Print Services Market Attractiveness Analysis, by Industry
Figure 52: Europe Managed Print Services Market Attractiveness Analysis, by Country
Figure 53: Asia Pacific Managed Print Services Market Value Share, by Deployment (2018)
Figure 54: Asia Pacific Managed Print Services Market Value Share, by Deployment (2026)
Figure 55: Asia Pacific Managed Print Services Market Value Share, by Channel (2018)
Figure 56: Asia Pacific Managed Print Services Market Value Share, by Channel (2026)
Figure 57: Asia Pacific Managed Print Services Market Value Share, by Enterprise Size (2018)
Figure 58: Asia Pacific Managed Print Services Market Value Share, by Enterprise Size (2026)
Figure 59: Asia Pacific Managed Print Services Market Value Share, by Industry (2018)
Figure 60: Asia Pacific Managed Print Services Market Value Share, by Industry (2026)
Figure 61: Asia Pacific Managed Print Services Market Value Share, by Country (2018)
Figure 62: Asia Pacific Managed Print Services Market Value Share, by Country (2026)
Figure 64: Asia Pacific Managed Print Services Market Attractiveness Analysis, by Enterprise Size
Figure 63: Asia Pacific Print Services Market Attractiveness Analysis, by Deployment
Figure 65: Asia Pacific Managed Print Services Market Attractiveness Analysis, by Channel
Figure 66: Asia Pacific Managed Print Services Market Attractiveness Analysis, by Industry
Figure 67: Asia Pacific Managed Print Services Market Attractiveness Analysis, by Country
Figure 68: MEA Managed Print Services Market Value Share, by Deployment (2018)
Figure 69: MEA Managed Print Services Market Value Share, by Deployment (2026)
Figure 70: MEA Managed Print Services Market Value Share, by Channel (2018)
Figure 71: MEA Managed Print Services Market Value Share, by Channel (2026)
Figure 72: MEA Managed Print Services Market Value Share, by Enterprise Size (2018)
Figure 73: MEA Managed Print Services Market Value Share, by Enterprise Size (2026)
Figure 74: MEA Managed Print Services Market Value Share, by Industry (2018)
Figure 75: MEA Managed Print Services Market Value Share, by Industry (2026)
Figure 76: MEA Managed Print Services Market Value Share, by Country (2018)
Figure 77: MEA Managed Print Services Market Value Share, by Country (2026)
Figure 79: MEA Managed Print Services Market Attractiveness Analysis, by Enterprise Size
Figure 78: MEA Print Services Market Attractiveness Analysis, by Deployment
Figure 80: MEA Managed Print Services Market Attractiveness Analysis, by Channel
Figure 81: MEA Managed Print Services Market Attractiveness Analysis, by Industry
Figure 82: MEA Managed Print Services Market Attractiveness Analysis, by Country
Figure 93: South America Managed Print Services Market Value Share, by Deployment (2018)
Figure 94: South America Managed Print Services Market Value Share, by Deployment (2026)
Figure 95: South America Managed Print Services Market Value Share, by Channel (2018)
Figure 96: South America Managed Print Services Market Value Share, by Channel (2026)
Figure 97: South America Managed Print Services Market Value Share, by Enterprise Size (2018)
Figure 98: South America Managed Print Services Market Value Share, by Enterprise Size (2026)
Figure 99: South America Managed Print Services Market Value Share, by Industry (2018)
Figure 100: South America Managed Print Services Market Value Share, by Industry (2026)
Figure 101: South America Managed Print Services Market Value Share, by Country (2018)
Figure 102: South America Managed Print Services Market Value Share, by Country (2026)
Figure 104: South America Managed Print Services Market Attractiveness Analysis, by Enterprise Size
Figure 103: South America Print Services Market Attractiveness Analysis, by Deployment
Figure 105: South America Managed Print Services Market Attractiveness Analysis, by Channel
Figure 106: South America Managed Print Services Market Attractiveness Analysis, by Industry
Figure 107: South America Managed Print Services Market Attractiveness Analysis, by Country
Figure 108: Managed Print Services Market Share Analysis by key players
Copyright © Transparency Market Research, Inc. All Rights reserved
Trust Online

Managed Print Services (MPS) Market (Forecast 2018 - 2026)