
Reports
Reports
Global Law Enforcement and Firefighting Protective Clothing Fabrics Market – An Overview
Firefighting protective clothing is witnessing and increase in demand and this is noticed in almost all economies, developed or developing, across the globe. This need is particularly fuelled by global warming intensifying. It is particularly significant to note here that the harmful impacts of climate change are being noted world over much before the earlier scientific estimations. The heating up of the environment is thus causing major fires to break out every now and then.
Over the last two years, major countries have seen raging fires due to this reason. These include the burning of Amazon forest in Brazil, California fires, and the Australian Bushfires. Thus, even governments are now gearing up for proper response to the dry climate repercussions. However, as urbanization and industrialization grows at a dizzying pace, climate is set to increase further, compounding the situation further.
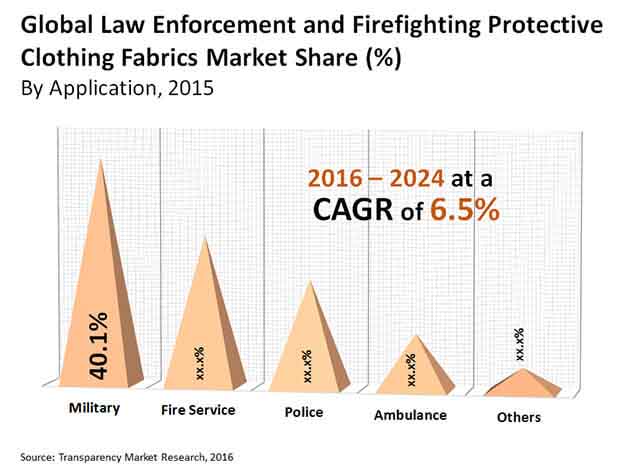
As per Transparency Market Research, law enforcement and firefighting protective clothing fabrics market is growing steadily, thanks to a robust compound annual growth rate (CAGR) of 6.5% over the period of 2016 to 2024. Over the same period, the law enforcement and firefighting protective clothing fabrics market would witness an improvement in its valuation, creating a plethora of attractive and profitable opportunities for growth, which market players in the landscape would clamor to make the most of. Market would climb up from a mere USD 954.6 million in 2015 to USD 1.67 billion by the end of the stated forecast period.
The global law enforcement and firefighting protective clothing fabrics market is quite fragmented and competitive. The large number of players operating the global law enforcement and firefighting protective clothing fabrics market is quite proactive and their strategic moves to gain a larger share of the market growth are leading the global law enforcement and firefighting protective clothing fabrics market on to a high growth trajectory. It is worth noting here though that a certain degree of consolidation is a part of the landscape because about 35% of the market share is accounted for by Milliken & Company, TenCate, National Safety Apparel, and W.L. Gore and Associates
Some of the other top players that have made a mark on the global law enforcement and firefighting protective clothing fabrics market landscape are Teijin Aramid B.V., Milliken & Company & Glen Raven, Inc., Koninklijke Ten Cate NY, Solvay S.A., Gunei Chemical Industry Co., Ltd., and PBI Performance Products Inc. among others.
Military Segment to Drive Significant Demand in the Global Law Enforcement and Firefighting Protective Clothing Fabrics Market over the Forecast Period
The Global Law Enforcement and Firefighting Protective Clothing Fabrics Market report covers share of different applications in the market, along with the trends and drivers that are taking them up on a higher trajectory. The sub-segments that fall under the applications category include police, fire service, ambulance or EMT, and military. The fire services sub-segment includes turnout gear, Wildlands gear, and station wear. Of these, the segment that would account for a prominent share in the market includes military. It will hold a 40.1% share in the Global Law Enforcement and Firefighting Protective Clothing Fabrics Market over the forecast period.
One of the most significant reasons behind growth in the segment is growing terrorism activity. As range and attacks on a number of countries grow, demand for protective gear increases in tandem. This is also the factor that is leading to growth in new opportunities in the Asia Pacific region over the forecast period. Of late, countries such as the United Kingdom, Belgium, Germany, and France have also felt the brunt of these activities, leading to a pressing need for advanced gear for manpower involved in managing these situations. To tap into this segment players are trying to produce advanced and comfortable gear for personnel over the forecast period. Besides, it does not really come as a surprise that the governments are also directing efforts towards this end.
North America and Europe to Account for a Prominent Share in the Global Law Enforcement and Firefighting Protective Clothing Fabrics Market over the Forecast Period
The Global Law Enforcement and Firefighting Protective Clothing Fabrics Market report, as prepared by Transparency Market Research, covers all key regions with potential and some significance. These include North America, Europe, Asia Pacific (APAC), Latin America, and Middle East and Africa. It further states that over the forecast period mentioned above North America and Europe will lead the regional markets for multiple reasons. One of the most prominent reasons that help the regions lay claim to a large share of the market is presence of high quality standards. Besides, high level of competition due to presence of prominent players is leading to pressure for development and delivery of superior products.
Besides, it is pertinent to note here that while countries such as the United States of America are facing an increased number of fires caused by a heated environment, countries such as France are at the receiving end of terrorist activities. These are playing a significant role in propelling growth in the Global Law Enforcement and Firefighting Protective Clothing Fabrics Market. Besides, France is a hotspot of tourism and therefore requires superior safety measures. The European countries in general are taking quite proactive measure in terms of policing and restoring tourism. This again is a massive contributor to growth in the regional market over the forecast period.
1. Preface
1.1. Report Description
1.2. Research Scope
2. Assumptions and Research Methodology
2.1. Assumptions
2.2. Market Segmentation
2.3. Research Methodology
3. Executive Summary
3.1. Global Law Enforcement and Firefighting Protective Clothing Fabrics Market, 2015 - 2024, (US$ Mn)
3.2. Law Enforcement and Firefighting Protective Clothing Fabrics Market: Market Snapshot
4. Law Enforcement and Firefighting Protective Clothing Fabrics Market– Market Overview
4.1. Introduction
4.2. Value Chain Analysis
4.3. Market Drivers
4.3.1. Rising Demand for Protective Clothing in Military Applications is Projected to Boost Law Enforcement and Firefighting Protective Clothing Fabrics Market
4.3.2. Constant Innovation in Protective Clothing Fabrics Expected to Drive Law Enforcement and Firefighting Protective Clothing Fabrics Market
4.3.3. Stringent Government Regulations and Test Methods
4.4. Restraints
4.4.1. High Cost of Flame-resistant Fabrics Anticipated to Act as Restraint for Law Enforcement and Firefighting Protective Clothing Fabrics Market
4.5. Lack of Implementation of Governmental Norms in Developing Countries
4.6. Opportunity
4.6.1. Expansion of the law enforcement and firefighting protective clothing fabrics industry in emerging economies Likely to Act as Opportunity for the Law Enforcement and Firefighting Protective Clothing Fabrics Market
4.7. Use of smart textiles in protective clothing
4.8. Value Chain Analysis
4.9. Porter’s Five Forces Analysis
4.9.1. Bargaining Power of Suppliers
4.9.2. Bargaining Power of Buyers
4.9.3. Threat of Substitutes
4.9.4. Threat of New Entrants
4.9.5. Degree of Competition
5. Law Enforcement and Firefighting Protective Clothing Fabrics Market – Application Analysis
5.1. Law Enforcement and Firefighting Protective Clothing Fabrics Market: Application Overview
5.2. Global Law Enforcement and Firefighting Protective Clothing Fabrics Market for Police, Revenue,(US$ Mn), 2015–2024
5.3. Global Law Enforcement and Firefighting Protective Clothing Fabrics Market for Fire Service, Revenue, (US$ Mn), 2015–2024
5.4. Global Law Enforcement and Firefighting Protective Clothing Fabrics Market for Ambulance/EMT, Revenue, (US$ Mn), 2015–2024
5.5. Global Law Enforcement and Firefighting Protective Clothing Fabrics Market for Military, Revenue, (US$ Mn), 2015–2024
5.6. Global Law Enforcement and Firefighting Protective Clothing Fabrics Market for Others, Revenue, (US$ Mn), 2015–2024
6. Law Enforcement and Firefighting Protective Clothing Fabrics Market - Regional Analysis
6.1. Global Law Enforcement and Firefighting Protective Clothing Fabrics Market: Regional Overview
6.2. Law Enforcement and Firefighting Protective Clothing Fabrics Market Prices, by Region, US$/square Meter, 2015–2024
7. North America
7.1. North America Law Enforcement and Firefighting Protective Clothing Fabrics Market Value Share Analysis, by Application, 2015 and 2024
7.2. North America Law Enforcement & Firefighting Services Market Size (US$ Mn) Forecast, by Application, 2015–2024
7.3. North America Fire Service Market Size (US$ Mn) Forecast, by Application, 2015–2024
7.4. North America Law Enforcement and Firefighting Protective Clothing Fabrics Market Attractiveness Analysis, by Application, 2015
7.5. North America Law Enforcement and Firefighting Services Protective Clothing Fabrics Market (US$ Mn) Forecast, by Country, 2015–2024
7.6. North America Law Enforcement and Firefighting Services Protective Clothing Fabrics Market Value Share Analysis, by Country, 2015 and 2024
7.7. North America Law Enforcement and Firefighting Services Protective Clothing Fabrics Market Attractiveness Analysis, by Country, 2015
8. Europe
8.1. Europe Law Enforcement and Firefighting Protective Clothing Fabrics Market Value Share Analysis, by Application, 2015 and 2024
8.2. Europe Law Enforcement & Firefighting Services Market Size (US$ Mn) Forecast, by Application, 2015–2024
8.3. Europe Fire Service Market Size (US$ Mn) Forecast, by Application, 2015–2024
8.4. Europe Law Enforcement and Firefighting Protective Clothing Fabrics Market Attractiveness Analysis, by Application, 2015
8.5. Europe Law Enforcement and Firefighting Services Protective Clothing Fabrics Market (US$ Mn) Forecast, by Country, 2015–2024
8.6. Europe Law Enforcement and Firefighting Services Protective Clothing Fabrics Market Value Share Analysis, by Country, 2015 and 2024
8.7. Europe Law Enforcement and Firefighting Services Protective Clothing Fabrics Market Attractiveness Analysis, by Country, 2015
9. Asia Pacific
9.1. Asia Pacific Law Enforcement and Firefighting Protective Clothing Fabrics Market Value Share Analysis, by Application, 2015 and 2024
9.2. Asia Pacific Law Enforcement & Firefighting Services Market Size (US$ Mn) Forecast, by Application, 2015–2024
9.3. Asia Pacific Fire Service Market Size (US$ Mn) Forecast, by Application, 2015–2024
9.4. Asia Pacific Law Enforcement and Firefighting Protective Clothing Fabrics Market Attractiveness Analysis, by Application, 2015
9.5. Asia Pacific Law Enforcement and Firefighting Services Protective Clothing Fabrics Market (US$ Mn) Forecast, by Country, 2015–2024
9.6. Asia Pacific Law Enforcement and Firefighting Services Protective Clothing Fabrics Market Value Share Analysis, by Country, 2015 and 2024
9.7. Asia Pacific Law Enforcement and Firefighting Services Protective Clothing Fabrics Market Attractiveness Analysis, by Country, 2015
10. Latin America
10.1. Latin America Law Enforcement and Firefighting Protective Clothing Fabrics Market Value Share Analysis, by Application, 2015 and 2024
10.2. Latin America Law Enforcement & Firefighting Services Market Size (US$ Mn) Forecast, by Application, 2015–2024
10.3. Latin America Fire Service Market Size (US$ Mn) Forecast, by Application, 2015–2024
10.4. Latin America Law Enforcement and Firefighting Protective Clothing Fabrics Market Attractiveness Analysis, by Application, 2015
10.5. Latin America Law Enforcement and Firefighting Services Protective Clothing Fabrics Market (US$ Mn) Forecast, by Country, 2015–2024
10.6. Latin America Law Enforcement and Firefighting Services Protective Clothing Fabrics Market Value Share Analysis, by Country, 2015 and 2024
10.7. Latin America Law Enforcement and Firefighting Services Protective Clothing Fabrics Market Attractiveness Analysis, by Country, 2015
11. Middle East & Africa
11.1. Middle East & Africa Law Enforcement and Firefighting Protective Clothing Fabrics Market Value Share Analysis, by Application, 2015 and 2024
11.2. Middle East & Africa Law Enforcement & Firefighting Services Market Size (US$ Mn) Forecast, by Application, 2015–2024
11.3. Middle East & Africa Fire Service Market Size (US$ Mn) Forecast, by Application, 2015–2024
11.4. Middle East & Africa Law Enforcement and Firefighting Protective Clothing Fabrics Market Attractiveness Analysis, by Application, 2015
11.5. Middle East & Africa Law Enforcement and Firefighting Services Protective Clothing Fabrics Market (US$ Mn) Forecast, by Country, 2015–2024
11.6. Middle East & Africa Law Enforcement and Firefighting Services Protective Clothing Fabrics Market Value Share Analysis, by Country, 2015 and 2024
11.7. Middle East & Africa Law Enforcement and Firefighting Services Protective Clothing Fabrics Market Attractiveness Analysis, by Country, 2015
12. Company Profiles
12.1. PBI Performance Products, Inc.
12.1.1. Company Details (HQ, Foundation Year, Revenue, Employee Strength)
12.1.2. Business Overview
12.1.3. Product/Services, Key Brands, Key Competitors, Key End-user Industries
12.1.4. Business Strategy
12.1.5. Recent Developments
12.1.6. Financial Details
12.2. Solvay S.A.
12.2.1. Company Details (HQ, Foundation Year, Revenue, Employee Strength)
12.2.2. Business Overview
12.2.3. Product/Services, Key Brands, Key Competitors, Key End-user Industries
12.2.4. Business Strategy
12.2.5. Recent Developments
12.2.6. Financial Details
12.3. Koninklijke Ten Cate nv (TenCate)
12.3.1. Company Details (HQ, Foundation Year, Revenue, Employee Strength)
12.3.2. Business Overview
12.3.3. Product/Services, Key Brands, Key Competitors, Key End-user Industries
12.3.4. Business Strategy
12.3.5. Recent Developments
12.3.6. Financial Details
12.4. Teijin Aramid B.V.
12.4.1. Company Details (HQ, Foundation Year, Revenue, Employee Strength)
12.4.2. Business Overview
12.4.3. Product/Services, Key Brands, Key Competitors, Key End-user Industries
12.4.4. Business Strategy
12.4.5. Recent Developments
12.4.6. Financial Details
12.5. Evonik Industries
12.5.1. Company Details (HQ, Foundation Year, Revenue, Employee Strength)
12.5.2. Business Overview
12.5.3. Product/Services, Key Brands, Key Competitors, Key End-user Industries
12.5.4. Business Strategy
12.5.5. Recent Developments
12.5.6. Financial Details
12.6. Gunei Chemical Industry Co., Ltd.
12.6.1. Company Details (HQ, Foundation Year, Revenue, Employee Strength)
12.6.2. Business Overview
12.6.3. Product/Services, Key Brands, Key Competitors, Key End-user Industries
12.6.4. Business Strategy
12.6.5. Recent Developments
12.6.6. Financial Details
12.7. Huntsman International LLC
12.7.1. Company Details (HQ, Foundation Year, Revenue, Employee Strength)
12.7.2. Business Overview
12.7.3. Product/Services, Key Brands, Key Competitors, Key End-user Industries
12.7.4. Business Strategy
12.7.5. Recent Developments
12.7.6. Financial Details
12.8. Kaneka Corporation
12.8.1. Company Details (HQ, Foundation Year, Revenue, Employee Strength)
12.8.2. Business Overview
12.8.3. Product/Services, Key Brands, Key Competitors, Key End-user Industries
12.8.4. Business Strategy
12.8.5. Recent Developments
12.8.6. Financial Details
12.9. Milliken & Company
12.9.1. Company Details (HQ, Foundation Year, Revenue, Employee Strength)
12.9.2. Business Overview
12.9.3. Product/Services, Key Brands, Key Competitors, Key End-user Industries
12.9.4. Business Strategy
12.9.5. Recent Developments
12.9.6. Financial Details
12.10. Safety Components
12.10.1. Company Details (HQ, Foundation Year, Revenue, Employee Strength)
12.10.2. Business Overview
12.10.3. Product/Services, Key Brands, Key Competitors, Key End-user Industries
12.10.4. Business Strategy
12.10.5. Recent Developments
12.10.6. Financial Details
12.11. Norfab Corporation
12.11.1. Company Details (HQ, Foundation Year, Revenue, Employee Strength)
12.11.2. Business Overview
12.11.3. Product/Services, Key Brands, Key Competitors, Key End-user Industries
12.11.4. Business Strategy
12.11.5. Recent Developments
12.11.6. Financial Details
12.12. AW Hainsworth
12.12.1. Company Details (HQ, Foundation Year, Revenue, Employee Strength)
12.12.2. Business Overview
12.12.3. Product/Services, Key Brands, Key Competitors, Key End-user Industries
12.12.4. Business Strategy
12.12.5. Recent Developments
12.12.6. Financial Details
12.13. TECGEN
12.13.1. Company Details (HQ, Foundation Year, Revenue, Employee Strength)
12.13.2. Business Overview
12.13.3. Product/Services, Key Brands, Key Competitors, Key End-user Industries
12.13.4. Business Strategy
12.13.5. Recent Developments
12.13.6. Financial Details
12.14. Milliken & Company
12.14.1. Company Details (HQ, Foundation Year, Revenue, Employee Strength)
12.14.2. Business Overview
12.14.3. Product/Services, Key Brands, Key Competitors, Key End-user Industries
12.14.4. Business Strategy
12.14.5. Recent Developments
12.14.6. Financial Details
12.15. Mount Vernon Mills, Inc.
12.15.1. Company Details (HQ, Foundation Year, Revenue, Employee Strength)
12.15.2. Business Overview
12.15.3. Product/Services, Key Brands, Key Competitors, Key End-user Industries
12.15.4. Business Strategy
12.15.5. Recent Developments
12.15.6. Financial Details
12.16. Glen Raven, Inc.
12.16.1. Company Details (HQ, Foundation Year, Revenue, Employee Strength)
12.16.2. Business Overview
12.16.3. Product/Services, Key Brands, Key Competitors, Key End-user Industries
12.16.4. Business Strategy
12.16.5. Recent Developments
12.16.6. Financial Details
12.17. Mount Vernon Mills, Inc.
12.17.1. Company Details (HQ, Foundation Year, Revenue, Employee Strength)
12.17.2. Business Overview
12.17.3. Product/Services, Key Brands, Key Competitors, Key End-user Industries
12.17.4. Business Strategy
12.17.5. Recent Developments
12.17.6. Financial Details
12.18. Drifire LLC
12.18.1. Company Details (HQ, Foundation Year, Revenue, Employee Strength)
12.18.2. Business Overview
12.18.3. Product/Services, Key Brands, Key Competitors, Key End-user Industries
12.18.4. Business Strategy
12.18.5. Recent Developments
12.18.6. Financial Details
12.19. Polartec LLC
12.19.1. Company Details (HQ, Foundation Year, Revenue, Employee Strength)
12.19.2. Business Overview
12.19.3. Product/Services, Key Brands, Key Competitors, Key End-user Industries
12.19.4. Business Strategy
12.19.5. Recent Developments
12.19.6. Financial Details
12.20. Taiwan K.K. Corp
12.20.1. Company Details (HQ, Foundation Year, Revenue, Employee Strength)
12.20.2. Business Overview
12.20.3. Product/Services, Key Brands, Key Competitors, Key End-user Industries
12.20.4. Business Strategy
12.20.5. Recent Developments
12.20.6. Financial Details
List of Tables
Table 1: Global Law Enforcement & Firefighting Services Market Size (US$ Mn) Forecast, by Application, 2015–2024
Table 2: Global Fire Service Market Size (US$ Mn) Forecast, by Application, 2015–2024
Table 3: Global Law Enforcement and Firefighting Services Protective Clothing Fabrics market Size (US$ Mn) Forecast, by Region, 2015–2024
Table 4: North America Law Enforcement & Firefighting Services Market Size (US$ Mn) Forecast, by Application, 2015–2024
Table 5: North America Fire Service Market Size (US$ Mn) Forecast, by Application, 2015–2024
Table 6: North America Law Enforcement and Firefighting Services Protective Clothing Fabrics Market (US$ Mn) Forecast, by Region, 2015–2024
Table 7: Europe Law Enforcement and Firefighting Services Protective Clothing Fabrics Market Size (US$ Mn) Forecast, by Country, 2015–2024
Table 8: Europe Law Enforcement & Firefighting Services Market Size (US$ Mn) Forecast, by Application, 2015–2024
Table 9: Europe Fire Service Market Size (US$ Mn) Forecast, by Application, 2015–2024
Table 10: APAC Law Enforcement & Firefighting Services Market Size (US$ Mn) Forecast, by Application, 2015–2024
Table 11: APAC Fire Service Market Size (US$ Mn) Forecast, by Application, 2015–2024
Table 12: APAC Protective Clothing Fabrics Market Size (US$ Mn) Forecast, by Country, 2015–2024
Table 13: Latin America Law Enforcement & Firefighting Services Market Size (US$ Mn) Forecast, by Application, 2015–2024
Table 14: Latin America Fire Service Market Size (US$ Mn) Forecast, by Application, 2015–2024
Table 15: Latin America Law Enforcement and Firefighting Services Protective Clothing fabrics Market Size (US$ Mn) Forecast, by Country, 2015–2024
Table 16: APAC Law Enforcement & Firefighting Services Market Size (US$ Mn) Forecast, by Application, 2015–2024
Table 17: APAC Fire Service Market Size (US$ Mn) Forecast, by Application, 2015–2024
Table 18: Middle East & Africa (MEA) Law Enforcement and Firefighting Services Protective Clothing Fabrics Market Size (US$ Mn) Forecast, by Country, 2015–2024
List of Figures
Figure 1: Global Law Enforcement and Firefighting Protective Clothing Fabrics Market
Figure 2: Global Law Enforcement & Firefighting Services Market Value Share Analysis, by Application, 2015 and 2024
Figure 3: Global Fire Service Market Value Share Analysis, by Application, 2015 and 2024
Figure 5: Global Fire Service Protective Clothing Fabrics Market Attractiveness Analysis, by Application
Figure 6: Global Law Enforcement and Firefighting Services Protective Clothing Fabrics market Value Share Analysis, by Region, 2015 and 2024
Figure 7: Global Law Enforcement and Firefighting Services Protective Clothing Fabrics market Attractiveness Analysis, by Region, in 2015
Figure 8: Prices of Law Enforcement and Firefighting Services Protective Clothing Fabrics, by Region, US$/square Meter, 2015–2024
Figure 9: North America Law Enforcement and Firefighting Services Market Value Share Analysis, by Application, 2015 and 2024
Figure 10: North America Fire Service Market Value Share Analysis, by Application, 2015 and 2024
Figure 11: North America Market Attractiveness Analysis, by Application, 2015
Figure 12: North America Law Enforcement and Firefighting Services Protective Clothing Fabrics Market Value Share Analysis, by Country, 2015 and 2024
Figure 13: North America Law Enforcement and Firefighting Services Protective Clothing Fabrics Market Attractiveness Analysis, by Country, 2015
Figure 14: Europe Law Enforcement & Firefighting Services Market Value Share Analysis, by Application, 2014 and 2020
Figure 15: Europe Fire Service Market Value Share Analysis, by Application, 2014 and 2020
Figure 16: Europe Market Attractiveness Analysis, by Application, 2015
Figure 17: Europe Law Enforcement and Firefighting Services Protective Clothing Fabrics Market Value Share Analysis, by Region, 2015 and 2024
Figure 18: Europe Law Enforcement and Firefighting Services Protective Clothing Fabrics Market Attractiveness Analysis, by Region, 2015
Figure 19: APAC Law Enforcement & Firefighting Services Market Value Share Analysis, by Application, 2015 and 2024
Figure 20: APAC Fire Service Market Value Share Analysis, by Application, 2015 and 2024
Figure 21: Asia Pacific Law Enforcement and Firefighting Services Protective Clothing Fabrics Market Value Share Analysis, by Country, 2015 and 2024
Figure 22: Asia Pacific Law Enforcement and Firefighting Services Protective Clothing Fabrics Market Attractiveness Analysis, by Country, 2015
Figure 23: Asia Pacific Market Attractiveness Analysis, by Application, 2015
Figure 24: Latin America Law Enforcement & Firefighting Services Market Value Share Analysis, by Application, 2015 and 2024
Figure 25: Latin America Fire Service Market Value Share Analysis, by Application, 2015 and 2024
Figure 26: Latin America Law Enforcement and Firefighting Services Protective Clothing Fabrics Market Value Share Analysis, by Country, 2015 and 2024
Figure 27: Latin America Protective Clothing Fabrics Market Attractiveness Analysis, by Country, 2015
Figure 28: Latin America Market Attractiveness Analysis, by Application, 2015
Figure 29: MEA Law Enforcement & Firefighting Services Market Value Share Analysis, by Application, 2015 and 2024
Figure 30: MEA Fire Service Market Value Share Analysis, by Application, 2015 and 2024
Figure 31: MEA Law Enforcement and Firefighting Services Protective Clothing Fabrics Market Value Share Analysis, by Country, 2015 and 2024
Figure 32: MEA Law Enforcement and Firefighting Services Protective Clothing Fabrics Market Attractiveness Analysis, by Country, 2015
Figure 33: Middle East & Africa Market Attractiveness Analysis, by Application, 2015
Copyright © Transparency Market Research, Inc. All Rights reserved
Trust Online

Law Enforcement and Firefighting Protective Clothing Fabrics Market