
Reports
Reports
Global Excipients Market: Snapshot
Booming pharmaceutical industry across the world is helping the global excipients market to grow exponentially. Rising number of medicine manufacturers in emerging region particularly in Latin America is contributing a significant share in the overall growth of the market. Excipients finds its application in pharmaceutical industry for coating, binding, solvent, colorants, and as fillers and diluents, in order to make tablets, capsules, and type of drugs.
The incessant rise in geriatric population all across the world is helping the pharmaceutical industry to grow stupendously, as they are have less immunity making them more vulnerable to various types of diseases. Old people are connected to more complication which requires Medicare. Rapid advancement in technology along with extensive research and development in science, has improved the healthcare industry, making it more expensive. Apart from these, rising disposable income in the region has abode well with the rising rates of treatment, allowing customers to buy medicines in the region has helped the global excipient market to rise exponentially. It is anticipated that by analysts from Transparency Market Research that pharmaceutical industry in the region is expected to grow at stupendous rate of 8.1% CAGR which is likely to push the market in a positive direction in the region.
It is clearly understood that the pharmaceutical industry has a direct influence on the growth of global excipients market. Transparency Market Research, recently published a report, and according to their analysts, the global excipients market in Latin America is prophesized to expand at a whooping CAGR of 6.4% during the forecast period, 2015 – 2023. The market which was worth at US$359.0 mn in 2014 is prognosticated to to touch US$626.9 mn by the end of the assessed period.
Erratic Raw Material Price to Deter the Market Growth
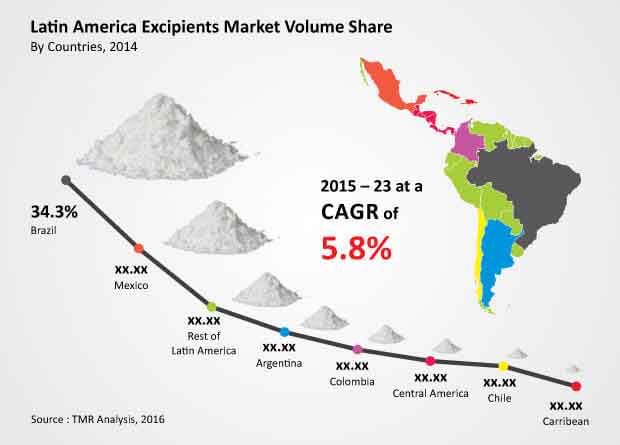
The global excipients market in the region is split into Brazil, Mexico, Central America, Argentina, Caribbean, Colombia, Chile, and Rest of South America. Amongst these, Brazil holds a lion’s share owing to increase in consumption of sugar and other excipients throughout the assessed period. Brazil is likely to grow at robust CAGR of 5.7% during the assessed period. However, on the flip side, Mexico is expected to become the fastest growing market as the country is witnessing a surge in consumption of corsspovidone and poviodone.
However, it has been noticed that the market in the region is strongly been faced by the rising price of the raw materials, which is used for manufacturing organic excipients. This is considered as the major restraint faced by the organic excipients manufacturer in the region, hampering the market. Corn, starch, and maize are the major raw materials that are used for the manufacturing organic excipients market. Apart from excipients market, these raw materials have found its application in energy sector, as they are used for producing cleaner energy. Poor yield, along with increasing application of raw materials have aggressively increased the price of these raw material thus making the market to suffer. However, on the brighter side, the market is filled with lucrative growth opportunity, for example, introduction of new excipients in the market with a proper awareness regarding it among the consumer is likely to break the customers’ resistance. This is anticipated to help the market to grow.
Players to Invest Hefty For Expanding Product Lists
Players in the market are spending bulk in the research and development to produce more efficient product. This step is likely to help the players to increase their product lists and create product differentiation. Players are likely to take constructive steps in increasing customer awareness by educating and advertising about the market. Some of the major players in the market are Avantor Performance Materials Inc., Eastman Chemical Compan, BASF SE, FMC Coporation, and Innophos Holdings Inc.
Ongoing Investments in the Pharmaceutical Industry will Bring Profitable Growth for the Excipients Market
The pharmaceutical industry is growing at a rapid pace across the globe. The use of generic medicines has increased substantially over the years. Drug formulations are experiencing a surge and thus, all these aspects will serve as game changers for the excipients market through the assessment period of 2015-2023.
Table of Contents
Chapter 1 Preface
1.1 Report Description
1.2 Research Scope
1.3 Assumptions
1.4 Market Segmentation
1.5 Research Methodology
Chapter 2 Executive Summary
2.1 Latin America Excipients Market, 2014 - 2023, (Tons) (US$ Thousand)
2.2 Excipients: Market Snapshot
Chapter 3 Excipients Market – Industry Analysis
3.1 Introduction
3.2 Value Chain Analysis
3.3 Market Drivers
3.3.1 Growth in Pharmaceutical Market in Latin America
3.3.2 Increasing Consumption of Oral Solid Dosage Drugs
3.4 Restraints
3.4.1 High Manufacturing Cost
3.4.2 Use of Excipients in Other End-user Industries
3.5 Opportunity
3.5.1 New Product Development
3.6 Porter’s Five Forces Analysis
3.6.1 Bargaining Power of Suppliers
3.6.2 Bargaining Power of Buyers
3.6.3 Threat of New Entrants
3.6.4 Threat of Substitutes
3.6.5 Degree of Competition
3.7 Latin America Excipients Market Attractiveness, by Functionality, 2014
3.8 Latin America Excipients Market Attractiveness, by Country, 2014
3.9 Company Market Share Analysis, 2014
Chapter 4 Price Trend Analysis
4.4 Latin America Average Excipients Price Trend, 2014–2023 (US$/Kg)
Chapter 5 Latin America Excipients Market – Product Segment Analysis
5.1 Latin America Excipients Market: Product Segment Overview
5.2 Latin America Excipients Market for Polymers, 2014–2023 (Tons) (US$ Thousand)
5.3 Latin America Excipients Market for Alcohols, 2014–2023 (Tons) (US$ Thousand)
5.4 Latin America Excipients Market for Minerals, 2014–2023 (Tons) (US$ Thousand)
5.5 Latin America Excipients Market for Gelatin, 2014–2023 (Tons) (US$ Thousand)
5.6 Latin America Excipients Market for Sugar & Other Excipients, 2014–2023 (Tons) (US$ Thousand)
Chapter 6 Latin America Excipients Market – Functional Analysis
6.1 Latin America Excipients Market: Functional Overview
6.2 Latin America Excipients Market for Fillers & Diluents, 2014–2023 (Tons) (US$ Thousand)
6.3 Latin America Excipients Market for Disintegrants, 2014–2023 (Tons) (US$ Thousand)
6.4 Latin America Excipients Market for Binders & Adhesives, 2014–2023 (Tons) (US$ Thousand)
6.5 Latin America Excipients Market for Lubricants & Glidants, 2014–2023 (Tons) (US$ Thousand)
6.6 Latin America Excipients Market for Flavors & Sweeteners, 2014–2023 (Tons) (US$ Thousand)
6.7 Latin America Excipients Market for Viscosity Agents, 2014–2023 (Tons) (US$ Thousand)
6.8 Latin America Excipients Market for Film Coatings, 2014–2023 (Tons) (US$ Thousand)
6.9 Latin America Excipients Market for Controlled Release, 2014–2023 (Tons) (US$ Thousand)
6.10 Latin America Excipients Market for Others, 2014–2023 (Tons) (US$ Thousand)
Chapter 7 Latin America Excipients Market – Route of Administration Analysis
7.1 Latin America Excipients Market: Route of Administration Overview
7.2 Latin America Excipients Market for Oral, 2014–2023 (Tons) (US$ Thousand)
7.3 Latin America Excipients Market for Topical, 2014–2023 (Tons) (US$ Thousand)
7.4 Latin America Excipients Market for Parenteral, 2014–2023 (Tons) (US$ Thousand)
7.5 Latin America Excipients Market for Others (Pulmonary, Ocular, Nasal, etc.), 2014–2023 (Tons) (US$ Thousand)
Chapter 8 Latin America Excipients Market - Regional Analysis
8.1 Mexico Excipients Market Volume, by Product (Tons), 2014–2023
8.2 Mexico Excipients Market Revenue, by Product (US$ Thousand), 2014–2023
8.3 Mexico Excipients Market for Polymers, by Type (Tons), 2014–2023
8.4 Mexico Excipients Market for Polymers, by Type (US$ Thousand), 2014–2023
8.5 Mexico Excipients Market Volume for Alcohols, by Type (Tons), 2014–2023
8.6 Mexico Excipients Market Revenue for Alcohols, by Type (US$ Thousand), 2014–2023
8.7 Mexico Excipients Market Volume for Minerals, by Type (Tons), 2014–2023
8.8 Mexico Excipients Market Revenue for Minerals, by Type (US$ Thousand), 2014–2023
8.9 Mexico Excipients Market Volume for Sugar & Other Excipients, by Type (Tons), 2014–2023
8.10 Mexico Excipients Market Revenue for Sugar & Other Excipients, by Type (US$ Thousand), 2014–2023
8.11 Mexico Excipients Market Volume, by Function (Tons), 2014–2023
8.12 Mexico Excipients Market Revenue, by Function (US$ Thousand), 2014–2023
8.13 Mexico Excipients Market Volume, by Route (Tons), 2014–2023
8.14 Mexico Excipients Market Revenue, by Route (US$ Thousand), 2014–2023
8.15 Mexico Excipients Market Volume for Oral, by Medicine Form (Tons), 2014–2023
8.16 Mexico Excipients Market Revenue for Oral, by Medicine Form (US$ Thousand), 2014–2023
8.17 Central America Excipients Market Volume, by Product (Tons), 2014–2023
8.18 Central America Excipients Market Revenue, by Product (US$ Thousand), 2014–2023
8.19 Central America Excipients Market for Polymers, by Type (Tons), 2014–2023
8.20 Central America Excipients Market for Polymers, by Type (US$ Thousand), 2014–2023
8.21 Central America Excipients Market Volume for Alcohols, by Type (Tons), 2014–2023
8.22 Central America Excipients Market Revenue for Alcohols, by Type (US$ Thousand), 2014–2023
8.23 Central America Excipients Market Volume for Minerals, by Type (Tons), 2014–2023
8.24 Central America Excipients Market Revenue for Minerals, by Type (US$ Thousand), 2014–2023
8.25 Central America Excipients Market Volume for Sugar & Other Excipients, by Type (Tons), 2014–2023
8.26 Central America Excipients Market Revenue for Sugar & Other Excipients, by Type (US$ Thousand), 2014–2023
8.27 Central America Excipients Market Volume, by Function (Tons), 2014–2023
8.28 Central America Excipients Market Revenue, by Function (US$ Thousand), 2014–2023
8.29 Central America Excipients Market Volume, by Route (Tons), 2014–2023
8.30 Central America Excipients Market Revenue, by Route (US$ Thousand), 2014–2023
8.31 Central America Excipients Market Volume for Oral, by Medicine Form (Tons), 2014–2023
8.32 Central America Excipients Market Revenue for Oral, by Medicine Form, (US$ Thousand), 2014–2023
8.33 South America Excipients Market Volume, by Product (Tons), 2014–2023
8.34 South America Excipients Market Revenue, by Product (US$ Thousand), 2014–2023
8.35 South America Excipients Market for Polymers, by Type (Tons), 2014–2023
8.36 South America Excipients Market for Polymers, by Type (US$ Thousand), 2014–2023
8.37 South America Excipients Market Volume for Alcohols, by Type (Tons), 2014–2023
8.38 South America Excipients Market Revenue for Alcohols, by Type (US$ Thousand), 2014–2023
8.39 South America Excipients Market Volume for Minerals, by Type (Tons), 2014–2023
8.40 South America Excipients Market Revenue for Minerals, by Type (US$ Thousand), 2014–2023
8.41 South America Excipients Market Volume for Sugar & Other Excipients, by Type (Tons), 2014–2023
8.42 South America Excipients Market Revenue for Sugar & Other Excipients, by Type (US$ Thousand), 2014–2023
8.43 South America Excipients Market Volume, by Function (Tons), 2014–2023
8.44 South America Excipients Market Revenue, by Function (US$ Thousand), 2014–2023
8.45 South America Excipients Market Volume, by Route (Tons), 2014–2023
8.46 South America Excipients Market Revenue, by Route (US$ Thousand), 2014–2023
8.47 South America Excipients Market Volume for Oral, by Medicine Form (Tons), 2014–2023
8.48 South America Excipients Market Revenue for Oral, by Medicine Form, (US$ Thousand), 2014–2023
8.49 Brazil Excipients Market Volume, by Product (Tons), 2014–2023
8.50 Brazil Excipients Market Revenue, by Product (US$ Thousand), 2014–2023
8.51 Brazil Excipients Market for Polymers, by Type (Tons), 2014–2023
8.52 Brazil Excipients Market for Polymers, by Type (US$ Thousand), 2014–2023
8.53 Brazil Excipients Market Volume for Alcohols, by Type (Tons), 2014–2023
8.54 Brazil Excipients Market Revenue for Alcohols, by Type (US$ Thousand), 2014–2023
8.55 Brazil Excipients Market Volume for Minerals, by Type (Tons), 2014–2023
8.56 Brazil Excipients Market Revenue for Minerals, by Type (US$ Thousand), 2014–2023
8.57 Brazil Excipients Market Volume for Sugar & Other Excipients, by Type (Tons), 2014–2023
8.58 Brazil Excipients Market Revenue for Sugar & Other Excipients, by Type (US$ Thousand), 2014–2023
8.59 Brazil Excipients Market Volume, by Function (Tons), 2014–2023
8.60 Brazil Excipients Market Revenue, by Function (US$ Thousand), 2014–2023
8.61 Brazil Excipients Market Volume, by Route (Tons), 2014–2023
8.62 Brazil Excipients Market Revenue, by Route (US$ Thousand), 2014–2023
8.63 Brazil Excipients Market Volume for Oral, by Medicine Form (Tons), 2014–2023
8.64 Brazil Excipients Market Revenue for Oral, by Medicine Form, (US$ Thousand), 2014–2023
8.65 Argentina Excipients Market Volume, by Product (Tons), 2014–2023
8.66 Argentina Excipients Market Revenue, by Product (US$ Thousand), 2014–2023
8.67 Argentina Excipients Market for Polymers, by Type (Tons), 2014–2023
8.68 Argentina Excipients Market for Polymers, by Type (US$ Thousand), 2014–2023
8.69 Argentina Excipients Market Volume for Alcohols, by Type (Tons), 2014–2023
8.70 Argentina Excipients Market Revenue for Alcohols, by Type (US$ Thousand), 2014–2023
8.71 Argentina Excipients Market Volume for Minerals, by Type (Tons), 2014–2023
8.72 Argentina Excipients Market Revenue for Minerals, by Type (US$ Thousand), 2014–2023
8.73 Argentina Excipients Market Volume for Sugar & Other Excipients, by Type (Tons), 2014–2023
8.74 Argentina Excipients Market Revenue for Sugar & Other Excipients, by Type (US$ Thousand), 2014–2023
8.75 Argentina Excipients Market Volume, by Function (Tons), 2014–2023
8.76 Argentina Excipients Market Revenue, by Function (US$ Thousand), 2014–2023
8.77 Argentina Excipients Market Volume, by Route (Tons), 2014–2023
8.78 Argentina Excipients Market Revenue, by Route (US$ Thousand), 2014–2023
8.79 Argentina Excipients Market Volume for Oral, by Medicine Form (Tons), 2014–2023
8.80 Argentina Excipients Market Revenue for Oral, by Medicine Form, (US$ Thousand), 2014–2023
8.81 Caribbean Excipients Market Volume, by Product (Tons), 2014–2023
8.82 Caribbean Excipients Market Revenue, by Product (US$ Thousand), 2014–2023
8.83 Caribbean Excipients Market for Polymers, by Type (Tons), 2014–2023
8.84 Caribbean Excipients Market for Polymers, by Type (US$ Thousand), 2014–2023
8.85 Caribbean Excipients Market Volume for Alcohols, by Type (Tons), 2014–2023
8.86 Caribbean Excipients Market Revenue for Alcohols, by Type (US$ Thousand), 2014–2023
8.87 Caribbean Excipients Market Volume for Minerals, by Type (Tons), 2014–2023
8.88 Caribbean Excipients Market Revenue for Minerals, by Type (US$ Thousand), 2014–2023
8.89 Caribbean Excipients Market Volume for Sugar & Other Excipients, by Type (Tons), 2014–2023
8.90 Caribbean Excipients Market Revenue for Sugar & Other Excipients, by Type (US$ Thousand), 2014–2023
8.91 Caribbean Excipients Market Volume, by Function (Tons), 2014–2023
8.92 Caribbean Excipients Market Revenue, by Function (US$ Thousand), 2014–2023
8.93 Caribbean Excipients Market Volume, by Route (Tons), 2014–2023
8.94 Caribbean Excipients Market Revenue, by Route (US$ Thousand), 2014–2023
8.95 Caribbean Excipients Market Volume for Oral, by Medicine Form (Tons), 2014–2023
8.96 Caribbean Excipients Market Revenue for Oral, by Medicine Form, (US$ Thousand), 2014–2023
8.97 Columbia Excipients Market Volume, by Product (Tons), 2014–2023
8.98 Columbia Excipients Market Revenue, by Product (US$ Thousand), 2014–2023
8.99 Columbia Excipients Market for Polymers, by Type (Tons), 2014–2023
8.100 Columbia Excipients Market for Polymers, by Type (US$ Thousand), 2014–2023
8.101 Columbia Excipients Market Volume for Alcohols, by Type (Tons), 2014–2023
8.102 Columbia Excipients Market Revenue for Alcohols, by Type (US$ Thousand), 2014–2023
8.103 Columbia Excipients Market Volume for Minerals, by Type (Tons), 2014–2023
8.104 Columbia Excipients Market Revenue for Minerals, by Type (US$ Thousand), 2014–2023
8.105 Columbia Excipients Market Volume for Sugar & Other Excipients, by Type (Tons), 2014–2023
8.106 Columbia Excipients Market Revenue for Sugar & Other Excipients, by Type (US$ Thousand), 2014–2023
8.107 Columbia Excipients Market Volume, by Function (Tons), 2014–2023
8.108 Columbia Excipients Market Revenue, by Function (US$ Thousand), 2014–2023
8.109 Columbia Excipients Market Volume, by Route (Tons), 2014–2023
8.110 Columbia Excipients Market Revenue, by Route (US$ Thousand), 2014–2023
8.111 Columbia Excipients Market Volume for Oral, by Medicine Form (Tons), 2014–2023
8.112 Columbia Excipients Market Revenue for Oral, by Medicine Form, (US$ Thousand), 2014–2023
8.113 Chile Excipients Market Volume, by Product (Tons), 2014–2023
8.114 Chile Excipients Market Revenue, by Product (US$ Thousand), 2014–2023
8.115 Chile Excipients Market for Polymers, by Type (Tons), 2014–2023
8.116 Chile Excipients Market for Polymers, by Type (US$ Thousand), 2014–2023
8.117 Chile Excipients Market Volume for Alcohols, by Type (Tons), 2014–2023
8.118 Chile Excipients Market Revenue for Alcohols, by Type (US$ Thousand), 2014–2023
8.119 Chile Excipients Market Volume for Minerals, by Type (Tons), 2014–2023
8.120 Chile Excipients Market Revenue for Minerals, by Type (US$ Thousand), 2014–2023
8.121 Chile Excipients Market Volume for Sugar & Other Excipients, by Type (Tons), 2014–2023
8.122 Chile Excipients Market Revenue for Sugar & Other Excipients, by Type (US$ Thousand), 2014–2023
8.123 Chile Excipients Market Volume, by Function (Tons), 2014–2023
8.124 Chile Excipients Market Revenue, by Function (US$ Thousand), 2014–2023
8.125 Chile Excipients Market Volume, by Route (Tons), 2014–2023
8.126 Chile Excipients Market Revenue, by Route (US$ Thousand), 2014–2023
8.127 Chile Excipients Market Volume for Oral, by Medicine Form (Tons), 2014–2023
8.128 Chile Excipients Market Revenue for Oral, by Medicine Form, (US$ Thousand), 2014–2023
8.129 Rest of South America Excipients Market Volume, by Product (Tons), 2014–2023
8.130 Rest of South America Excipients Market Revenue, by Product (US$ Thousand), 2014–2023
8.131 Rest of South America Excipients Market for Polymers, by Type (Tons), 2014–2023
8.132 Rest of South America Excipients Market for Polymers, by Type (US$ Thousand), 2014–2023
8.133 Rest of South America Excipients Market Volume for Alcohols, by Type (Tons), 2014–2023
8.134 Rest of South America Excipients Market Revenue for Alcohols, by Type (US$ Thousand), 2014–2023
8.135 Rest of South America Excipients Market Volume for Minerals, by Type (Tons), 2014–2023
8.136 Rest of South America Excipients Market Revenue for Minerals, by Type (US$ Thousand), 2014–2023
8.137 Rest of South America Excipients Market Volume for Sugar & Other Excipients, by Type (Tons), 2014–2023
8.138 Rest of South America Excipients Market Revenue for Sugar & Other Excipients, by Type (US$ Thousand), 2014–2023
8.139 Rest of South America Excipients Market Volume, by Function (Tons), 2014–2023
8.140 Rest of South America Excipients Market Revenue, by Function (US$ Thousand), 2014–2023
8.141 Rest of South America Excipients Market Volume, by Route (Tons), 2014–2023
8.142 Rest of South America Excipients Market Revenue, by Route (US$ Thousand), 2014–2023
8.143 Rest of South America Excipients Market Volume for Oral, by Medicine Form (Tons), 2014–2023
8.144 Rest of South America Excipients Market Revenue for Oral, by Medicine Form, (US$ Thousand), 2014–2023
Chapter 9 Company Profiles
9.1 Merck KGaA
9.2 Archer Daniels Midland (ADM) Company
9.3 Ashland Inc.
9.4 FMC Corporation
9.5 BASF SE
9.6 Evonik Industries AG
9.7 Cabot Corporation
9.8 The Dow Chemical Company
9.9 Asahi-Kasei Corporation
9.10 Eastman Chemical Company
9.11 The Lubrizol Corporation
9.12 Croda International plc.
9.13 Cargill Inc.
9.14 Innophos Holdings Inc.
9.15 Colorcon Inc.
9.16 Avantor Performance Materials Inc.
9.17 Roquette Pharma
9.18 JRS Pharma
9.19 CP Kelco
Chapter 10 Primary Research – Key Findings
Chapter 11 List of Key Customers
Copyright © Transparency Market Research, Inc. All Rights reserved
Trust Online

Latin America Excipients Market Forecast 2015 - 2023