
Reports
Reports
Global IoT Solutions Market for Energy Industry: Snapshot
In the energy sector, IoT technologies have changed several aspects, such as reducing the possibilities of failures and delays, enhancing productivity and efficiency, improving real-time decision making, solving critical problems, and creating new and innovative experiences. As oil and gas companies are exploring ways to cut down production costs and optimize operations to increase profit margins, solutions provided by IoT technologies to tackle these challenges are witnessing increased demand. IOT solutions aid in minimizing risks and improving safety across all the processes in the energy industry. Oil and gas production output can also be enhanced with the assistance of IOT solutions. IOT solutions can also be used for assessing risky operations, and preventive measures can be undertaken to avoid accidents in the energy industry. In the coming years, with constantly improving technology and increasing integration of large-scale data, even small- and medium-scale players in the energy industry would be drawn to adopt IOT solution and services in the near future.
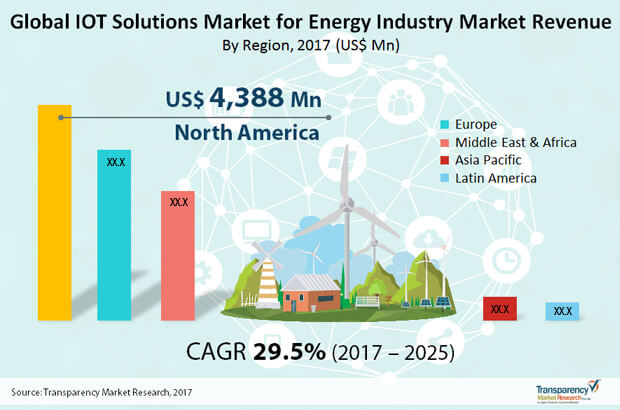
According to this report, the global IoT solutions market for the energy industry will expand at an unprecedented CAGR of 29.5% over the period between 2017 and 2025.
The energy sector has stormed across all the other leading industries, prompting the former to revamp their modes of operation. The global energy crisis has gripped all the nations and industries, and has led to the development of a collective cynosure for energy management. The use of smart technologies in energy management has increased by leaps and bounds, creating fresh demand within the global IoT solutions market. The potential of the internet of things (IoT) is well understood and acknowledged by leading industries and companies. Besides, research lines suggest the strong synchronization between the offerings of IoT and the requirements of the energy sector. Therefore, the demand within the global IoT solutions market is slated to increase by leaps and bounds in the times to fall by.
The oil and gas industry has become increasingly focused towards preventing resource wastage. This has led them to install IoT-enabled sensors that track wastage and spilling of oil.
Oil and Gas Sector to Remain Key Revenue Contributor
The IOT solutions market for the energy industry has been segmented based on solution, application, end-user industry, and region/country. On the basis of solution, the market has been segregated into: analytic software, hardware platform, service, and connectivity. By application, the market has been divided into pipeline, refineries, grid control, digital oilfield, and others. By end-user industry, the market is classified into oil & gas, solar, wind, and others. By end-user industry, oil and gas constituted the dominant share of nearly 72% in 2016.
Asia Pacific to Lead to Promising Growth Opportunities
The global market for IOT solutions for energy industry has been segmented on the basis of geography into North America, Europe, Asia Pacific, Middle East and Africa, and Latin America. The global IOT solutions market for energy industry was dominated by North America in 2016. The U.S. is the market leader in region owing to the fact that the oil and gas industry in the country has been utilizing IOT solutions on a wide scale, especially in upstream applications. Europe was the second-largest market globally for IOT solutions for energy industry in 2016. Countries such as France, Germany, and the U.K were the major players in Europe IOT solutions for energy industry market in 2016.
Asia Pacific was the third-largest market globally for IOT solutions market for energy industry in 2016. However, Asia Pacific is expected to grow at a higher growth rate when compared to other regions across the globe. Countries such as China, India, and Japan are expected to be the major players in the region during the forecast period. The IOT solutions market for energy industry in Middle East and Africa accounted for a mere 3.2% of the global market share in 2016. Middle East and Africa IoT solutions market for energy industry is expected to grow at a moderate rate. Countries such as as GCC and South Africa are expected to drive the market in the region during the forecast period.
Some of the leading companies operating in IOT solutions market for energy industry are AGT International, Carriots, Cisco, Davra Networks, Flutura, IBM, Telit, Maven Systems Pvt. Ltd., SAP SE, Symboticware Inc., Hortonworks Inc, Accenture, and Tego Inc.
1. Preface
1.1. Report Scope and Market Segmentation
1.2. Research Highlights
2. Assumptions and Research Methodology
2.1. Assumptions and Acronyms Used
2.2. Research Methodology
3. Executive Summary
3.1. Market Size, Global IOT Solutions for Energy Industry (US$ Mn)
3.2. Key Trends
3.3. Regional Overview, 2016- 2025
4. Market Overview
4.1. Introduction
4.2. Market Indicators
5. Market Dynamics
5.1. Drivers
5.2. Restraints
5.3. Opportunity
5.4. IOT Solutions for Energy Industry Size (US$ Mn) Forecast, 2017–2025
5.5. Porter’s Analysis
5.5.1. Threat of Substitutes
5.5.2. Bargaining Power of Buyers
5.5.3. Bargaining Power of Suppliers
5.5.4. Threat of New Entrants
5.5.5. Degree of Competition
5.6. Value Chain Analysis
5.7. List of Customers & Suppliers
6. Global IOT Solutions for Energy Industry Analysis, by Region
6.1. Global Regulatory Scenario
6.2. Global IOT Solutions for Energy Industry Forecast (Revenue), by Region
6.3. Market Attractiveness, by Region
7. Global IOT Solutions for Energy Industry Analysis, by Product
7.1. Key Findings
7.2.Introduction
7.3. Key Trends
7.4. IOT Solutions for Energy Industry Size (US$ Mn) Forecast 2017–2025, by Solution
7.4.1. IOT Solutions for Energy Industry Forecast, by Analytic Software
7.4.2. IOT Solutions for Energy Industry Forecast, by Hardware Platform
7.4.3. IOT Solutions for Energy Industry Analysis, by Service
7.4.4. IOT Solutions for Energy Industry Analysis, by Connectivity
7.5. IOT Solutions for Energy Industry Attractiveness Analysis, by Solution
7.6. Comparison Matrix- Solution
8. Global IOT Solutions for Energy Industry Analysis, by Application
8.1. Key Findings
8.2. Introduction
8.3. Key Trends
8.4. IOT Solutions for Energy Industry Size (US$ Mn) Forecast 2017–2025, by Application
8.4.1. IOT Solutions for Energy Industry Forecast, by Pipeline
8.4.2. IOT Solutions for Energy Industry Forecast, by Refineries
8.4.3. IOT Solutions for Energy Industry Analysis, by Grid Control
8.4.4. IOT Solutions for Energy Industry Analysis, by Digital Oilfield
8.4.5. IOT Solutions for Energy Industry Analysis, by Others
8.5. IOT Solutions for Energy Industry Attractiveness Analysis, by Application
8.6. Comparison Matrix- Application
9. Global IOT Solutions for Energy Industry Analysis, by End-user Industry
9.1. Key Findings
9.2. Introduction
9.3. Key Trends
9.4. IOT Solutions for Energy Industry Size (US$ Mn) Forecast 2017–2025, by End-userIndustry
9.4.1. IOT Solutions for Energy Industry Forecast, by Oil & Gas
9.4.2. IOT Solutions for Energy Industry Forecast, by Solar
9.4.3. IOT Solutions for Energy Industry Forecast, by Wind
9.4.4. IOT Solutions for Energy Industry Forecast, by Others
9.5. IOT Solutions for Energy Industry Attractiveness Analysis, by End-user Industry
9.6. Comparison Matrix- End-user Industry
10. North America IOT Solutions for Energy Industry Analysis and Forecast, 2017–2025
10.1. Key Findings
10.2. North America IOT Solutions for Energy Industry Overview
10.3. North America IOT Solutions for Energy Industry Size (US$ Mn) Forecast, by Solution
10.4. North America IOT Solutions for Energy Industry Size (US$ Mn) Forecast, by Application
10.5. North America IOT Solutions for Energy Industry Size (US$ Mn) Forecast, by End-user Industry
10.6. North America IOT Solutions for Energy Industry Size (US$ Mn)Forecast, by Country
10.6.1. U.S.
10.6.2. Canada
10.7. North America IOT Solutions for Energy Industry Comparison Matrix:
10.7.1. By Solution
10.7.2. By Application
10.7.3. By End-user Industry
11. Europe IOT Solutions for Energy Industry Analysis and Forecast 2017–2025
11.1. Key Findings
11.2. Europe IOT Solutions for Energy Industry Overview
11.3. Europe IOT Solutions for Energy Industry Size (US$ Mn) Forecast, by Solution
11.4. Europe IOT Solutions for Energy Industry Size (US$ Mn) Forecast, by Application
11.5. Europe IOT Solutions for Energy Industry Size (US$ Mn) Forecast, by End-user Industry
11.8. Europe IOT Solutions for Energy Industry Size (US$ Mn)Forecast, by Country
11.8.1. Germany
11.8.2. U.K.
11.8.3. France
11.8.4. Italy
11.8.5. Spain
11.8.6. Rest of Europe
11.9. Europe IOT Solutions for Energy Industry Comparison Matrix:
11.9.1. By Solution
11.9.2. By Application
11.9.3. By End-user Industry
12. Asia Pacific IOT Solutions for Energy Industry Analysis and Forecast 2017–2025
12.1. Key Findings
12.2. Asia Pacific IOT Solutions for Energy Industry Overview
12.3. Asia Pacific IOT Solutions for Energy Industry Size (US$ Mn) Forecast, by Solution
12.4. Asia Pacific IOT Solutions for Energy Industry Size (US$ Mn) Forecast, by Application
12.5. Asia Pacific IOT Solutions for Energy Industry Size (US$ Mn) Forecast, by End-user Industry
12.6. Asia Pacific IOT Solutions for Energy Industry Size (US$ Mn)Forecast, by Country
12.6.1. China
12.6.2. India
12.6.3. Japan
12.6.4. ASEAN
12.6.5. Rest of Asia Pacific
12.7. Asia Pacific IOT Solutions for Energy Industry Comparison Matrix:
12.7.1. By Solution
12.7.2. By Application
12.7.3. By End-user Industry
13. Middle East & Africa IOT Solutions for Energy Industry Analysis and Forecast 2017–2025
13.1. Key Findings
13.2. Middle East & Africa IOT Solutions for Energy Industry Overview
13.3. Middle East & Africa IOT Solutions for Energy Industry Size (US$ Mn) Forecast, by Solution
13.4. Middle East & Africa IOT Solutions for Energy Industry Size (US$ Mn) Forecast, by Application
13.5. Middle East & Africa IOT Solutions for Energy Industry Size (US$ Mn) Forecast, by End-user Industry
13.6. Middle East & Africa IOT Solutions for Energy Industry Size (US$ Mn)Forecast, by Country
13.6.1. Egypt
13.6.2. GCC
13.6.3. South Africa
13.6.3. Rest of Middle East & Africa
13.7. Middle East & Africa IOT Solutions for Energy Industry Comparison Matrix:
13.7.1. By Solution
13.7.2. By Application
13.7.3. By End-user Industry
14. Latin America IOT Solutions for Energy Industry Analysis and Forecast 2017–2025
14.1. Key Findings
14.2. Latin America IOT Solutions for Energy Industry Overview
14.3. Latin America IOT Solutions for Energy Industry Size (US$ Mn) Forecast, by Solution
14.4. Latin America IOT Solutions for Energy Industry Size (US$ Mn) Forecast, by Application
14.5. Latin America IOT Solutions for Energy Industry Size (US$ Mn) Forecast, by End-user Industry
14.6. Latin America IOT Solutions for Energy Industry Size (US$ Mn)Forecast, by Country
14.6.1. Brazil
14.6.2. Mexico
14.6.3. Rest of Latin America
14.7. Latin America IOT Solutions for Energy Industry Comparison Matrix:
14.7.1. By Solution
14.7.2. By Application
14.7.3. By End-user Industry
15. Competition Landscape
15.1. Company Market Share (%)
15.2. Competition Matrix
15.3. Company Profiles
15.3.1. AGT International
15.3.1.1. Company Description
15.3.1.2. Business Overview
15.3.1.3. Financial Overview
15.3.1.4. Strategic Overview
15.3.2. Cisco Systems, Inc.
15.3.2.1. Company Description
15.3.2.2. Business Overview
15.3.2.3. Financial Overview
15.3.2.4. Strategic Overview
15.3.3. Davra Networks
15.3.3.1. Company Description
15.3.3.2. Business Overview
15.3.3.3. Financial Overview
15.3.3.4. Strategic Overview
15.3.4. Flutura Business Solutions LLC.
15.3.4.1. Company Description
15.3.4.2. Business Overview
15.3.5. IBM
15.3.5.1. Company Description
15.3.5.2. Business Overview
15.3.6. Telit
15.3.6.1. Company Description
15.3.6.2. Business Overview
15.3.7. Maven Systems Pvt. Ltd.
15.3.7.1. Company Description
15.3.7.2. Business Overview
16.3.8. SAP SE
15.3.8.1. Company Description
15.3.8.2. Business Overview
15.3.8.3. Financial Overview
15.3.8.4. Strategic Overview
15.3.9. Symboticware Inc.
15.3.9.1. Company Description
15.3.9.2. Business Overview
15.3.10. Intel Corporation
15.3.10.1. Company Description
15.3.10.2. Business Overview
15.3.10.3. Financial Overview
15.3.10.4. Strategic Overview
15.3.11. Accenture
15.3.11.1. Company Description
15.3.11.2. Business Overview
15.3.11.3. Strategic Overview
16. Key Take Away
List of Tables
Table 1: Global IOT Systems Market for Energy Industry, Revenue (US$ Mn) Forecast, by Region, 2016–2025
Table 2: Global IOT Solutions Market for Energy Industry Market Size (US$ Mn) Forecast, by Solutions, 2016–2025
Table 3: Global IOT Systems Market for Energy Industry Market Size (US$ Mn) Forecast, by Application, 2016–2025
Table 4: Global IOT Solutions Market for Energy Industry Market Size (US$ Mn) Forecast, by End-user Industry, 2016–2025
Table 5: North America IOT Solutions Market for Energy Industry Revenue (US$ Mn) Forecast, by Country/Sub-region, 2016–2025
Table 6: North America IOT Solutions Market for Energy Industry Market Size (US$ Mn) Forecast, by End-user Industry, 2016–2025
Table 7: North America IOT Solutions Market for Energy Industry Market Size (US$ Mn) Forecast, by Solutions, 2016–2025
Table 8: North America IOT Solutions Market for Energy Industry Market Size (US$ Mn) Forecast, by Application, 2016–2025
Table 9: U.S. IOT Solutions Market for Energy Industry Market Size (US$ Mn) Forecast, by End-user Industry, 2016–2025
Table 10: U.S. IOT Solutions Market for Energy Industry Market Size (US$ Mn) Forecast, by Solutions, 2016–2025
Table 11: U.S. IOT Solutions Market for Energy Industry Market Size (US$ Mn) Forecast, by Application, 2016–2025
Table 12: Canada IOT Solutions Market for Energy Industry Market Size (US$ Mn) Forecast, by End-user Industry, 2016–2025
Table 13: Canada IOT Solutions Market for Energy Industry Market Size (US$ Mn) Forecast, by Solutions, 2016–2025
Table 14: Canada IOT Solutions Market for Energy Industry Market Size (US$ Mn) Forecast, by Application, 2016–2025
Table 15: Europe IOT Solutions Market for Energy Industry Revenue (US$ Mn) Forecast, by Country/Sub-region, 2016–2025
Table 16: Europe IOT Solutions Market for Energy Industry Market Size (US$ Mn) Forecast, by End-user Industry, 2016–2025
Table 17: Europe IOT Solutions Market for Energy Industry Market Size (US$ Mn) Forecast, by Solutions, 2016–2025
Table 18: Europe IOT Solutions Market for Energy Industry Market Size (US$ Mn) Forecast, by Application, 2016–2025
Table 19: Germany IOT Solutions Market for Energy Industry Market Size (US$ Mn) Forecast, by End-user Industry, 2016–2025
Table 20: Germany IOT Solutions Market for Energy Industry Market Size (US$ Mn) Forecast, by Solutions, 2016–2025
Table 21: Germany IOT Solutions Market for Energy Industry Market Size (US$ Mn) Forecast, by Application, 2016–2025
Table 22: U.K. IOT Solutions Market for Energy Industry Market Size (US$ Mn) Forecast, by End-user Industry, 2016–2025
Table 23: U.K. IOT Solutions Market for Energy Industry Market Size (US$ Mn) Forecast, by Solutions, 2016–2025
Table 24: U.K. IOT Solutions Market for Energy Industry Market Size (US$ Mn) Forecast, by Application, 2016–2025
Table 25: France IOT Solutions Market for Energy Industry Market Size (US$ Mn) Forecast, by End-user Industry, 2016–2025
Table 26: France IOT Solutions Market for Energy Industry Market Size (US$ Mn) Forecast, by Solutions, 2016–2025
Table 27: France IOT Solutions Market for Energy Industry Market Size (US$ Mn) Forecast, by Application, 2016–2025
Table 28: Italy IOT Solutions Market for Energy Industry Market Size (US$ Mn) Forecast, by End-user Industry, 2016–2025
Table 29: Italy IOT Solutions Market for Energy Industry Market Size (US$ Mn) Forecast, by Solutions, 2016–2025
Table 30: Italy IOT Solutions Market for Energy Industry Market Size (US$ Mn) Forecast, by Application, 2016–2025
Table 31: Spain IOT Solutions Market for Energy Industry Market Size (US$ Mn) Forecast, by End-user Industry, 2016–2025
Table 32: Spain IOT Solutions Market for Energy Industry Market Size (US$ Mn) Forecast, by Solutions, 2016–2025
Table 33: Spain IOT Solutions Market for Energy Industry Market Size (US$ Mn) Forecast, by Application, 2016–2025
Table 34: Rest of Europe IOT Solutions Market for Energy Industry Market Size (US$ Mn) Forecast, by End-user Industry, 2016–2025
Table 35: Rest of Europe IOT Solutions Market for Energy Industry Market Size (US$ Mn) Forecast, by Solutions, 2016–2025
Table 36: Rest of Europe IOT Solutions Market for Energy Industry Market Size (US$ Mn) Forecast, by Application, 2016–2025
Table 37: Asia Pacific IOT Solutions Market for Energy Industry Revenue (US$ Mn) Forecast, by Country/Sub-region, 2016–2025
Table 38: Asia Pacific IOT Solutions Market for Energy Industry Market Size (US$ Mn) Forecast, by End-user Industry, 2016–2025
Table 39: Asia Pacific IOT Solutions Market for Energy Industry Market Size (US$ Mn) Forecast, by Solutions, 2016–2025
Table 40: Asia Pacific IOT Solutions Market for Energy Industry Market Size (US$ Mn) Forecast, by Application, 2016–2025
Table 41: China IOT Solutions Market for Energy Industry Market Size (US$ Mn) Forecast, by End-user Industry, 2016–2025
Table 42: China IOT Solutions Market for Energy Industry Market Size (US$ Mn) Forecast, by Solutions, 2016–2025
Table 43: China IOT Solutions Market for Energy Industry Market Size (US$ Mn) Forecast, by Application, 2016–2025
Table 44: India IOT Solutions Market for Energy Industry Market Size (US$ Mn) Forecast, by End-user Industry, 2016–2025
Table 45: India IOT Solutions Market for Energy Industry Market Size (US$ Mn) Forecast, by Solutions, 2016–2025
Table 46: India IOT Solutions Market for Energy Industry Market Size (US$ Mn) Forecast, by Application, 2016–2025
Table 47: Japan IOT Solutions Market for Energy Industry Market Size (US$ Mn) Forecast, by End-user Industry, 2016–2025
Table 48: Japan IOT Solutions Market for Energy Industry Market Size (US$ Mn) Forecast, by Solutions, 2016–2025
Table 49: Japan IOT Solutions Market for Energy Industry Market Size (US$ Mn) Forecast, by Application, 2016–2025
Table 50: ASEAN IOT Solutions Market for Energy Industry Market Size (US$ Mn) Forecast, by End-user Industry, 2016–2025
Table 51: ASEAN IOT Solutions Market for Energy Industry Market Size (US$ Mn) Forecast, by Solutions, 2016–2025
Table 52: ASEAN IOT Solutions Market for Energy Industry Market Size (US$ Mn) Forecast, by Application, 2016–2025
Table 53: Rest of Asia Pacific IOT Solutions Market for Energy Industry Market Size (US$ Mn) Forecast, by End-user Industry, 2016–2025
Table 54: Rest of Asia Pacific IOT Solutions Market for Energy Industry Market Size (US$ Mn) Forecast, by Solutions, 2016–2025
Table 55: Rest of Asia Pacific IOT Solutions Market for Energy Industry Market Size (US$ Mn) Forecast, by Application, 2016–2025
Table 56: Middle East & Africa IOT Solutions Market for Energy Industry Revenue (US$ Mn) Forecast, by Country/Sub-region, 2016–2025
Table 57: Middle East & Africa IOT Solutions Market for Energy Industry Market Size (US$ Mn) Forecast, by End-user Industry, 2016–2025
Table 58: Middle East & Africa IOT Solutions Market for Energy Industry Market Size (US$ Mn) Forecast, by Solutions, 2016–2025
Table 59: Middle East & Africa IOT Solutions Market for Energy Industry Market Size (US$ Mn) Forecast, by Application, 2016–2025
Table 60: GCC IOT Solutions Market for Energy Industry Market Size (US$ Mn) Forecast, by End-user Industry, 2016–2025
Table 61: GCC IOT Solutions Market for Energy Industry Market Size (US$ Mn) Forecast, by Solutions, 2016–2025
Table 62: GCC IOT Solutions Market for Energy Industry Market Size (US$ Mn) Forecast, by Application, 2016–2025
Table 63: South Africa IOT Solutions Market for Energy Industry Market Size (US$ Mn) Forecast, by End-user Industry, 2016–2025
Table 64: South Africa IOT Solutions Market for Energy Industry Market Size (US$ Mn) Forecast, by Solutions, 2016–2025
Table 65: South Africa IOT Solutions Market for Energy Industry Market Size (US$ Mn) Forecast, by Application, 2016–2025
Table 66: Rest of Middle East & Africa IOT Solutions Market for Energy Industry Market Size (US$ Mn) Forecast, by End-user Industry, 2016–2025
Table 67: Rest of Middle East & Africa IOT Solutions Market for Energy Industry Market Size (US$ Mn) Forecast, by Solutions, 2016–2025
Table 68: Rest of Middle East & Africa IOT Solutions Market for Energy Industry Market Size (US$ Mn) Forecast, by Application, 2016–2025
Table 69: Latin America IOT Solutions Market for Energy Industry Revenue (US$ Mn) Forecast, by Country/Sub-region, 2016–2025
Table 70: Latin America IOT Solutions Market for Energy Industry Market Size (US$ Mn) Forecast, by End-user Industry, 2016–2025
Table 71: Latin America IOT Solutions Market for Energy Industry Market Size (US$ Mn) Forecast, by Solutions, 2016–2025
Table 72: Latin America IOT Solutions Market for Energy Industry Market Size (US$ Mn) Forecast, by Application, 2016–2025
Table 73: Brazil IOT Solutions Market for Energy Industry Market Size (US$ Mn) Forecast, by End-user Industry, 2016–2025
Table 74: Brazil IOT Solutions Market for Energy Industry Market Size (US$ Mn) Forecast, by Solutions, 2016–2025
Table 75: Brazil IOT Solutions Market for Energy Industry Market Size (US$ Mn) Forecast, by Application, 2016–2025
Table 76: Mexico IOT Solutions Market for Energy Industry Market Size (US$ Mn) Forecast, by End-user Industry, 2016–2025
Table 77: Mexico IOT Solutions Market for Energy Industry Market Size (US$ Mn) Forecast, by Solutions, 2016–2025
Table 78: Mexico IOT Solutions Market for Energy Industry Market Size (US$ Mn) Forecast, by Application, 2016–2025
Table 79: Rest of Latin America IOT Solutions Market for Energy Industry Market Size (US$ Mn) Forecast, by End-user Industry, 2016–2025
Table 80: Rest of Latin America IOT Solutions Market for Energy Industry Market Size (US$ Mn) Forecast, by Solutions, 2016–2025
Table 81: Rest of Latin America IOT Solutions Market for Energy Industry Market Size (US$ Mn) Forecast, by Application, 2016–2025
Table 82: Competition Matrix
List of Figures
Figure 1: Global Executive Summary (1/3)
Figure 2: Executive Summary (2/3)
Figure 3: Executive Summary (3/3)
Figure 4: Regional Overview, 2016
Figure 5: Global Market Value Share %, by Top 5 Countries, 2016
Figure 6: Key Industry Developments
Figure 7: Global IOT Solutions Market for Energy Industry, Market Size (US$ bn) Forecast, 2016–2025
Figure 8: Porter’s Analysis (1/2)
Figure 10: Global IOT Solutions Market for Energy Industry: SWOT Analysis
Figure 11: Global Regulatory Scenario
Figure 12: Global IOT Systems Market for Energy Industry Market Value Share Analysis, by Region, 2016 and 2025
Figure 13: Global IOT Systems Market for Energy Industry Attractiveness Analysis, By Region
Figure 14: IOT Solutions Market for Energy Industry, by Analytic Software, ( US$ Mn), 2016-2025
Figure 15: IOT Solutions Market for Energy Industry, by Hardware Platform, ( US$ Mn), 2016-2025
Figure 16: IOT Solutions Market for Energy Industry, by Service, ( US$ Mn), 2016-2025
Figure 17: Global Executive Summary (1/3)
Figure 18: IOT Solutions Market for Energy Industry, by Connectivity, ( US$ Mn), 2016-2025
Figure 19: IOT Solutions Market for Energy Industry, Market Attractiveness Analysis, by Solutions, 2016
Figure 20: IOT Systems Market for Energy Industry, by Pipeline, ( US$ Mn), 2016-2025
Figure 21: IOT Systems Market for Energy Industry, by Refineries, ( US$ Mn), 2016-2025
Figure 22: IOT Systems Market for Energy Industry, by Grid Control, ( US$ Mn), 2016-2025
Figure 23: IOT Systems Market for Energy Industry, by Digital Oilfield, ( US$ Mn), 2016-2025
Figure 24: IOT Systems Market for Energy Industry, by Others, ( US$ Mn), 2016-2025
Figure 25: IOT Systems Market for Energy Industry, Market Attractiveness Analysis, by Application, 2016
Figure 26: IOT Solutions Market for Energy Industry, by Oil & Gas, ( US$ Mn), 2016-2025
Figure 27: IOT Solutions Market for Energy Industry, by Solar, ( US$ Mn), 2016-2025
Figure 28: IOT Solutions Market for Energy Industry, by Wind, ( US$ Mn), 2016-2025
Figure 29: IOT Solutions Market for Energy Industry, by Others, ( US$ Mn), 2016-2025
Figure 30: IOT End-user Industry Market for Energy Industry, Market Attractiveness Analysis, by End-user Industry, 2016
Figure 31: North America IOT Solutions Market for Energy Industry Size (US$ Mn) Forecast, 2016–2025
Figure 32: North America IOT Solutions Market for Energy Industry Value Share (US$ Mn) Analysis, by Country/Sub-region, 2016 and 2025
Figure 33: Europe IOT Solutions Market for Energy Industry Size (US$ Mn) Forecast, 2016–2025
Figure 34: Europe IOT Solutions Market for Energy Industry Value Share (US$ Mn) Analysis, by Country/Sub-region, 2016 and 2025
Figure 35: Asia Pacific IOT Solutions Market for Energy Industry Size (US$ Mn) Forecast, 2016–2025
Figure 36: Asia Pacific IOT Solutions Market for Energy Industry Value Share (US$ Mn) Analysis, by Country/Sub-region, 2016 and 2025
Figure 37: Middle East & Africa IOT Solutions Market for Energy Industry Size (US$ Mn) Forecast, 2016–2025
Figure 38: Middle East & Africa IOT Solutions Market for Energy Industry Value Share (US$ Mn) Analysis, by Country/Sub-region, 2016 and 2025
Figure 39: Latin America IOT Solutions Market for Energy Industry Size (US$ Mn) Forecast, 2016–2025
Figure 40: Latin America IOT Solutions Market for Energy Industry Value Share (US$ Mn) Analysis, by Country/Sub-region, 2016 and 2025
Figure 41: Global IOT Solutions Market for Energy Industry Share Analysis, by Company (2016)
Copyright © Transparency Market Research, Inc. All Rights reserved
Trust Online

IoT Solutions Market Growth Analysis 2017 - 2025