

Reports
Reports
The global intralogistics market size was valued at USD 59.7 Billion in 2025 and is projected to reach USD 153.2 Billion by 2036, expanding at a CAGR of 10.6% from 2026 to 2036. Market growth is driven by increasing demand for efficient and automated material handling, rising adoption of warehouse automation and smart logistics solutions, growing e-commerce and omnichannel fulfillment, increasing need for faster and more accurate order processing, expanding use of robotics, conveyors, sortation and automated storage systems, growing investments in digitalization and Industry 4.0 technologies, and continuous innovations in warehouse intelligence, real-time tracking, operational efficiency, and scalable material flow solutions worldwide.
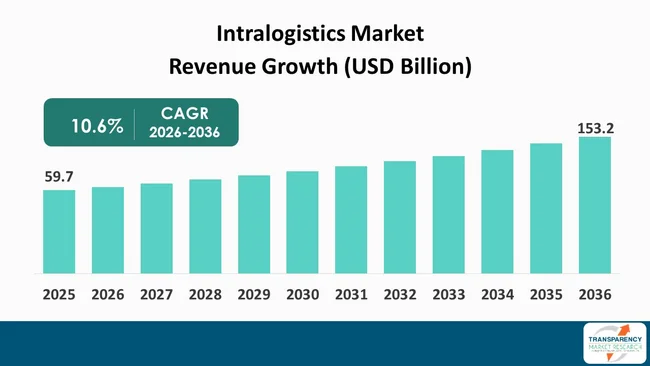
The global intralogistics market is undergoing significant transformation as companies increasingly prioritize speed, agility, resilience, and efficiency in within-facility material flows. Demand is being driven by increasing warehouse complexity, expanding fulfillment expectations, labor availability, and the necessity to run reliably. With increasing demand for storage, transportation, picking, sorting, and order fulfillment, automation is progressively being preferred. International Federation of Robotics (IFR) estimates an average of 162 industrial robots working for every 10,000 manufacturing employees worldwide in 2023, reflecting growing automation. This broader automation trend is influencing investment across material-handling equipment, robotics, storage systems, software, sensing technologies, and data-driven warehouse platforms.
As a result, automated guided vehicles, autonomous mobile robots, conveyors, sortation systems, shuttle technologies, and automated storage systems are achieving strategic significance. But the diffusion of automation technologies in end-user sectors still has a way to go, with the investment needs, facility layouts, complexity of integration, and workforce requirements varying widely across users. Manual and semi-automated systems remain relevant for applications requiring operational flexibility, lower initial investment, and adaptability to changing workflows. Digitally connected systems are increasingly essential as they enable organizations to achieve greater visibility into inventory, enhance workflows, and identify bottlenecks. The industry is undergoing a transition toward hybrid operating models, where human decisions are complemented by an ever-increasing degree of automation in movement, transport, and handling of materials.
Suppliers of technology are also turning their attention to modular solutions that can be rolled out in stages, giving companies the option to update current facilities without having to rethink the way they do business. Competitive positioning will increasingly depend on integration capability, scalability, system reliability, software intelligence, and the ability to address diverse warehouse requirements. The best opportunities are anticipated to be, since the complexity of operations and fulfillment needs warrant investments in connected material-handling infrastructure and automation.
The global intralogistics market includes the material handling and logistics solutions and services used to move, store, and process material within a manufacturing, retail, or distribution facility. It integrates receiving, storage, picking, sorting, transportation, packing, and dispatch into coordinated internal workflows. Advanced intralogistics now leverage material-handling hardware with warehouse management software, IoT sensors, robotics, controls, and data-driven operational tools. These applications enable companies to enhance material visibility, minimize unnecessary movement, maximize space utilization, and accelerate order fulfillment. The market caters to various industries such as manufacturing, retail, e-commerce, food and beverages, pharmaceuticals, automotive, and logistics service providers.
Because internal warehouse operations have a direct impact on fulfillment reliability, intralogistics is becoming a more strategic element of supply-chain operations. Conventional facilities rely heavily on manual handling, especially where there is frequent change in product assortments, workflows, or operational needs. Semiautomated systems offer a compromise, where human adaptability is augmented by mechanical or digital help. Fully automated systems can execute repetitive operations with greater consistency, throughput, traceability, and operational control. Companies are increasingly adopting automation selectively based on specific facility requirements rather than pursuing full automation across all processes.
The market is also being driven by software, as companies desire unified views on their equipment, inventory, orders, and workflows. Warehouse execution systems and connected control systems are also becoming more unified across various technology types in complex system environments. This integration allows for more efficient use of resources and for organizations to detect bottlenecks and adjust to dynamic operational environments. Intralogistics thus transcends single types of equipment and is more and more an integrated physical-digital technology ecosystem. Future market growth will be influenced by the ability to scale, the need for the workforce to develop new skills, the economics of investment, and how well new technologies can be integrated.
| Attribute | Detail |
|---|---|
| Market Drivers |
|
The global trend toward higher e-commerce and omnichannel retail is driving the demand for efficient intralogistics infrastructure. Consumers expect faster deliveries, more accurate orders, more flexible fulfillment options, and a consistent experience when purchasing through different channels. As a result, warehouses are being pushed to optimize their internal materials-handling and fulfillment processes. According to UN Trade and Development (UNCTAD), e-commerce sales to businesses in 2024, across 45 economies, totaled USD 28 trillion, a 4.4% increase from 2023. The increase in digital-first sales is resulting in higher order volumes and more complex fulfillment, leading to increased demand for automated storage, picking, sorting, and material-handling systems within intralogistics.
Omnichannel fulfillment requires warehouse operations to synchronize inventory across physical stores, distribution centers, and direct-to-consumer channels. This adds another layer of complexity to already complex processes for picking, packing, sorting, storage, replenishment, and order routing. When order volumes change, or product assortments expand, the traditional manual workflows become increasingly difficult to manage efficiently. As a result, companies are investing in conveyors, automated storage systems, sortation technologies, warehouse software, and autonomous mobile solutions. These approaches facilitate material flow coordination and improve inventory visibility and order fulfillment responsiveness.
E-commerce is also driving companies to redesign warehouses for speed, flexibility, and scalability. Facilities are increasingly demanding systems that can handle changing patterns of demand without substantial interruptions to operations. Modular intralogistics solutions also make it possible to automate certain process steps and keep humans involved in flexibility-critical areas. Software integration also allows organizations to manage equipment, inventory, orders, and labor through integrated platforms. This presents opportunities for technology providers to deliver integrated hardware, software, controls, and warehouse execution solutions.
Supply chain resilience across global industries is fueling the increasing demand for high-performance intralogistics solutions. Companies are now prioritizing continuity of operations when disruption interferes with their transportation, sourcing, inventory availability, or production schedules. These challenges have led many companies to reconsider their warehouse strategies and gain more control over material flows within their facilities. Robust intralogistics systems can also enable companies to improve inventory visibility, streamline material flows, and accelerate their response to operational disruptions. The World Bank draws attention to resilient supply chains as a factor in sustaining trade and economic activity. Advanced intralogistics systems can strengthen resilience by integrating warehouse equipment, inventory management, software, and operational workflows into a coordinated network.
Automated storage and retrieval systems can help to improve inventory organization and reduce reliance on manual material movement. Conveyors, sortation systems, mobile robots, and warehouse software can also help to improve coordination of internal logistics processes. This allows facilities to redirect workflows and resource allocation based on evolving operational needs. Increased operational visibility also helps businesses to identify bottlenecks and respond more quickly when disruptions occur.
Supply chain resilience is also pushing companies to diversify sourcing and to build more regional distribution capabilities. This trend can lead to a rise in the importance of strategically located warehouses and flexible fulfillment centers. These types of centers need flexible intralogistics systems that can handle varying inventory volumes and product flows. Modular automation offers a solution, as businesses can scale up capabilities as operational needs change. Software integration also helps companies coordinate equipment and workflows in increasingly decentralized warehouse networks.
The growing adoption of digitally integrated and modular fulfillment systems is creating significant opportunities in the global intralogistics market. As e-commerce and omnichannel operations expand, warehouses are under increasing pressure to process orders faster while maintaining inventory accuracy, operational visibility, and fulfillment reliability. This is driving demand for technologies that connect receiving, storage, picking, sorting, packing, and dispatch activities within coordinated warehouse workflows.
Opportunities are emerging across warehouse execution software, automated storage and retrieval systems, mobile robots, conveyors, sortation equipment, and intelligent picking technologies. Integration of these systems with sensors, cloud platforms, operational data, and artificial intelligence can further improve workload allocation, inventory visibility, predictive maintenance, equipment utilization, and responsiveness to changing order patterns.
A particularly important opportunity lies in incremental automation. Many facilities seek to improve productivity without completely replacing existing infrastructure. Modular intralogistics solutions allow organizations to automate selected processes in phases while retaining existing equipment and human capabilities. This approach can reduce implementation complexity and enable companies to align automation investments with operational priorities, facility constraints, and available budgets.
Technology providers can also strengthen their market position by offering scalable solutions tailored to different warehouse sizes, product characteristics, throughput requirements, and automation levels. Beyond equipment sales, system integration, software upgrades, maintenance, analytics, remote monitoring, and lifecycle optimization can create recurring service opportunities.
The shift toward digitally connected, scalable, and modular warehouse systems is expected to support continued investment in intralogistics technologies. Companies that combine automation hardware with software intelligence, integration capabilities, and flexible deployment models are well positioned to address the evolving requirements of modern fulfillment operations.
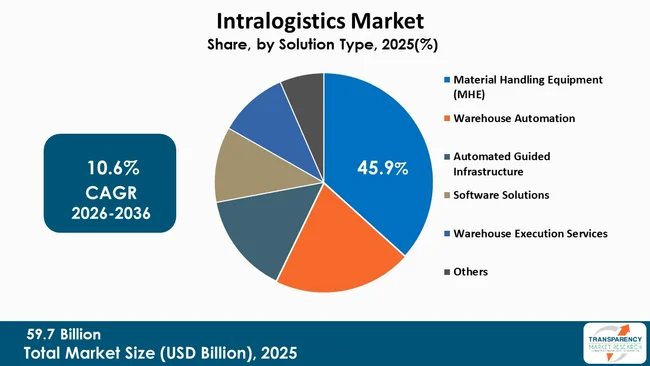
Material Handling Equipment (MHE) accounted for 45.9% of the global intralogistics market in 2025, making it the dominant solution type. MHE includes conveyors, forklifts, reach and pallet trucks, sorters, shuttle systems, palletizers/depalletizers, lift tables, and other equipment used to move, store, position, and handle materials across warehouses, distribution centers, manufacturing facilities, and fulfillment operations.
The segment’s dominance was primarily supported by the broad applicability of physical material movement equipment across virtually every stage of warehouse operations. Conveyors facilitate continuous movement between receiving, storage, picking, packing, and dispatch areas, while forklifts and pallet trucks support horizontal and vertical movement of palletized goods. Sorters and shuttle systems further improve throughput in facilities handling high volumes of orders. This broad equipment base gives MHE a larger deployment footprint than individual automation or software categories.
The continued expansion of warehousing, e-commerce fulfillment, manufacturing, and distribution infrastructure also increased requirements for reliable material movement. The U.S. Occupational Safety and Health Administration identifies powered industrial trucks as important equipment for moving, lifting, lowering, and positioning materials in workplaces, illustrating the fundamental role of mechanical handling equipment in industrial operations.
MHE also serves as the physical foundation for higher levels of warehouse automation. Automated storage and retrieval systems, AMRs, AGVs, robotics, and warehouse-control software frequently operate alongside conveyors, pallet-handling systems, lifts, and other mechanical equipment rather than replacing the entire MHE infrastructure. Consequently, investments in automation can generate additional demand for compatible material-handling equipment.
Therefore, the combination of wide application coverage, large installed equipment base, essential material-movement functions, and integration with automated warehouse technologies supported material handling equipment as the leading solution type, with a 45.9% share of the global intralogistics market in 2025.
| Attribute | Detail |
|---|---|
| Leading Region |
|
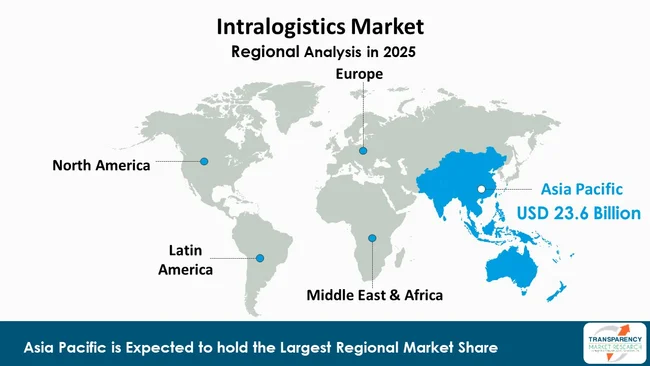
Asia Pacific dominated the global intralogistics market in 2025, accounting for approximately 39.6% of total market revenue, owing to its large-scale manufacturing base and growing distribution networks, along with significant investment on the development of warehouse infrastructure in the region. Asia Pacific has a strong manufacturing base across automotive, electronics, consumer goods, pharmaceuticals, and industrial products, creating sustained demand for internal material movement, storage, picking, sorting, and warehouse management systems.
Stronger engagement in global value chains also motivates manufacturers and logistics services providers to upgrade warehouse practices to increase inventory visibility and the reliability of internal supply chains. Infrastructure development, digitalization and supply-chain resilience are among regional priorities that are now further enabling the uptake of sophisticated intralogistics technologies. That spurs demand for connected tools and more sophisticated warehouse management software as well as robotics, automated storage and retrieval systems, and intelligent control solutions.
The fast-growing e-commerce market in the region also acts as a motivating factor for growth. Growing order volumes, broader product assortments, and faster fulfillment requirements are increasing the need for flexible and scalable warehouse operations. In light of this, companies are turning to modular automation systems that are able to work with existing facilities and, in some cases, gradually ramp up the level of automation. Overall, resting on continuous manufacturing expansion, e-commerce growth, supply-chain modernization, and warehouse automation, the demand for sophisticated intralogistics solutions is anticipated to increase further, supporting Asia Pacific’s leading position in the global market.
AutoStore AS, BEUMER Group GmbH & Co. KG, Cassioli Group, E80 Group S.p.A., Exotec, Ferag Solutions AG, Fives Group, GEBHARDT Intralogistics Group, Interroll Holding AG, Jungheinrich AG, Kardex Holding AG, KNAPP AG, LTW Intralogistics GmbH, Mecalux, S.A., SAVOYE, SSI SCHAEFER Group, stow Group, TGW Logistics Group GmbH, Vanderlande Industries B.V., and WITRON Logistik + Informatik GmbH are among the prominent companies operating in the global intralogistics market.
Each of these companies has been profiled in the global Intralogistics industry report based on parameters such as company overview, business strategies, financial overview, business segments, product portfolio, and recent developments.
| Attribute | Detail |
|---|---|
| Market Size Value in 2025 (Base Year) | USD 59.7 Billion |
| Market Forecast Value in 2036 | USD 153.2 Billion |
| Growth Rate (CAGR 2026 to 2036) | 10.6% |
| Forecast Period | 2026-2036 |
| Historical data Available for | 2021-2025 |
| Quantitative Units | Value for Value and Volume for Volume |
| Market Analysis | Global qualitative analysis includes drivers, restraints, opportunities, key trends, key market indicators, Porter’s Five Forces analysis, value chain analysis, SWOT analysis, etc. Furthermore, at the regional level, qualitative analysis includes key trends, price trends, and key supplier analysis. |
| Competition Landscape |
|
| Format | Electronic (PDF) + Excel |
| Market Segmentation | Solution Type
|
| Regions Covered |
|
| Countries Covered |
|
| Companies Profiled |
|
| Customization Scope | Available upon request |
| Pricing | Available upon request |
The global intralogistics market was valued at USD 59.7 Billion in 2025.
The global intralogistics industry is projected to reach USD 153.2 Billion by 2036.
Key drivers include the rapid growth of e-commerce & Omni channel fulfillment and increasing supply chain resilience requirements.
The global intralogistics market is anticipated to expand at a CAGR of 10.6% from 2026 to 2036.
The material handling equipment segment accounted for the largest share of the global intralogistics market in 2025, representing approximately 45.9% of total market revenue.
Asia Pacific dominated the global intralogistics market in 2025, accounting for approximately 39.6% of total market revenue.
AutoStore AS, BEUMER Group GmbH & Co. KG, Cassioli Group, E80 Group S.p.A., Exotec, Ferag Solutions AG, Fives Group, GEBHARDT Intralogistics Group, Interroll Holding AG, Jungheinrich AG, Kardex Holding AG, KNAPP AG, LTW Intralogistics GmbH, Mecalux, S.A., SAVOYE, SSI SCHAEFER Group, stow Group, TGW Logistics Group GmbH, Vanderlande Industries B.V., and WITRON Logistik + Informatik GmbH are among the prominent players operating in the global intralogistics market.
Table 01: Global Intralogistics Market Value (Value) Projection, By Solution Type 2021 to 2036
Table 02: Global Intralogistics Market Volume (Volume) Projection, By Solution Type 2021 to 2036
Table 03: Global Intralogistics Market Value (Value) Projection, By Equipment Automation 2021 to 2036
Table 04: Global Intralogistics Market Volume (Volume) Projection, By Equipment Automation 2021 to 2036
Table 05: Global Intralogistics Market Value (Value) Projection, By Function/Application 2021 to 2036
Table 06: Global Intralogistics Market Volume (Volume) Projection, By Function/Application 2021 to 2036
Table 07: Global Intralogistics Market Value (Value) Projection, By End-use Industry 2021 to 2036
Table 08: Global Intralogistics Market Volume (Volume) Projection, By End-use Industry 2021 to 2036
Table 09: Global Intralogistics Market Value (Value) Projection, By Region 2021 to 2036
Table 10: Global Intralogistics Market Volume (Volume) Projection, By Region 2021 to 2036
Table 11: North America Intralogistics Market Value (Value) Projection, By Solution Type 2021 to 2036
Table 12: North America Intralogistics Market Volume (Volume) Projection, By Solution Type 2021 to 2036
Table 13: North America Intralogistics Market Value (Value) Projection, By Equipment Automation 2021 to 2036
Table 14: North America Intralogistics Market Volume (Volume) Projection, By Equipment Automation 2021 to 2036
Table 15: North America Intralogistics Market Value (Value) Projection, By Function/Application 2021 to 2036
Table 16: North America Intralogistics Market Volume (Volume) Projection, By Function/Application 2021 to 2036
Table 17: North America Intralogistics Market Value (Value) Projection, By End-use Industry 2021 to 2036
Table 18: North America Intralogistics Market Volume (Volume) Projection, By End-use Industry 2021 to 2036
Table 19: North America Intralogistics Market Value (Value) Projection, By Country 2021 to 2036
Table 20: North America Intralogistics Market Volume (Volume) Projection, By Country 2021 to 2036
Table 21: U.S. Intralogistics Market Value (Value) Projection, By Solution Type 2021 to 2036
Table 22: U.S. Intralogistics Market Volume (Volume) Projection, By Solution Type 2021 to 2036
Table 23: U.S. Intralogistics Market Value (Value) Projection, By Equipment Automation 2021 to 2036
Table 24: U.S. Intralogistics Market Volume (Volume) Projection, By Equipment Automation 2021 to 2036
Table 25: U.S. Intralogistics Market Value (Value) Projection, By Function/Application 2021 to 2036
Table 26: U.S. Intralogistics Market Volume (Volume) Projection, By Function/Application 2021 to 2036
Table 27: U.S. Intralogistics Market Value (Value) Projection, By End-use Industry 2021 to 2036
Table 28: U.S. Intralogistics Market Volume (Volume) Projection, By End-use Industry 2021 to 2036
Table 29: Canada Intralogistics Market Value (Value) Projection, By Solution Type 2021 to 2036
Table 30: Canada Intralogistics Market Volume (Volume) Projection, By Solution Type 2021 to 2036
Table 31: Canada Intralogistics Market Value (Value) Projection, By Equipment Automation 2021 to 2036
Table 32: Canada Intralogistics Market Volume (Volume) Projection, By Equipment Automation 2021 to 2036
Table 33: Canada Intralogistics Market Value (Value) Projection, By Function/Application 2021 to 2036
Table 34: Canada Intralogistics Market Volume (Volume) Projection, By Function/Application 2021 to 2036
Table 35: Canada Intralogistics Market Value (Value) Projection, By End-use Industry 2021 to 2036
Table 36: Canada Intralogistics Market Volume (Volume) Projection, By End-use Industry 2021 to 2036
Table 37: Europe Intralogistics Market Value (Value) Projection, By Solution Type 2021 to 2036
Table 38: Europe Intralogistics Market Volume (Volume) Projection, By Solution Type 2021 to 2036
Table 39: Europe Intralogistics Market Value (Value) Projection, By Equipment Automation 2021 to 2036
Table 40: Europe Intralogistics Market Volume (Volume) Projection, By Equipment Automation 2021 to 2036
Table 41: Europe Intralogistics Market Value (Value) Projection, By Function/Application 2021 to 2036
Table 42: Europe Intralogistics Market Volume (Volume) Projection, By Function/Application 2021 to 2036
Table 43: Europe Intralogistics Market Value (Value) Projection, By End-use Industry 2021 to 2036
Table 44: Europe Intralogistics Market Volume (Volume) Projection, By End-use Industry 2021 to 2036
Table 45: Europe Intralogistics Market Value (Value) Projection, By Country 2021 to 2036
Table 46: Europe Intralogistics Market Volume (Volume) Projection, By Country 2021 to 2036
Table 47: U.K. Intralogistics Market Value (Value) Projection, By Solution Type 2021 to 2036
Table 48: U.K. Intralogistics Market Volume (Volume) Projection, By Solution Type 2021 to 2036
Table 49: U.K. Intralogistics Market Value (Value) Projection, By Equipment Automation 2021 to 2036
Table 50: U.K. Intralogistics Market Volume (Volume) Projection, By Equipment Automation 2021 to 2036
Table 51: U.K. Intralogistics Market Value (Value) Projection, By Function/Application 2021 to 2036
Table 52: U.K. Intralogistics Market Volume (Volume) Projection, By Function/Application 2021 to 2036
Table 53: U.K. Intralogistics Market Value (Value) Projection, By End-use Industry 2021 to 2036
Table 54: U.K. Intralogistics Market Volume (Volume) Projection, By End-use Industry 2021 to 2036
Table 55: Germany Intralogistics Market Value (Value) Projection, By Solution Type 2021 to 2036
Table 56: Germany Intralogistics Market Volume (Volume) Projection, By Solution Type 2021 to 2036
Table 57: Germany Intralogistics Market Value (Value) Projection, By Equipment Automation 2021 to 2036
Table 58: Germany Intralogistics Market Volume (Volume) Projection, By Equipment Automation 2021 to 2036
Table 59: Germany Intralogistics Market Value (Value) Projection, By Function/Application 2021 to 2036
Table 60: Germany Intralogistics Market Volume (Volume) Projection, By Function/Application 2021 to 2036
Table 61: Germany Intralogistics Market Value (Value) Projection, By End-use Industry 2021 to 2036
Table 62: Germany Intralogistics Market Volume (Volume) Projection, By End-use Industry 2021 to 2036
Table 63: France Intralogistics Market Value (Value) Projection, By Solution Type 2021 to 2036
Table 64: France Intralogistics Market Volume (Volume) Projection, By Solution Type 2021 to 2036
Table 65: France Intralogistics Market Value (Value) Projection, By Equipment Automation 2021 to 2036
Table 66: France Intralogistics Market Volume (Volume) Projection, By Equipment Automation 2021 to 2036
Table 67: France Intralogistics Market Value (Value) Projection, By Function/Application 2021 to 2036
Table 68: France Intralogistics Market Volume (Volume) Projection, By Function/Application 2021 to 2036
Table 69: France Intralogistics Market Value (Value) Projection, By End-use Industry 2021 to 2036
Table 70: France Intralogistics Market Volume (Volume) Projection, By End-use Industry 2021 to 2036
Table 71: Italy Intralogistics Market Value (Value) Projection, By Solution Type 2021 to 2036
Table 72: Italy Intralogistics Market Volume (Volume) Projection, By Solution Type 2021 to 2036
Table 73: Italy Intralogistics Market Value (Value) Projection, By Equipment Automation 2021 to 2036
Table 74: Italy Intralogistics Market Volume (Volume) Projection, By Equipment Automation 2021 to 2036
Table 75: Italy Intralogistics Market Value (Value) Projection, By Function/Application 2021 to 2036
Table 76: Italy Intralogistics Market Volume (Volume) Projection, By Function/Application 2021 to 2036
Table 77: Italy Intralogistics Market Value (Value) Projection, By End-use Industry 2021 to 2036
Table 78: Italy Intralogistics Market Volume (Volume) Projection, By End-use Industry 2021 to 2036
Table 79: Spain Intralogistics Market Value (Value) Projection, By Solution Type 2021 to 2036
Table 80: Spain Intralogistics Market Volume (Volume) Projection, By Solution Type 2021 to 2036
Table 81: Spain Intralogistics Market Value (Value) Projection, By Equipment Automation 2021 to 2036
Table 82: Spain Intralogistics Market Volume (Volume) Projection, By Equipment Automation 2021 to 2036
Table 83: Spain Intralogistics Market Value (Value) Projection, By Function/Application 2021 to 2036
Table 84: Spain Intralogistics Market Volume (Volume) Projection, By Function/Application 2021 to 2036
Table 85: Spain Intralogistics Market Value (Value) Projection, By End-use Industry 2021 to 2036
Table 86: Spain Intralogistics Market Volume (Volume) Projection, By End-use Industry 2021 to 2036
Table 87: The Netherlands Intralogistics Market Value (Value) Projection, By Solution Type 2021 to 2036
Table 88: The Netherlands Intralogistics Market Volume (Volume) Projection, By Solution Type 2021 to 2036
Table 89: The Netherlands Intralogistics Market Value (Value) Projection, By Equipment Automation 2021 to 2036
Table 90: The Netherlands Intralogistics Market Volume (Volume) Projection, By Equipment Automation 2021 to 2036
Table 91: The Netherlands Intralogistics Market Value (Value) Projection, By Function/Application 2021 to 2036
Table 92: The Netherlands Intralogistics Market Volume (Volume) Projection, By Function/Application 2021 to 2036
Table 93: The Netherlands Intralogistics Market Value (Value) Projection, By End-use Industry 2021 to 2036
Table 94: The Netherlands Intralogistics Market Volume (Volume) Projection, By End-use Industry 2021 to 2036
Table 95: Asia Pacific Intralogistics Market Value (Value) Projection, By Solution Type 2021 to 2036
Table 96: Asia Pacific Intralogistics Market Volume (Volume) Projection, By Solution Type 2021 to 2036
Table 97: Asia Pacific Intralogistics Market Value (Value) Projection, By Equipment Automation 2021 to 2036
Table 98: Asia Pacific Intralogistics Market Volume (Volume) Projection, By Equipment Automation 2021 to 2036
Table 99: Asia Pacific Intralogistics Market Value (Value) Projection, By Function/Application 2021 to 2036
Table 100: Asia Pacific Intralogistics Market Volume (Volume) Projection, By Function/Application 2021 to 2036
Table 101: Asia Pacific Intralogistics Market Value (Value) Projection, By End-use Industry 2021 to 2036
Table 102: Asia Pacific Intralogistics Market Volume (Volume) Projection, By End-use Industry 2021 to 2036
Table 103: Asia Pacific Intralogistics Market Value (Value) Projection, By Country 2021 to 2036
Table 104: Asia Pacific Intralogistics Market Volume (Volume) Projection, By Country 2021 to 2036
Table 105: China Intralogistics Market Value (Value) Projection, By Solution Type 2021 to 2036
Table 106: China Intralogistics Market Volume (Volume) Projection, By Solution Type 2021 to 2036
Table 107: China Intralogistics Market Value (Value) Projection, By Equipment Automation 2021 to 2036
Table 108: China Intralogistics Market Volume (Volume) Projection, By Equipment Automation 2021 to 2036
Table 109: China Intralogistics Market Value (Value) Projection, By Function/Application 2021 to 2036
Table 110: China Intralogistics Market Volume (Volume) Projection, By Function/Application 2021 to 2036
Table 111: China Intralogistics Market Value (Value) Projection, By End-use Industry 2021 to 2036
Table 112: China Intralogistics Market Volume (Volume) Projection, By End-use Industry 2021 to 2036
Table 113: India Intralogistics Market Value (Value) Projection, By Solution Type 2021 to 2036
Table 114: India Intralogistics Market Volume (Volume) Projection, By Solution Type 2021 to 2036
Table 115: India Intralogistics Market Value (Value) Projection, By Equipment Automation 2021 to 2036
Table 116: India Intralogistics Market Volume (Volume) Projection, By Equipment Automation 2021 to 2036
Table 117: India Intralogistics Market Value (Value) Projection, By Function/Application 2021 to 2036
Table 118: India Intralogistics Market Volume (Volume) Projection, By Function/Application 2021 to 2036
Table 119: India Intralogistics Market Value (Value) Projection, By End-use Industry 2021 to 2036
Table 120: India Intralogistics Market Volume (Volume) Projection, By End-use Industry 2021 to 2036
Table 121: Japan Intralogistics Market Value (Value) Projection, By Solution Type 2021 to 2036
Table 122: Japan Intralogistics Market Volume (Volume) Projection, By Solution Type 2021 to 2036
Table 123: Japan Intralogistics Market Value (Value) Projection, By Equipment Automation 2021 to 2036
Table 124: Japan Intralogistics Market Volume (Volume) Projection, By Equipment Automation 2021 to 2036
Table 125: Japan Intralogistics Market Value (Value) Projection, By Function/Application 2021 to 2036
Table 126: Japan Intralogistics Market Volume (Volume) Projection, By Function/Application 2021 to 2036
Table 127: Japan Intralogistics Market Value (Value) Projection, By End-use Industry 2021 to 2036
Table 128: Japan Intralogistics Market Volume (Volume) Projection, By End-use Industry 2021 to 2036
Table 129: Australia Intralogistics Market Value (Value) Projection, By Solution Type 2021 to 2036
Table 130: Australia Intralogistics Market Volume (Volume) Projection, By Solution Type 2021 to 2036
Table 131: Australia Intralogistics Market Value (Value) Projection, By Equipment Automation 2021 to 2036
Table 132: Australia Intralogistics Market Volume (Volume) Projection, By Equipment Automation 2021 to 2036
Table 133: Australia Intralogistics Market Value (Value) Projection, By Function/Application 2021 to 2036
Table 134: Australia Intralogistics Market Volume (Volume) Projection, By Function/Application 2021 to 2036
Table 135: Australia Intralogistics Market Value (Value) Projection, By End-use Industry 2021 to 2036
Table 136: Australia Intralogistics Market Volume (Volume) Projection, By End-use Industry 2021 to 2036
Table 137: South Korea Intralogistics Market Value (Value) Projection, By Solution Type 2021 to 2036
Table 138: South Korea Intralogistics Market Volume (Volume) Projection, By Solution Type 2021 to 2036
Table 139: South Korea Intralogistics Market Value (Value) Projection, By Equipment Automation 2021 to 2036
Table 140: South Korea Intralogistics Market Volume (Volume) Projection, By Equipment Automation 2021 to 2036
Table 141: South Korea Intralogistics Market Value (Value) Projection, By Function/Application 2021 to 2036
Table 142: South Korea Intralogistics Market Volume (Volume) Projection, By Function/Application 2021 to 2036
Table 143: South Korea Intralogistics Market Value (Value) Projection, By End-use Industry 2021 to 2036
Table 144: South Korea Intralogistics Market Volume (Volume) Projection, By End-use Industry 2021 to 2036
Table 145: ASEAN Intralogistics Market Value (Value) Projection, By Solution Type 2021 to 2036
Table 146: ASEAN Intralogistics Market Volume (Volume) Projection, By Solution Type 2021 to 2036
Table 147: ASEAN Intralogistics Market Value (Value) Projection, By Equipment Automation 2021 to 2036
Table 148: ASEAN Intralogistics Market Volume (Volume) Projection, By Equipment Automation 2021 to 2036
Table 149: ASEAN Intralogistics Market Value (Value) Projection, By Function/Application 2021 to 2036
Table 150: ASEAN Intralogistics Market Volume (Volume) Projection, By Function/Application 2021 to 2036
Table 151: ASEAN Intralogistics Market Value (Value) Projection, By End-use Industry 2021 to 2036
Table 152: ASEAN Intralogistics Market Volume (Volume) Projection, By End-use Industry 2021 to 2036
Table 153: Middle East & Africa Intralogistics Market Value (Value) Projection, By Solution Type 2021 to 2036
Table 154: Middle East & Africa Intralogistics Market Volume (Volume) Projection, By Solution Type 2021 to 2036
Table 155: Middle East & Africa Intralogistics Market Value (Value) Projection, By Equipment Automation 2021 to 2036
Table 156: Middle East & Africa Intralogistics Market Volume (Volume) Projection, By Equipment Automation 2021 to 2036
Table 157: Middle East & Africa Intralogistics Market Value (Value) Projection, By Function/Application 2021 to 2036
Table 158: Middle East & Africa Intralogistics Market Volume (Volume) Projection, By Function/Application 2021 to 2036
Table 159: Middle East & Africa Intralogistics Market Value (Value) Projection, By End-use Industry 2021 to 2036
Table 160: Middle East & Africa Intralogistics Market Volume (Volume) Projection, By End-use Industry 2021 to 2036
Table 161: Middle East & Africa Intralogistics Market Value (Value) Projection, By Country 2021 to 2036
Table 162: Middle East & Africa Intralogistics Market Volume (Volume) Projection, By Country 2021 to 2036
Table 163: GCC Countries Intralogistics Market Value (Value) Projection, By Solution Type 2021 to 2036
Table 164: GCC Countries Intralogistics Market Volume (Volume) Projection, By Solution Type 2021 to 2036
Table 165: GCC Countries Intralogistics Market Value (Value) Projection, By Equipment Automation 2021 to 2036
Table 166: GCC Countries Intralogistics Market Volume (Volume) Projection, By Equipment Automation 2021 to 2036
Table 167: GCC Countries Intralogistics Market Value (Value) Projection, By Function/Application 2021 to 2036
Table 168: GCC Countries Intralogistics Market Volume (Volume) Projection, By Function/Application 2021 to 2036
Table 169: GCC Countries Intralogistics Market Value (Value) Projection, By End-use Industry 2021 to 2036
Table 170: GCC Countries Intralogistics Market Volume (Volume) Projection, By End-use Industry 2021 to 2036
Table 171: South Africa Intralogistics Market Value (Value) Projection, By Solution Type 2021 to 2036
Table 172: South Africa Intralogistics Market Volume (Volume) Projection, By Solution Type 2021 to 2036
Table 173: South Africa Intralogistics Market Value (Value) Projection, By Equipment Automation 2021 to 2036
Table 174: South Africa Intralogistics Market Volume (Volume) Projection, By Equipment Automation 2021 to 2036
Table 175: South Africa Intralogistics Market Value (Value) Projection, By Function/Application 2021 to 2036
Table 176: South Africa Intralogistics Market Volume (Volume) Projection, By Function/Application 2021 to 2036
Table 177: South Africa Intralogistics Market Value (Value) Projection, By End-use Industry 2021 to 2036
Table 178: South Africa Intralogistics Market Volume (Volume) Projection, By End-use Industry 2021 to 2036
Table 179: Latin America Intralogistics Market Value (Value) Projection, By Solution Type 2021 to 2036
Table 180: Latin America Intralogistics Market Volume (Volume) Projection, By Solution Type 2021 to 2036
Table 181: Latin America Intralogistics Market Value (Value) Projection, By Equipment Automation 2021 to 2036
Table 182: Latin America Intralogistics Market Volume (Volume) Projection, By Equipment Automation 2021 to 2036
Table 183: Latin America Intralogistics Market Value (Value) Projection, By Function/Application 2021 to 2036
Table 184: Latin America Intralogistics Market Volume (Volume) Projection, By Function/Application 2021 to 2036
Table 185: Latin America Intralogistics Market Value (Value) Projection, By End-use Industry 2021 to 2036
Table 186: Latin America Intralogistics Market Volume (Volume) Projection, By End-use Industry 2021 to 2036
Table 187: Latin America Intralogistics Market Value (Value) Projection, By Country 2021 to 2036
Table 188: Latin America Intralogistics Market Volume (Volume) Projection, By Country 2021 to 2036
Table 189: Brazil Intralogistics Market Value (Value) Projection, By Solution Type 2021 to 2036
Table 190: Brazil Intralogistics Market Volume (Volume) Projection, By Solution Type 2021 to 2036
Table 191: Brazil Intralogistics Market Value (Value) Projection, By Equipment Automation 2021 to 2036
Table 192: Brazil Intralogistics Market Volume (Volume) Projection, By Equipment Automation 2021 to 2036
Table 193: Brazil Intralogistics Market Value (Value) Projection, By Function/Application 2021 to 2036
Table 194: Brazil Intralogistics Market Volume (Volume) Projection, By Function/Application 2021 to 2036
Table 195: Brazil Intralogistics Market Value (Value) Projection, By End-use Industry 2021 to 2036
Table 196: Brazil Intralogistics Market Volume (Volume) Projection, By End-use Industry 2021 to 2036
Table 197: Mexico Intralogistics Market Value (Value) Projection, By Solution Type 2021 to 2036
Table 198: Mexico Intralogistics Market Volume (Volume) Projection, By Solution Type 2021 to 2036
Table 199: Mexico Intralogistics Market Value (Value) Projection, By Equipment Automation 2021 to 2036
Table 200: Mexico Intralogistics Market Volume (Volume) Projection, By Equipment Automation 2021 to 2036
Table 201: Mexico Intralogistics Market Value (Value) Projection, By Function/Application 2021 to 2036
Table 202: Mexico Intralogistics Market Volume (Volume) Projection, By Function/Application 2021 to 2036
Table 203: Mexico Intralogistics Market Value (Value) Projection, By End-use Industry 2021 to 2036
Table 204: Mexico Intralogistics Market Volume (Volume) Projection, By End-use Industry 2021 to 2036
Table 205: Argentina Intralogistics Market Value (Value) Projection, By Solution Type 2021 to 2036
Table 206: Argentina Intralogistics Market Volume (Volume) Projection, By Solution Type 2021 to 2036
Table 207: Argentina Intralogistics Market Value (Value) Projection, By Equipment Automation 2021 to 2036
Table 208: Argentina Intralogistics Market Volume (Volume) Projection, By Equipment Automation 2021 to 2036
Table 209: Argentina Intralogistics Market Value (Value) Projection, By Function/Application 2021 to 2036
Table 210: Argentina Intralogistics Market Volume (Volume) Projection, By Function/Application 2021 to 2036
Table 211: Argentina Intralogistics Market Value (Value) Projection, By End-use Industry 2021 to 2036
Table 212: Argentina Intralogistics Market Volume (Volume) Projection, By End-use Industry 2021 to 2036
Figure 01: Global Intralogistics Market Value (Value) Projection, By Solution Type 2021 to 2036
Figure 02: Global Intralogistics Market Volume (Volume) Projection, By Solution Type 2021 to 2036
Figure 03: Global Intralogistics Market Incremental Opportunities (Value) Forecast, By Solution Type 2026 to 2036
Figure 04: Global Intralogistics Market Value (Value) Projection, By Equipment Automation 2021 to 2036
Figure 05: Global Intralogistics Market Volume (Volume) Projection, By Equipment Automation 2021 to 2036
Figure 06: Global Intralogistics Market Incremental Opportunities (Value) Forecast, By Equipment Automation 2026 to 2036
Figure 07: Global Intralogistics Market Value (Value) Projection, By Function/Application 2021 to 2036
Figure 08: Global Intralogistics Market Volume (Volume) Projection, By Function/Application 2021 to 2036
Figure 09: Global Intralogistics Market Incremental Opportunities (Value) Forecast, By Function/Application 2026 to 2036
Figure 10: Global Intralogistics Market Value (Value) Projection, By End-use Industry 2021 to 2036
Figure 11: Global Intralogistics Market Volume (Volume) Projection, By End-use Industry 2021 to 2036
Figure 12: Global Intralogistics Market Incremental Opportunities (Value) Forecast, By End-use Industry 2026 to 2036
Figure 13: Global Intralogistics Market Value (Value) Projection, By Region 2021 to 2036
Figure 14: Global Intralogistics Market Volume (Volume) Projection, By Region 2021 to 2036
Figure 15: Global Intralogistics Market Incremental Opportunities (Value) Forecast, By Region 2026 to 2036
Figure 16: North America Intralogistics Market Value (Value) Projection, By Solution Type 2021 to 2036
Figure 17: North America Intralogistics Market Volume (Volume) Projection, By Solution Type 2021 to 2036
Figure 18: North America Intralogistics Market Incremental Opportunities (Value) Forecast, By Solution Type 2026 to 2036
Figure 19: North America Intralogistics Market Value (Value) Projection, By Equipment Automation 2021 to 2036
Figure 20: North America Intralogistics Market Volume (Volume) Projection, By Equipment Automation 2021 to 2036
Figure 21: North America Intralogistics Market Incremental Opportunities (Value) Forecast, By Equipment Automation 2026 to 2036
Figure 22: North America Intralogistics Market Value (Value) Projection, By Function/Application 2021 to 2036
Figure 23: North America Intralogistics Market Volume (Volume) Projection, By Function/Application 2021 to 2036
Figure 24: North America Intralogistics Market Incremental Opportunities (Value) Forecast, By Function/Application 2026 to 2036
Figure 25: North America Intralogistics Market Value (Value) Projection, By End-use Industry 2021 to 2036
Figure 26: North America Intralogistics Market Volume (Volume) Projection, By End-use Industry 2021 to 2036
Figure 27: North America Intralogistics Market Incremental Opportunities (Value) Forecast, By End-use Industry 2026 to 2036
Figure 28: North America Intralogistics Market Value (Value) Projection, By Country 2021 to 2036
Figure 29: North America Intralogistics Market Volume (Volume) Projection, By Country 2021 to 2036
Figure 30: North America Intralogistics Market Incremental Opportunities (Value) Forecast, By Country 2026 to 2036
Figure 31: U.S. Intralogistics Market Value (Value) Projection, By Solution Type 2021 to 2036
Figure 32: U.S. Intralogistics Market Volume (Volume) Projection, By Solution Type 2021 to 2036
Figure 33: U.S. Intralogistics Market Incremental Opportunities (Value) Forecast, By Solution Type 2026 to 2036
Figure 34: U.S. Intralogistics Market Value (Value) Projection, By Equipment Automation 2021 to 2036
Figure 35: U.S. Intralogistics Market Volume (Volume) Projection, By Equipment Automation 2021 to 2036
Figure 36: U.S. Intralogistics Market Incremental Opportunities (Value) Forecast, By Equipment Automation 2026 to 2036
Figure 37: U.S. Intralogistics Market Value (Value) Projection, By Function/Application 2021 to 2036
Figure 38: U.S. Intralogistics Market Volume (Volume) Projection, By Function/Application 2021 to 2036
Figure 39: U.S. Intralogistics Market Incremental Opportunities (Value) Forecast, By Function/Application 2026 to 2036
Figure 40: U.S. Intralogistics Market Value (Value) Projection, By End-use Industry 2021 to 2036
Figure 41: U.S. Intralogistics Market Volume (Volume) Projection, By End-use Industry 2021 to 2036
Figure 42: U.S. Intralogistics Market Incremental Opportunities (Value) Forecast, By End-use Industry 2026 to 2036
Figure 43: Canada Intralogistics Market Value (Value) Projection, By Solution Type 2021 to 2036
Figure 44: Canada Intralogistics Market Volume (Volume) Projection, By Solution Type 2021 to 2036
Figure 45: Canada Intralogistics Market Incremental Opportunities (Value) Forecast, By Solution Type 2026 to 2036
Figure 46: Canada Intralogistics Market Value (Value) Projection, By Equipment Automation 2021 to 2036
Figure 47: Canada Intralogistics Market Volume (Volume) Projection, By Equipment Automation 2021 to 2036
Figure 48: Canada Intralogistics Market Incremental Opportunities (Value) Forecast, By Equipment Automation 2026 to 2036
Figure 49: Canada Intralogistics Market Value (Value) Projection, By Function/Application 2021 to 2036
Figure 50: Canada Intralogistics Market Volume (Volume) Projection, By Function/Application 2021 to 2036
Figure 51: Canada Intralogistics Market Incremental Opportunities (Value) Forecast, By Function/Application 2026 to 2036
Figure 52: Canada Intralogistics Market Value (Value) Projection, By End-use Industry 2021 to 2036
Figure 53: Canada Intralogistics Market Volume (Volume) Projection, By End-use Industry 2021 to 2036
Figure 54: Canada Intralogistics Market Incremental Opportunities (Value) Forecast, By End-use Industry 2026 to 2036
Figure 55: Europe Intralogistics Market Value (Value) Projection, By Solution Type 2021 to 2036
Figure 56: Europe Intralogistics Market Volume (Volume) Projection, By Solution Type 2021 to 2036
Figure 57: Europe Intralogistics Market Incremental Opportunities (Value) Forecast, By Solution Type 2026 to 2036
Figure 58: Europe Intralogistics Market Value (Value) Projection, By Equipment Automation 2021 to 2036
Figure 59: Europe Intralogistics Market Volume (Volume) Projection, By Equipment Automation 2021 to 2036
Figure 60: Europe Intralogistics Market Incremental Opportunities (Value) Forecast, By Equipment Automation 2026 to 2036
Figure 61: Europe Intralogistics Market Value (Value) Projection, By Function/Application 2021 to 2036
Figure 62: Europe Intralogistics Market Volume (Volume) Projection, By Function/Application 2021 to 2036
Figure 63: Europe Intralogistics Market Incremental Opportunities (Value) Forecast, By Function/Application 2026 to 2036
Figure 64: Europe Intralogistics Market Value (Value) Projection, By End-use Industry 2021 to 2036
Figure 65: Europe Intralogistics Market Volume (Volume) Projection, By End-use Industry 2021 to 2036
Figure 66: Europe Intralogistics Market Incremental Opportunities (Value) Forecast, By End-use Industry 2026 to 2036
Figure 67: Europe Intralogistics Market Value (Value) Projection, By Country 2021 to 2036
Figure 68: Europe Intralogistics Market Volume (Volume) Projection, By Country 2021 to 2036
Figure 69: Europe Intralogistics Market Incremental Opportunities (Value) Forecast, By Country 2026 to 2036
Figure 70: U.K. Intralogistics Market Value (Value) Projection, By Solution Type 2021 to 2036
Figure 71: U.K. Intralogistics Market Volume (Volume) Projection, By Solution Type 2021 to 2036
Figure 72: U.K. Intralogistics Market Incremental Opportunities (Value) Forecast, By Solution Type 2026 to 2036
Figure 73: U.K. Intralogistics Market Value (Value) Projection, By Equipment Automation 2021 to 2036
Figure 74: U.K. Intralogistics Market Volume (Volume) Projection, By Equipment Automation 2021 to 2036
Figure 75: U.K. Intralogistics Market Incremental Opportunities (Value) Forecast, By Equipment Automation 2026 to 2036
Figure 76: U.K. Intralogistics Market Value (Value) Projection, By Function/Application 2021 to 2036
Figure 77: U.K. Intralogistics Market Volume (Volume) Projection, By Function/Application 2021 to 2036
Figure 78: U.K. Intralogistics Market Incremental Opportunities (Value) Forecast, By Function/Application 2026 to 2036
Figure 79: U.K. Intralogistics Market Value (Value) Projection, By End-use Industry 2021 to 2036
Figure 80: U.K. Intralogistics Market Volume (Volume) Projection, By End-use Industry 2021 to 2036
Figure 81: U.K. Intralogistics Market Incremental Opportunities (Value) Forecast, By End-use Industry 2026 to 2036
Figure 82: Germany Intralogistics Market Value (Value) Projection, By Solution Type 2021 to 2036
Figure 83: Germany Intralogistics Market Volume (Volume) Projection, By Solution Type 2021 to 2036
Figure 84: Germany Intralogistics Market Incremental Opportunities (Value) Forecast, By Solution Type 2026 to 2036
Figure 85: Germany Intralogistics Market Value (Value) Projection, By Equipment Automation 2021 to 2036
Figure 86: Germany Intralogistics Market Volume (Volume) Projection, By Equipment Automation 2021 to 2036
Figure 87: Germany Intralogistics Market Incremental Opportunities (Value) Forecast, By Equipment Automation 2026 to 2036
Figure 88: Germany Intralogistics Market Value (Value) Projection, By Function/Application 2021 to 2036
Figure 89: Germany Intralogistics Market Volume (Volume) Projection, By Function/Application 2021 to 2036
Figure 90: Germany Intralogistics Market Incremental Opportunities (Value) Forecast, By Function/Application 2026 to 2036
Figure 91: Germany Intralogistics Market Value (Value) Projection, By End-use Industry 2021 to 2036
Figure 92: Germany Intralogistics Market Volume (Volume) Projection, By End-use Industry 2021 to 2036
Figure 93: Germany Intralogistics Market Incremental Opportunities (Value) Forecast, By End-use Industry 2026 to 2036
Figure 94: France Intralogistics Market Value (Value) Projection, By Solution Type 2021 to 2036
Figure 95: France Intralogistics Market Volume (Volume) Projection, By Solution Type 2021 to 2036
Figure 96: France Intralogistics Market Incremental Opportunities (Value) Forecast, By Solution Type 2026 to 2036
Figure 97: France Intralogistics Market Value (Value) Projection, By Equipment Automation 2021 to 2036
Figure 98: France Intralogistics Market Volume (Volume) Projection, By Equipment Automation 2021 to 2036
Figure 99: France Intralogistics Market Incremental Opportunities (Value) Forecast, By Equipment Automation 2026 to 2036
Figure 100: France Intralogistics Market Value (Value) Projection, By Function/Application 2021 to 2036
Figure 101: France Intralogistics Market Volume (Volume) Projection, By Function/Application 2021 to 2036
Figure 102: France Intralogistics Market Incremental Opportunities (Value) Forecast, By Function/Application 2026 to 2036
Figure 103: France Intralogistics Market Value (Value) Projection, By End-use Industry 2021 to 2036
Figure 104: France Intralogistics Market Volume (Volume) Projection, By End-use Industry 2021 to 2036
Figure 105: France Intralogistics Market Incremental Opportunities (Value) Forecast, By End-use Industry 2026 to 2036
Figure 106: Italy Intralogistics Market Value (Value) Projection, By Solution Type 2021 to 2036
Figure 107: Italy Intralogistics Market Volume (Volume) Projection, By Solution Type 2021 to 2036
Figure 108: Italy Intralogistics Market Incremental Opportunities (Value) Forecast, By Solution Type 2026 to 2036
Figure 109: Italy Intralogistics Market Value (Value) Projection, By Equipment Automation 2021 to 2036
Figure 110: Italy Intralogistics Market Volume (Volume) Projection, By Equipment Automation 2021 to 2036
Figure 111: Italy Intralogistics Market Incremental Opportunities (Value) Forecast, By Equipment Automation 2026 to 2036
Figure 112: Italy Intralogistics Market Value (Value) Projection, By Function/Application 2021 to 2036
Figure 113: Italy Intralogistics Market Volume (Volume) Projection, By Function/Application 2021 to 2036
Figure 114: Italy Intralogistics Market Incremental Opportunities (Value) Forecast, By Function/Application 2026 to 2036
Figure 115: Italy Intralogistics Market Value (Value) Projection, By End-use Industry 2021 to 2036
Figure 116: Italy Intralogistics Market Volume (Volume) Projection, By End-use Industry 2021 to 2036
Figure 117: Italy Intralogistics Market Incremental Opportunities (Value) Forecast, By End-use Industry 2026 to 2036
Figure 118: Spain Intralogistics Market Value (Value) Projection, By Solution Type 2021 to 2036
Figure 119: Spain Intralogistics Market Volume (Volume) Projection, By Solution Type 2021 to 2036
Figure 120: Spain Intralogistics Market Incremental Opportunities (Value) Forecast, By Solution Type 2026 to 2036
Figure 121: Spain Intralogistics Market Value (Value) Projection, By Equipment Automation 2021 to 2036
Figure 122: Spain Intralogistics Market Volume (Volume) Projection, By Equipment Automation 2021 to 2036
Figure 123: Spain Intralogistics Market Incremental Opportunities (Value) Forecast, By Equipment Automation 2026 to 2036
Figure 124: Spain Intralogistics Market Value (Value) Projection, By Function/Application 2021 to 2036
Figure 125: Spain Intralogistics Market Volume (Volume) Projection, By Function/Application 2021 to 2036
Figure 126: Spain Intralogistics Market Incremental Opportunities (Value) Forecast, By Function/Application 2026 to 2036
Figure 127: Spain Intralogistics Market Value (Value) Projection, By End-use Industry 2021 to 2036
Figure 128: Spain Intralogistics Market Volume (Volume) Projection, By End-use Industry 2021 to 2036
Figure 129: Spain Intralogistics Market Incremental Opportunities (Value) Forecast, By End-use Industry 2026 to 2036
Figure 130: The Netherlands Intralogistics Market Value (Value) Projection, By Solution Type 2021 to 2036
Figure 131: The Netherlands Intralogistics Market Volume (Volume) Projection, By Solution Type 2021 to 2036
Figure 132: The Netherlands Intralogistics Market Incremental Opportunities (Value) Forecast, By Solution Type 2026 to 2036
Figure 133: The Netherlands Intralogistics Market Value (Value) Projection, By Equipment Automation 2021 to 2036
Figure 134: The Netherlands Intralogistics Market Volume (Volume) Projection, By Equipment Automation 2021 to 2036
Figure 135: The Netherlands Intralogistics Market Incremental Opportunities (Value) Forecast, By Equipment Automation 2026 to 2036
Figure 136: The Netherlands Intralogistics Market Value (Value) Projection, By Function/Application 2021 to 2036
Figure 137: The Netherlands Intralogistics Market Volume (Volume) Projection, By Function/Application 2021 to 2036
Figure 138: The Netherlands Intralogistics Market Incremental Opportunities (Value) Forecast, By Function/Application 2026 to 2036
Figure 139: The Netherlands Intralogistics Market Value (Value) Projection, By End-use Industry 2021 to 2036
Figure 140: The Netherlands Intralogistics Market Volume (Volume) Projection, By End-use Industry 2021 to 2036
Figure 141: The Netherlands Intralogistics Market Incremental Opportunities (Value) Forecast, By End-use Industry 2026 to 2036
Figure 142: Asia Pacific Intralogistics Market Value (Value) Projection, By Solution Type 2021 to 2036
Figure 143: Asia Pacific Intralogistics Market Volume (Volume) Projection, By Solution Type 2021 to 2036
Figure 144: Asia Pacific Intralogistics Market Incremental Opportunities (Value) Forecast, By Solution Type 2026 to 2036
Figure 145: Asia Pacific Intralogistics Market Value (Value) Projection, By Equipment Automation 2021 to 2036
Figure 146: Asia Pacific Intralogistics Market Volume (Volume) Projection, By Equipment Automation 2021 to 2036
Figure 147: Asia Pacific Intralogistics Market Incremental Opportunities (Value) Forecast, By Equipment Automation 2026 to 2036
Figure 148: Asia Pacific Intralogistics Market Value (Value) Projection, By Function/Application 2021 to 2036
Figure 149: Asia Pacific Intralogistics Market Volume (Volume) Projection, By Function/Application 2021 to 2036
Figure 150: Asia Pacific Intralogistics Market Incremental Opportunities (Value) Forecast, By Function/Application 2026 to 2036
Figure 151: Asia Pacific Intralogistics Market Value (Value) Projection, By End-use Industry 2021 to 2036
Figure 152: Asia Pacific Intralogistics Market Volume (Volume) Projection, By End-use Industry 2021 to 2036
Figure 153: Asia Pacific Intralogistics Market Incremental Opportunities (Value) Forecast, By End-use Industry 2026 to 2036
Figure 154: Asia Pacific Intralogistics Market Value (Value) Projection, By Country 2021 to 2036
Figure 155: Asia Pacific Intralogistics Market Volume (Volume) Projection, By Country 2021 to 2036
Figure 156: Asia Pacific Intralogistics Market Incremental Opportunities (Value) Forecast, By Country 2026 to 2036
Figure 157: China Intralogistics Market Value (Value) Projection, By Solution Type 2021 to 2036
Figure 158: China Intralogistics Market Volume (Volume) Projection, By Solution Type 2021 to 2036
Figure 159: China Intralogistics Market Incremental Opportunities (Value) Forecast, By Solution Type 2026 to 2036
Figure 160: China Intralogistics Market Value (Value) Projection, By Equipment Automation 2021 to 2036
Figure 161: China Intralogistics Market Volume (Volume) Projection, By Equipment Automation 2021 to 2036
Figure 162: China Intralogistics Market Incremental Opportunities (Value) Forecast, By Equipment Automation 2026 to 2036
Figure 163: China Intralogistics Market Value (Value) Projection, By Function/Application 2021 to 2036
Figure 164: China Intralogistics Market Volume (Volume) Projection, By Function/Application 2021 to 2036
Figure 165: China Intralogistics Market Incremental Opportunities (Value) Forecast, By Function/Application 2026 to 2036
Figure 166: China Intralogistics Market Value (Value) Projection, By End-use Industry 2021 to 2036
Figure 167: China Intralogistics Market Volume (Volume) Projection, By End-use Industry 2021 to 2036
Figure 168: China Intralogistics Market Incremental Opportunities (Value) Forecast, By End-use Industry 2026 to 2036
Figure 169: India Intralogistics Market Value (Value) Projection, By Solution Type 2021 to 2036
Figure 170: India Intralogistics Market Volume (Volume) Projection, By Solution Type 2021 to 2036
Figure 171: India Intralogistics Market Incremental Opportunities (Value) Forecast, By Solution Type 2026 to 2036
Figure 172: India Intralogistics Market Value (Value) Projection, By Equipment Automation 2021 to 2036
Figure 173: India Intralogistics Market Volume (Volume) Projection, By Equipment Automation 2021 to 2036
Figure 174: India Intralogistics Market Incremental Opportunities (Value) Forecast, By Equipment Automation 2026 to 2036
Figure 175: India Intralogistics Market Value (Value) Projection, By Function/Application 2021 to 2036
Figure 176: India Intralogistics Market Volume (Volume) Projection, By Function/Application 2021 to 2036
Figure 177: India Intralogistics Market Incremental Opportunities (Value) Forecast, By Function/Application 2026 to 2036
Figure 178: India Intralogistics Market Value (Value) Projection, By End-use Industry 2021 to 2036
Figure 179: India Intralogistics Market Volume (Volume) Projection, By End-use Industry 2021 to 2036
Figure 180: India Intralogistics Market Incremental Opportunities (Value) Forecast, By End-use Industry 2026 to 2036
Figure 181: Japan Intralogistics Market Value (Value) Projection, By Solution Type 2021 to 2036
Figure 182: Japan Intralogistics Market Volume (Volume) Projection, By Solution Type 2021 to 2036
Figure 183: Japan Intralogistics Market Incremental Opportunities (Value) Forecast, By Solution Type 2026 to 2036
Figure 184: Japan Intralogistics Market Value (Value) Projection, By Equipment Automation 2021 to 2036
Figure 185: Japan Intralogistics Market Volume (Volume) Projection, By Equipment Automation 2021 to 2036
Figure 186: Japan Intralogistics Market Incremental Opportunities (Value) Forecast, By Equipment Automation 2026 to 2036
Figure 187: Japan Intralogistics Market Value (Value) Projection, By Function/Application 2021 to 2036
Figure 188: Japan Intralogistics Market Volume (Volume) Projection, By Function/Application 2021 to 2036
Figure 189: Japan Intralogistics Market Incremental Opportunities (Value) Forecast, By Function/Application 2026 to 2036
Figure 190: Japan Intralogistics Market Value (Value) Projection, By End-use Industry 2021 to 2036
Figure 191: Japan Intralogistics Market Volume (Volume) Projection, By End-use Industry 2021 to 2036
Figure 192: Japan Intralogistics Market Incremental Opportunities (Value) Forecast, By End-use Industry 2026 to 2036
Figure 193: Australia Intralogistics Market Value (Value) Projection, By Solution Type 2021 to 2036
Figure 194: Australia Intralogistics Market Volume (Volume) Projection, By Solution Type 2021 to 2036
Figure 195: Australia Intralogistics Market Incremental Opportunities (Value) Forecast, By Solution Type 2026 to 2036
Figure 196: Australia Intralogistics Market Value (Value) Projection, By Equipment Automation 2021 to 2036
Figure 197: Australia Intralogistics Market Volume (Volume) Projection, By Equipment Automation 2021 to 2036
Figure 198: Australia Intralogistics Market Incremental Opportunities (Value) Forecast, By Equipment Automation 2026 to 2036
Figure 199: Australia Intralogistics Market Value (Value) Projection, By Function/Application 2021 to 2036
Figure 200: Australia Intralogistics Market Volume (Volume) Projection, By Function/Application 2021 to 2036
Figure 201: Australia Intralogistics Market Incremental Opportunities (Value) Forecast, By Function/Application 2026 to 2036
Figure 202: Australia Intralogistics Market Value (Value) Projection, By End-use Industry 2021 to 2036
Figure 203: Australia Intralogistics Market Volume (Volume) Projection, By End-use Industry 2021 to 2036
Figure 204: Australia Intralogistics Market Incremental Opportunities (Value) Forecast, By End-use Industry 2026 to 2036
Figure 205: South Korea Intralogistics Market Value (Value) Projection, By Solution Type 2021 to 2036
Figure 206: South Korea Intralogistics Market Volume (Volume) Projection, By Solution Type 2021 to 2036
Figure 207: South Korea Intralogistics Market Incremental Opportunities (Value) Forecast, By Solution Type 2026 to 2036
Figure 208: South Korea Intralogistics Market Value (Value) Projection, By Equipment Automation 2021 to 2036
Figure 209: South Korea Intralogistics Market Volume (Volume) Projection, By Equipment Automation 2021 to 2036
Figure 210: South Korea Intralogistics Market Incremental Opportunities (Value) Forecast, By Equipment Automation 2026 to 2036
Figure 211: South Korea Intralogistics Market Value (Value) Projection, By Function/Application 2021 to 2036
Figure 212: South Korea Intralogistics Market Volume (Volume) Projection, By Function/Application 2021 to 2036
Figure 213: South Korea Intralogistics Market Incremental Opportunities (Value) Forecast, By Function/Application 2026 to 2036
Figure 214: South Korea Intralogistics Market Value (Value) Projection, By End-use Industry 2021 to 2036
Figure 215: South Korea Intralogistics Market Volume (Volume) Projection, By End-use Industry 2021 to 2036
Figure 216: South Korea Intralogistics Market Incremental Opportunities (Value) Forecast, By End-use Industry 2026 to 2036
Figure 217: ASEAN Intralogistics Market Value (Value) Projection, By Solution Type 2021 to 2036
Figure 218: ASEAN Intralogistics Market Volume (Volume) Projection, By Solution Type 2021 to 2036
Figure 219: ASEAN Intralogistics Market Incremental Opportunities (Value) Forecast, By Solution Type 2026 to 2036
Figure 220: ASEAN Intralogistics Market Value (Value) Projection, By Equipment Automation 2021 to 2036
Figure 221: ASEAN Intralogistics Market Volume (Volume) Projection, By Equipment Automation 2021 to 2036
Figure 222: ASEAN Intralogistics Market Incremental Opportunities (Value) Forecast, By Equipment Automation 2026 to 2036
Figure 223: ASEAN Intralogistics Market Value (Value) Projection, By Function/Application 2021 to 2036
Figure 224: ASEAN Intralogistics Market Volume (Volume) Projection, By Function/Application 2021 to 2036
Figure 225: ASEAN Intralogistics Market Incremental Opportunities (Value) Forecast, By Function/Application 2026 to 2036
Figure 226: ASEAN Intralogistics Market Value (Value) Projection, By End-use Industry 2021 to 2036
Figure 227: ASEAN Intralogistics Market Volume (Volume) Projection, By End-use Industry 2021 to 2036
Figure 228: ASEAN Intralogistics Market Incremental Opportunities (Value) Forecast, By End-use Industry 2026 to 2036
Figure 229: Middle East & Africa Intralogistics Market Value (Value) Projection, By Solution Type 2021 to 2036
Figure 230: Middle East & Africa Intralogistics Market Volume (Volume) Projection, By Solution Type 2021 to 2036
Figure 231: Middle East & Africa Intralogistics Market Incremental Opportunities (Value) Forecast, By Solution Type 2026 to 2036
Figure 232: Middle East & Africa Intralogistics Market Value (Value) Projection, By Equipment Automation 2021 to 2036
Figure 233: Middle East & Africa Intralogistics Market Volume (Volume) Projection, By Equipment Automation 2021 to 2036
Figure 234: Middle East & Africa Intralogistics Market Incremental Opportunities (Value) Forecast, By Equipment Automation 2026 to 2036
Figure 235: Middle East & Africa Intralogistics Market Value (Value) Projection, By Function/Application 2021 to 2036
Figure 236: Middle East & Africa Intralogistics Market Volume (Volume) Projection, By Function/Application 2021 to 2036
Figure 237: Middle East & Africa Intralogistics Market Incremental Opportunities (Value) Forecast, By Function/Application 2026 to 2036
Figure 238: Middle East & Africa Intralogistics Market Value (Value) Projection, By End-use Industry 2021 to 2036
Figure 239: Middle East & Africa Intralogistics Market Volume (Volume) Projection, By End-use Industry 2021 to 2036
Figure 240: Middle East & Africa Intralogistics Market Incremental Opportunities (Value) Forecast, By End-use Industry 2026 to 2036
Figure 241: Middle East & Africa Intralogistics Market Value (Value) Projection, By Country 2021 to 2036
Figure 242: Middle East & Africa Intralogistics Market Volume (Volume) Projection, By Country 2021 to 2036
Figure 243: Middle East & Africa Intralogistics Market Incremental Opportunities (Value) Forecast, By Country 2026 to 2036
Figure 244: GCC Countries Intralogistics Market Value (Value) Projection, By Solution Type 2021 to 2036
Figure 245: GCC Countries Intralogistics Market Volume (Volume) Projection, By Solution Type 2021 to 2036
Figure 246: GCC Countries Intralogistics Market Incremental Opportunities (Value) Forecast, By Solution Type 2026 to 2036
Figure 247: GCC Countries Intralogistics Market Value (Value) Projection, By Equipment Automation 2021 to 2036
Figure 248: GCC Countries Intralogistics Market Volume (Volume) Projection, By Equipment Automation 2021 to 2036
Figure 249: GCC Countries Intralogistics Market Incremental Opportunities (Value) Forecast, By Equipment Automation 2026 to 2036
Figure 250: GCC Countries Intralogistics Market Value (Value) Projection, By Function/Application 2021 to 2036
Figure 251: GCC Countries Intralogistics Market Volume (Volume) Projection, By Function/Application 2021 to 2036
Figure 252: GCC Countries Intralogistics Market Incremental Opportunities (Value) Forecast, By Function/Application 2026 to 2036
Figure 253: GCC Countries Intralogistics Market Value (Value) Projection, By End-use Industry 2021 to 2036
Figure 254: GCC Countries Intralogistics Market Volume (Volume) Projection, By End-use Industry 2021 to 2036
Figure 255: GCC Countries Intralogistics Market Incremental Opportunities (Value) Forecast, By End-use Industry 2026 to 2036
Figure 256: South Africa Intralogistics Market Value (Value) Projection, By Solution Type 2021 to 2036
Figure 257: South Africa Intralogistics Market Volume (Volume) Projection, By Solution Type 2021 to 2036
Figure 258: South Africa Intralogistics Market Incremental Opportunities (Value) Forecast, By Solution Type 2026 to 2036
Figure 259: South Africa Intralogistics Market Value (Value) Projection, By Equipment Automation 2021 to 2036
Figure 260: South Africa Intralogistics Market Volume (Volume) Projection, By Equipment Automation 2021 to 2036
Figure 261: South Africa Intralogistics Market Incremental Opportunities (Value) Forecast, By Equipment Automation 2026 to 2036
Figure 262: South Africa Intralogistics Market Value (Value) Projection, By Function/Application 2021 to 2036
Figure 263: South Africa Intralogistics Market Volume (Volume) Projection, By Function/Application 2021 to 2036
Figure 264: South Africa Intralogistics Market Incremental Opportunities (Value) Forecast, By Function/Application 2026 to 2036
Figure 265: South Africa Intralogistics Market Value (Value) Projection, By End-use Industry 2021 to 2036
Figure 266: South Africa Intralogistics Market Volume (Volume) Projection, By End-use Industry 2021 to 2036
Figure 267: South Africa Intralogistics Market Incremental Opportunities (Value) Forecast, By End-use Industry 2026 to 2036
Figure 268: Latin America Intralogistics Market Value (Value) Projection, By Solution Type 2021 to 2036
Figure 269: Latin America Intralogistics Market Volume (Volume) Projection, By Solution Type 2021 to 2036
Figure 270: Latin America Intralogistics Market Incremental Opportunities (Value) Forecast, By Solution Type 2026 to 2036
Figure 271: Latin America Intralogistics Market Value (Value) Projection, By Equipment Automation 2021 to 2036
Figure 272: Latin America Intralogistics Market Volume (Volume) Projection, By Equipment Automation 2021 to 2036
Figure 273: Latin America Intralogistics Market Incremental Opportunities (Value) Forecast, By Equipment Automation 2026 to 2036
Figure 274: Latin America Intralogistics Market Value (Value) Projection, By Function/Application 2021 to 2036
Figure 275: Latin America Intralogistics Market Volume (Volume) Projection, By Function/Application 2021 to 2036
Figure 276: Latin America Intralogistics Market Incremental Opportunities (Value) Forecast, By Function/Application 2026 to 2036
Figure 277: Latin America Intralogistics Market Value (Value) Projection, By End-use Industry 2021 to 2036
Figure 278: Latin America Intralogistics Market Volume (Volume) Projection, By End-use Industry 2021 to 2036
Figure 279: Latin America Intralogistics Market Incremental Opportunities (Value) Forecast, By End-use Industry 2026 to 2036
Figure 280: Latin America Intralogistics Market Value (Value) Projection, By Country 2021 to 2036
Figure 281: Latin America Intralogistics Market Volume (Volume) Projection, By Country 2021 to 2036
Figure 282: Latin America Intralogistics Market Incremental Opportunities (Value) Forecast, By Country 2026 to 2036
Figure 283: Brazil Intralogistics Market Value (Value) Projection, By Solution Type 2021 to 2036
Figure 284: Brazil Intralogistics Market Volume (Volume) Projection, By Solution Type 2021 to 2036
Figure 285: Brazil Intralogistics Market Incremental Opportunities (Value) Forecast, By Solution Type 2026 to 2036
Figure 286: Brazil Intralogistics Market Value (Value) Projection, By Equipment Automation 2021 to 2036
Figure 287: Brazil Intralogistics Market Volume (Volume) Projection, By Equipment Automation 2021 to 2036
Figure 288: Brazil Intralogistics Market Incremental Opportunities (Value) Forecast, By Equipment Automation 2026 to 2036
Figure 289: Brazil Intralogistics Market Value (Value) Projection, By Function/Application 2021 to 2036
Figure 290: Brazil Intralogistics Market Volume (Volume) Projection, By Function/Application 2021 to 2036
Figure 291: Brazil Intralogistics Market Incremental Opportunities (Value) Forecast, By Function/Application 2026 to 2036
Figure 292: Brazil Intralogistics Market Value (Value) Projection, By End-use Industry 2021 to 2036
Figure 293: Brazil Intralogistics Market Volume (Volume) Projection, By End-use Industry 2021 to 2036
Figure 294: Brazil Intralogistics Market Incremental Opportunities (Value) Forecast, By End-use Industry 2026 to 2036
Figure 295: Mexico Intralogistics Market Value (Value) Projection, By Solution Type 2021 to 2036
Figure 296: Mexico Intralogistics Market Volume (Volume) Projection, By Solution Type 2021 to 2036
Figure 297: Mexico Intralogistics Market Incremental Opportunities (Value) Forecast, By Solution Type 2026 to 2036
Figure 298: Mexico Intralogistics Market Value (Value) Projection, By Equipment Automation 2021 to 2036
Figure 299: Mexico Intralogistics Market Volume (Volume) Projection, By Equipment Automation 2021 to 2036
Figure 300: Mexico Intralogistics Market Incremental Opportunities (Value) Forecast, By Equipment Automation 2026 to 2036
Figure 301: Mexico Intralogistics Market Value (Value) Projection, By Function/Application 2021 to 2036
Figure 302: Mexico Intralogistics Market Volume (Volume) Projection, By Function/Application 2021 to 2036
Figure 303: Mexico Intralogistics Market Incremental Opportunities (Value) Forecast, By Function/Application 2026 to 2036
Figure 304: Mexico Intralogistics Market Value (Value) Projection, By End-use Industry 2021 to 2036
Figure 305: Mexico Intralogistics Market Volume (Volume) Projection, By End-use Industry 2021 to 2036
Figure 306: Mexico Intralogistics Market Incremental Opportunities (Value) Forecast, By End-use Industry 2026 to 2036
Figure 307: Argentina Intralogistics Market Value (Value) Projection, By Solution Type 2021 to 2036
Figure 308: Argentina Intralogistics Market Volume (Volume) Projection, By Solution Type 2021 to 2036
Figure 309: Argentina Intralogistics Market Incremental Opportunities (Value) Forecast, By Solution Type 2026 to 2036
Figure 310: Argentina Intralogistics Market Value (Value) Projection, By Equipment Automation 2021 to 2036
Figure 311: Argentina Intralogistics Market Volume (Volume) Projection, By Equipment Automation 2021 to 2036
Figure 312: Argentina Intralogistics Market Incremental Opportunities (Value) Forecast, By Equipment Automation 2026 to 2036
Figure 313: Argentina Intralogistics Market Value (Value) Projection, By Function/Application 2021 to 2036
Figure 314: Argentina Intralogistics Market Volume (Volume) Projection, By Function/Application 2021 to 2036
Figure 315: Argentina Intralogistics Market Incremental Opportunities (Value) Forecast, By Function/Application 2026 to 2036
Figure 316: Argentina Intralogistics Market Value (Value) Projection, By End-use Industry 2021 to 2036
Figure 317: Argentina Intralogistics Market Volume (Volume) Projection, By End-use Industry 2021 to 2036
Figure 318: Argentina Intralogistics Market Incremental Opportunities (Value) Forecast, By End-use Industry 2026 to 2036
Copyright © Transparency Market Research, Inc. All Rights reserved
Trust Online


Intralogistics Market
