
Reports
Reports
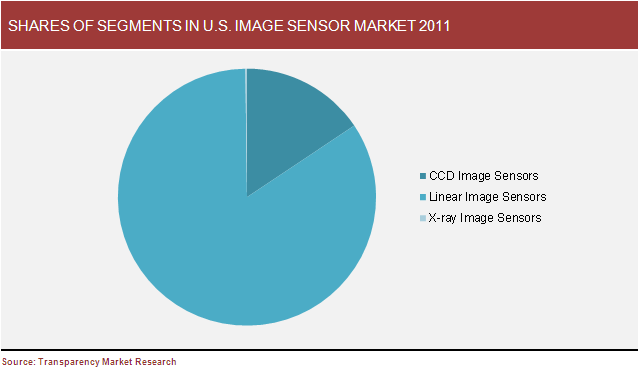
The image sensors are primarily categorized as CCD image sensors (area image sensor), linear image sensors and X-ray image sensors. The linear image sensor segmented is subdivided into CMOS image sensors, NMOS image sensors and InGaAs image sensors.
The linear image sensor is the largest segment; accounting for about 84.2% of the U.S. images sensor market in 2011, largely due to CMOS image sensors, which accounts for more than 90% of the linear image sensor market in the same year.
The CMOS (Complementary Metal Oxide Semiconductors) image sensors segment dominates the U.S. linear image sensor market with more than 90% share. The cost of manufacturing CMOS-based image sensors is much cheaper than other competing technologies in the market. This low cost image sensor will have a good market in the industrial segment. The explosive growth and rapid development of CMOS image sensors are driven by the mobile phone market. Mobile devices with CMOS image sensors are expected to grow rapidly in the next 2 to 3 years in the U.S. market. This trend is expected to drive the growth of the emerging CMOS sensor markets of Latin America, India, Russia, and China.
The growth in image sensor market is driven by low cost CMOS (Complementary Metal Oxide Semiconductors) based image sensor technology. The use of CMOS in image sensor technology helps in providing better quality images as compared to CCD (Charge Coupled Device) technology. The cost of manufacturing CMOS-based image sensors is much cheaper than other competing technologies in the market. This low cost image sensor will have a good market in the industrial segment.
The applications of image sensor devices in the consumer market are driving the U.S. image sensor market. Image sensor devices with CMOS technology are better than the other competitive technologies in the market. With advancement in technology, consumers are shifting towards modularization and the use of advanced devices with image sensor enabled applications.
Portable applications accounts for the largest share of the U.S. image sensors applications followed by toys astronomy. With growing safety and security standards, a large number of automobile manufacturers are upgrading their vehicles, which is expected to drive the image sensors market. Low-priced and efficient design capabilities of image sensors make them ideal for automotive applications. Mobile handsets are the leading application for CMOS sensors, representing more than 75% of the total CMOS shipments in 2011. The use of CCD technology will shrink from 14% in 2011 to just 1.3% by 2017.
Growing popularity of smartphones in the U.S. region is expected to increase the market prospects for image sensors in the near future. Significant opportunities in the image sensor market are expected over the next few years. With the increase in the use of image sensor devices in biometrics, medical, and film cameras in accordance with vehicle driver assistance systems, security and surveillance devices are expected to have a substantial market in the future.
The image sensor market in the U.S. is growing rapidly with a large number of competitors on the scene. Global players are forcing local players to manufacture new products as the market is growing rapidly. This is causing an add on advantage for good manufacturing practices for the U.S. image sensor market with the increase in market share in terms of quality of the image sensor products.
There are about 23 major sensor types used in a range of sub-systems and instruments for increasing number of end markets across the world. Image sensors now hold a commendable position in the global sensors market with variety of applications for a large number of end use segments.
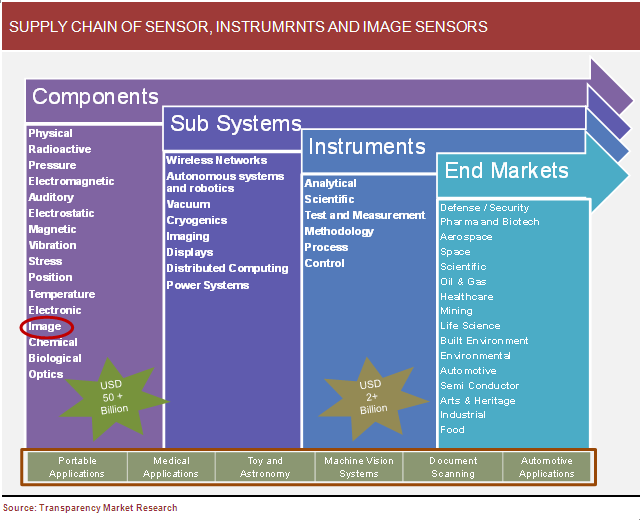
Image Sensors Market to Generate Major Revenues from Increasing Popularity of Consumer Electronics
The booming electronic industry and the increasing popularity of devices such as digital cameras, smartphones, laptops, tablets, AR/VR systems and other consumer electronics are the key factors boosting the global image sensors market. The 3D image sensors section of the market is projected to develop at a higher CAGR from 2020 to 2025 than the 2D image sensors fragment. The development of the 3D image sensors section can be credited to the expanding interest for 3D image sensors in car applications. These sensors have profundity detecting capacities, which make them appropriate for car applications for upgraded security of drivers and installed travelers. Besides, these image sensors are utilized in cell phones to make profundity impact in the images caught.
The expanding number of cameras being utilized in cell phones, for example, cell phones and tablets is one of the key components adding to the development of the image sensor market. As the significance of camera highlights and image quality in cell phones is expanding, OEM are investing their amounts of energy to create image sensors with a little impression and upgraded functionalities to keep up the convenience and slenderness of cell phones. The establishment of different cameras in a solitary cell phone unit brings about optical zoom, improved high-powerful reach (HDR), and low-light photography, just as empowers representation mode exchanging and 3D imaging highlights.
The rising popularity of cell phones in the U.S. area is required to expand the market possibilities for image sensors soon. Huge freedoms in the image sensor market are normal over the course of the following not many years. With the expansion in the utilization of image sensor gadgets in biometrics, clinical, and film cameras as per vehicle driver help frameworks, security and observation gadgets are relied upon to have a considerable market later on.
1. Introduction
1.1. Scope Of The Report
1.2. Key Takeaways
1.3. Methodology
2. Executive Summary
2.1. Overview
2.2. Segment Review
2.3. Application Market Review
2.4. Pricing Analysis
3. U.S. Image Sensors Market Overview
3.1. Market Dynamics
3.1.1. Market Trends
3.1.2. Drivers
3.1.2.1. Low Cost Of Cmos Image Sensors To Drive The U.S. Market
3.1.2.2. Growth In Consumer Market For Image Sensor Devices
3.1.2.3. Growth And Rapid Development Of Cmos Image Sensors
3.1.2.4. Power Efficient Cmos Image Sensor Devices
3.1.2.5. Growth In Multimedia Enabled Devices In The U.S. Market
3.1.3. Restraints
3.1.3.1. Image Quality Plays An Important Role In Image Sensor Market
3.1.3.2. Labor Cost Depends Upon The Device Manufacturing Cost
3.1.3.3. Environmental Factors
3.1.4. Opportunities
3.1.4.1. Adoption Of 3g With Video Supportive Mobile Phones
3.1.4.2. Growth In Countrywide Distribution Of Image Sensors
3.1.4.3. Focus On New Product Development
3.2. Pricing Trends
3.3. Image Sensor Market By End Use
3.3.1. Telecom Markets
3.3.2. Computers
3.3.3. Consumer Markets
3.3.4. Automotive
3.3.5. Industrial
3.3.6. Military And Aerospace
4. Image Sensors Market, 2011-2017
4.1. Types Of Image Sensors
4.1.1. Ccd Image Sensors Market Size And Forecast, 2011-2017
4.1.2. Linear Image Sensors Market Size And Forecast, 2011-2017
4.1.2.1. Cmos Image Sensor Market Size And Forecast, 2011-2017
4.1.2.1.1. Passive-pixel Sensors (Pps)
4.1.2.1.2. Active-pixel Sensors(Apss)
4.1.2.2. Nmos Image Sensor Market Size And Forecast, 2011-2017
4.1.2.3. Ingaas Image Sensor Market Size And Forecast, 2011-2017
4.1.3. X-ray Image Sensor Market Size And Forecast, 2011-2017
4.2. New Technology In Image Sensor Market - Backside Illumination
4.2.1. Drivers
4.2.1.1. Both Side Layers Can Be Designed And Optimized Independently
4.2.1.2. Better Sensitivity
4.2.1.3. Improved Sensitivity And Noise Reduction
4.2.2. Restraints
4.2.2.1. Pixel Size Scaling Is Limited
4.2.2.2. Increasing The Amount Of Light Attracts Noise
4.2.3. Opportunities
4.2.3.1. Speed And Dynamic Range Of Image Sensor Technology
4.2.3.2. Improved Shutter Efficiency
4.2.3.3. Research On For Better Image Sensor Technology
5. Image Sensors Market By Applications
5.1. Portable Applications Market Size And Forecast 2011-2017
5.2. Medical Applications Market Size And Forecast 2011-2017
5.2.1. Sensors For X-ray
5.2.2. Medical Radiography
5.2.3. Specimen Radiography
5.2.4. Dental Radiography
5.2.5. Biometric Identification
5.3. Toys And Astronomy Market Size And Forecast 2011-2017
5.3.1. Lottery Reading Devices
5.3.2. Space Science
5.3.3. Ground-based Astronomy
5.3.4. Earth Observation
5.4. Machine Vision Systems Market Size And Forecast 2011-2017
5.4.1. 2d Bar Code Reader
5.4.2. Multifunction Copier/printer
5.4.3. Banking Bills
5.4.4. Finger Print Reader
5.5. Document Scanning Market Size And Forecast 2011-2017
5.5.1. Test Marker Reader
5.5.2. Large Format Scanner
5.5.3. Business Card Reader
5.5.4. Check Reader
5.5.5. Electronics White Board
5.6. Automotive Applications Market Size And Forecast 2011-2017
5.6.1. Gamma Ray Sensors
5.6.2. Surveillance
5.7. Other Applications Market Size And Forecast 2011-2017
6. Competitive Scenario
6.1. Market Leaders
6.1.1. Global Image Sensor Market Shares Of Major Players 2011
6.1.2. U.S. Image Sensor Market Shares Of Major Players 2011
6.2. Recent Technological Developments
6.3. Leading Players In The U.S. Region
6.3.1. Omnivision Technologies Inc.
6.3.1.1. Company Overview
6.3.1.2. Financial Overview
6.3.1.3. Major Products And Services
6.3.1.4. Top Competitors
6.3.2. Micron Technology Inc.
6.3.2.1. Company Overview
6.3.2.2. Revenue Analysis
6.3.3. Sharp Microelectronics Of The Americas
6.3.3.1. Company Overview
6.3.4. Dalsa Corporation (Canada)
6.3.4.1. Company Overview
6.3.4.2. Major Products And Services
6.3.4.3. Top Competitors
7. Recommendations
List Of Tables
Table 1: Comparision Of Ccd And Cmos Technologies In Image Sensors
Table 2: U.S. Image Sensors Market Revenue, By Type 2011-2017 (Usd Million)
Table 3: U.S. Image Sensors Shipment, By Type 2011-2017 (Million Units)
Table 4: U.S. Linear Image Sensors Market Revenue, By Type 2011-2017 (Usd Million)
Table 5: U.S. Linear Image Sensors Shipment, By Type 2011-2017 (Million Units)
Table 6: U.S. Image Sensors Revenue, By Applications 2011-2017 (Usd Million)
Table 7: U.S. Image Sensors Shipment, By Applications 2011-2017 (Million Units)
List Of Figures
Fig. 1: U.S. Image Sensors Pricing Trend By Type
Fig. 2: Composition Of U.S. Industrial Image Sensor Market
Fig. 3: U.S. Ccd Image Sensors Market Revenue And Shipment Forecast 2011-2017
Fig. 4: U.S. Cmos Image Sensors Market Revenue And Shipment Forecast 2011-2017
Fig. 5: U.S. Nmos Image Sensors Market Revenue And Shipment Forecast 2011-2017
Fig. 6: U.S. Ingaas Image Sensors Market Revenue And Shipment Forecast 2011-2017
Fig. 7: U.S. X-ray Image Sensors Market Revenue And Shipment Forecast 2011-2017
Fig. 8: U.S. Image Sensor Portable Application Revenue And Shipment Forecast 2011-2017
Fig. 9: U.S. Image Sensor Medical Application Revenue And Shipment Forecast 2011-2017
Fig. 10: U.S. Image Sensor Application In Medical Domain
Fig. 11: U.S. Image Sensor Application In Biometric
Fig. 12: U.S. Image Sensor Toys And Astronomy Application Revenue And Shipment Forecast 2011-2017
Fig. 13: U.S. Image Sensor Application In Toys And Astronomy
Fig. 14: U.S. Image Sensor Machine Vision Systems Application Revenue And Shipment Forecast 2011-2017
Fig. 15: U.S. Image Sensor Application In Toys And Astronomy
Fig. 16: U.S. Image Sensor Document Scanning Application Revenue And Shipment Forecast 2011-2017
Fig. 17: U.S. Image Sensor Application In Toys And Astronomy
Fig. 18: U.S. Image Sensor Automotive Application Revenue And Shipment Forecast 2011-2017
Fig. 19: U.S. Image Sensor Automotive Application Revenue And Shipment Forecast 2011-2017
Fig. 20: Global Image Sensors Revenuet Share Of Major Players 2011 (%)
Fig. 21: U.S. Image Sensors Revenue Share Of Major Players 2011 (%)
Copyright © Transparency Market Research, Inc. All Rights reserved
Trust Online

Image Sensors Market