
Reports
Reports
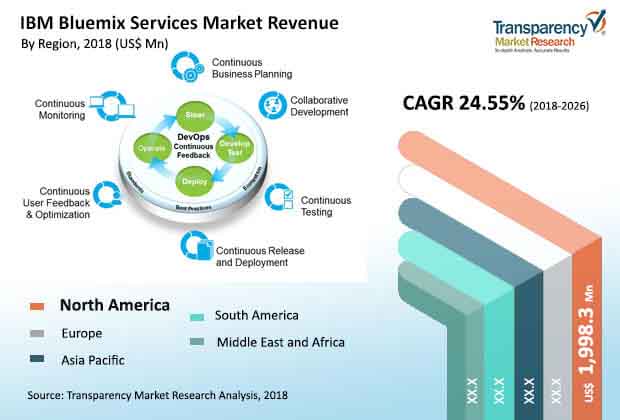
IBM Bluemix Services Market - Snapshot
According to a new market report published by Transparency Market Research titled ‘IBM Bluemix Services Market – Global Industry Analysis, Size, Share, Growth, Trends, and Forecast, 2018 – 2026,’the global IBM Bluemix services market is expected to reach US$ 38,847 Mn by 2026. The market is projected to expand at a CAGR of 24.55% during the forecast period from 2018 to 2026. According to the report, the global IBM Bluemix services market will continue to be influenced by the increasing adoption of IBM Bluemix services across a wide range of end-users such as BFSI, IT & telecom, healthcare, media & entertainment, among others. Asia Pacific region is projected to be at the forefront of global demand, with the market in the region expanding at a CAGR above 26%during the forecast period.
Watson segment to expand at a rapid pace throughout the forecast period
The global IBM Bluemix services market can be segmented based on application type into DevOps, application services, analytics, Watson, mobile, IoT, and others. These different applications of IBM Bluemix services have several benefits associated with them, which promotes their usage. For instance, DevOps services focuses on reduction of the downtime of redeploying applications so they are increasingly used for development of applications. The Watson segment is expected to expand rapidly as it allows the successful integration of powerful AI into applications developed by developers. Furthermore, IBM is introducing several services in the Watson and AI segments in order to stay ahead in the PaaS space. In January 2018, IBM announced a partnership with Mendix, a low code software platform. The partnership is expected to bring Mendix’s services to the IBM cloud, and the company plans to integrate them with its own tools. Through this move, IBM hopes to attract more users to its portfolio.
BFSI to be a major revenue generating segment in 2026
In terms of end-user, the IBM Bluemix services market can be segmented into BFSI, IT & telecom, healthcare, retail, federal, media and entertainment, and others. The BFSI segment is expected to hold a significant market share, owing to the advent of emerging innovations in the portfolio of IBM Bluemix services. The healthcare segment is anticipated to expand at a CAGR of 24.89% during the forecast period owing to the efficient output generation from IBM Bluemix services that are being used by the healthcare sector.
Public Segment is expected to expand rapidly over the forecast period
Based on deployment model, the IBM Bluemix services market can be segmented into dedicated, public, and private. The public segment is expected to hold a dominant share of the market and is anticipated to be a rapidly expanding segment. This is because the public deployment model offers nearly all functionalities with reduced cost, flexibility, scalability, and better deployment. Furthermore, the public deployment model is cheaper to use, which can be attractive to small scale industries and start-ups.
North America is expected to continue to hold significant share in the overall market
North America is expected to hold a prominent share of the IBM Bluemix services market during the forecast period. This is mainly due to the booming IBM Bluemix services marketplace with the presence of well-established partners of IBM Bluemix across the region. Furthermore, North America is witnessing significant adoption of IBM Bluemix services by the continuously expanding IT industry.
IBM Bluemix services are gaining popularity across Asia Pacific, especially in economies such as China, Japan, and India. Rise in awareness in the region pertaining to the advantages associated with the different services offered by IBM Bluemixis expected to fuel the IBM Bluemix services market in the region. China is projected to hold a significant market share owing to rise in the number of players in the region who are readily opting for partnerships with IBM and want to benefit from IBM Bluemix services.
Tata Consultancy Services Limited, Infosys Limited, Capgemini, Robert Bosch GmbH, Datamato Technologies Pvt. Ltd., Prolifics, Inc., Tech Mahindra Limited, Perficient Inc., Wipro Limited, and DXC Technology Company are some of the major players operating in the IBM Bluemix services market profiled in this study. Details such as financials, business strategies, recent developments, product implementation expertise, key contracts, certified professionals, IBM Bluemix services offerings, and other such strategic information pertaining to these players have been duly provided as part of company profiling.
The global IBM Bluemix services market is segmented as follows:
The IBM Bluemix services market, byApplication
IBM Bluemix services market, byEnd-user
The IBM Bluemix services market, byDeployment Model
Global IBM Bluemix services market, by Geography
1. Preface
1.1. Market Definition and Scope
1.2. Market Segmentation
1.3. Key Research Objectives
1.4. Research Highlights
2. Assumptions and Research Methodology
3. Executive Summary : Global IBM Bluemix Services Market
4. IBM Bluemix: Timeline
5. Market Overview
5.1. Introduction
5.2. Market Dynamics
5.2.1. Drivers
5.2.2. Restraints
5.2.3. Opportunities
5.3. Key Trends
5.4. Market Outlook
6. Global IBM Bluemix Services Market Analysis and Forecast, by Application Type
6.1. Overview & Definitions
6.2. Market Size (US$ Mn) Forecast, byApplication Type, 2016–2026
6.2.1. DevOps
6.2.2. Application services
6.2.3. Analytics
6.2.4. Watson
6.2.5. Mobile
6.2.6. IoT
6.2.7. Others
6.3. Market Attractiveness, byApplication Type
7. Global IBM Bluemix Services Market Analysis and Forecast, by End-user
7.1. Overview & Definitions
7.2. Market Size (US$ Mn) Forecast, byEnd-user,2016–2026
7.2.1. BFSI
7.2.2. IT & Telecom
7.2.3. Healthcare
7.2.4. Retail
7.2.5. Federal
7.2.6. Media & Entertainment
7.2.7. Others
7.3. Market Attractiveness, byEnd-user
8. Global IBM Bluemix Services Market Analysis and Forecast, by Deployment Model
8.1. Overview & Definitions
8.2. Market Size (US$ Mn) Forecast, byDeployment Model,2016–2026
8.2.1. Public
8.2.2. Dedicated
8.2.3. Private
8.3. Market Attractiveness, byEnd-user
9. Global IBM Bluemix Services Market Analysis and Forecast,by Region
9.1. Key Findings
9.2. Market Size (US$ Mn) Forecast, by Region, 2016–2026
9.2.1. North America
9.2.2. Europe
9.2.3. Asia Pacific
9.2.4. Middle East & Africa
9.2.5. South America
9.3. Market Attractiveness, by Country/Region
10. North America IBM Bluemix Services Market Analysis and Forecast
10.1. Market Size (US$ Mn) Forecast, byApplication Type, 2016–2026
10.1.1. DevOps
10.1.2. Application services
10.1.3. Analytics
10.1.4. Watson
10.1.5. Mobile
10.1.6. IoT
10.1.7. Others
10.2. Market Size (US$ Mn) Forecast, byEnd-user,2016–2026
10.2.1. BFSI
10.2.2. IT & Telecom
10.2.3. Healthcare
10.2.4. Retail
10.2.5. Federal
10.2.6. Media & Entertainment
10.2.7. Others
10.3. Market Size (US$ Mn) Forecast, byDeployment Model,2016–2026
10.3.1. Public
10.3.2. Dedicated
10.3.3. Private
10.4. Market Size (US$ Mn) Forecast, by Country, 2016–2026
10.4.1. The U.S.
10.4.2. Canada
10.4.3. Rest of North America
10.5. U.S. Market Size (US$ Mn) Forecast, byApplication Type, 2016–2026
10.5.1. DevOps
10.5.2. Application services
10.5.3. Analytics
10.5.4. Watson
10.5.5. Mobile
10.5.6. IoT
10.5.7. Others
10.6. U.S. Market Size (US$ Mn) Forecast, byEnd-user,2016–2026
10.6.1. BFSI
10.6.2. IT & Telecom
10.6.3. Healthcare
10.6.4. Retail
10.6.5. Federal
10.6.6. Media & Entertainment
10.6.7. Others
10.7. U.S. Market Size (US$ Mn) Forecast, byDeployment Model,2016–2026
10.7.1. Public
10.7.2. Dedicated
10.7.3. Private
10.8. Canada Market Size (US$ Mn) Forecast, byApplication Type, 2016–2026
10.8.1. DevOps
10.8.2. Application services
10.8.3. Analytics
10.8.4. Watson
10.8.5. Mobile
10.8.6. IoT
10.8.7. Others
10.9. Canada Market Size (US$ Mn) Forecast, byEnd-user,2016–2026
10.9.1. BFSI
10.9.2. IT & Telecom
10.9.3. Healthcare
10.9.4. Retail
10.9.5. Federal
10.9.6. Media & Entertainment
10.9.7. Others
10.10. Canada Market Size (US$ Mn) Forecast, byDeployment Model,2016–2026
10.10.1. Public
10.10.2. Dedicated
10.10.3. Private
10.11. Rest of America Market Size (US$ Mn) Forecast, byApplication Type, 2016–2026
10.11.1. DevOps
10.11.2. Application services
10.11.3. Analytics
10.11.4. Watson
10.11.5. Mobile
10.11.6. IoT
10.11.7. Others
10.12. Rest of America Market Size (US$ Mn) Forecast, byEnd-user,2016–2026
10.12.1. BFSI
10.12.2. IT & Telecom
10.12.3. Healthcare
10.12.4. Retail
10.12.5. Federal
10.12.6. Media & Entertainment
10.12.7. Others
10.13. Rest of America Market Size (US$ Mn) Forecast, byDeployment Model,2016–2026
10.13.1. Public
10.13.2. Dedicated
10.13.3. Private
10.14. Market Attractiveness Analysis
10.14.1. ByApplication Type
10.14.2. ByEnd-user
10.14.3. ByDeployment Model
10.14.4. By Country
11. Europe IBM Bluemix Services Market Analysis and Forecast
11.1. Market Size (US$ Mn) Forecast, byApplication Type, 2016–2026
11.1.1. DevOps
11.1.2. Application services
11.1.3. Analytics
11.1.4. Watson
11.1.5. Mobile
11.1.6. IoT
11.1.7. Others
11.2. Market Size (US$ Mn) Forecast, byEnd-user,2016–2026
11.2.1. BFSI
11.2.2. IT & Telecom
11.2.3. Healthcare
11.2.4. Retail
11.2.5. Federal
11.2.6. Media & Entertainment
11.2.7. Others
11.3. Market Size (US$ Mn) Forecast, byDeployment Model,2016–2026
11.3.1. Public
11.3.2. Dedicated
11.3.3. Private
11.4. Market Size (US$ Mn) Forecast, by Country, 2016–2026
11.4.1. The U.K.
11.4.2. Germany
11.4.3. France
11.4.4. Rest of Europe
11.5. U.K. Market Size (US$ Mn) Forecast, byApplication Type, 2016–2026
11.5.1. DevOps
11.5.2. Application services
11.5.3. Analytics
11.5.4. Watson
11.5.5. Mobile
11.5.6. IoT
11.5.7. Others
11.6. U.K. Market Size (US$ Mn) Forecast, byEnd-user,2016–2026
11.6.1. BFSI
11.6.2. IT & Telecom
11.6.3. Healthcare
11.6.4. Retail
11.6.5. Federal
11.6.6. Media & Entertainment
11.6.7. Others
11.7. U.K. Market Size (US$ Mn) Forecast, byDeployment Model,2016–2026
11.7.1. Public
11.7.2. Dedicated
11.7.3. Private
11.8. GermanyMarket Size (US$ Mn) Forecast, byApplication Type, 2016–2026
11.8.1. DevOps
11.8.2. Application services
11.8.3. Analytics
11.8.4. Watson
11.8.5. Mobile
11.8.6. IoT
11.8.7. Others
11.9. GermanyMarket Size (US$ Mn) Forecast, byEnd-user,2016–2026
11.9.1. BFSI
11.9.2. IT & Telecom
11.9.3. Healthcare
11.9.4. Retail
11.9.5. Federal
11.9.6. Media & Entertainment
11.9.7. Others
11.10. GermanyMarket Size (US$ Mn) Forecast, byDeployment Model,2016–2026
11.10.1. Public
11.10.2. Dedicated
11.10.3. Private
11.11. FranceMarket Size (US$ Mn) Forecast, byApplication Type, 2016–2026
11.11.1. DevOps
11.11.2. Application services
11.11.3. Analytics
11.11.4. Watson
11.11.5. Mobile
11.11.6. IoT
11.11.7. Others
11.12. FranceMarket Size (US$ Mn) Forecast, byEnd-user,2016–2026
11.12.1. BFSI
11.12.2. IT & Telecom
11.12.3. Healthcare
11.12.4. Retail
11.12.5. Federal
11.12.6. Media & Entertainment
11.12.7. Others
11.13. FranceMarket Size (US$ Mn) Forecast, byDeployment Model,2016–2026
11.13.1. Public
11.13.2. Dedicated
11.13.3. Private
11.14. Rest of EuropeMarket Size (US$ Mn) Forecast, byApplication Type, 2016–2026
11.14.1. DevOps
11.14.2. Application services
11.14.3. Analytics
11.14.4. Watson
11.14.5. Mobile
11.14.6. IoT
11.14.7. Others
11.15. Rest of EuropeMarket Size (US$ Mn) Forecast, byEnd-user,2016–2026
11.15.1. BFSI
11.15.2. IT & Telecom
11.15.3. Healthcare
11.15.4. Retail
11.15.5. Federal
11.15.6. Media & Entertainment
11.15.7. Others
11.16. Rest of EuropeMarket Size (US$ Mn) Forecast, byDeployment Model,2016–2026
11.16.1. Public
11.16.2. Dedicated
11.16.3. Private
11.17. Market Attractiveness Analysis
11.17.1. ByApplication Type
11.17.2. ByEnd-user
11.17.3. By Deployment Model
11.17.4. By Country
12. Asia Pacific IBM Bluemix Services Market Analysis and Forecast
12.1. Market Size (US$ Mn) Forecast, byApplication Type, 2016–2026
12.1.1. DevOps
12.1.2. Application services
12.1.3. Analytics
12.1.4. Watson
12.1.5. Mobile
12.1.6. IoT
12.1.7. Others
12.2. Market Size (US$ Mn) Forecast, byEnd-user,2016–2026
12.2.1. BFSI
12.2.2. IT & Telecom
12.2.3. Healthcare
12.2.4. Retail
12.2.5. Federal
12.2.6. Media & Entertainment
12.2.7. Others
12.3. Market Size (US$ Mn) Forecast, byDeployment Model,2016–2026
12.3.1. Public
12.3.2. Dedicated
12.3.3. Private
12.4. Market Size (US$ Mn) Forecast, by Country, 2016–2026
12.4.1. India
12.4.2. Japan
12.4.3. China
12.4.4. Rest of Asia Pacific
12.5. IndiaMarket Size (US$ Mn) Forecast, byApplication Type, 2016–2026
12.5.1. DevOps
12.5.2. Application services
12.5.3. Analytics
12.5.4. Watson
12.5.5. Mobile
12.5.6. IoT
12.5.7. Others
12.6. IndiaMarket Size (US$ Mn) Forecast, byEnd-user,2016–2026
12.6.1. BFSI
12.6.2. IT & Telecom
12.6.3. Healthcare
12.6.4. Retail
12.6.5. Federal
12.6.6. Media & Entertainment
12.6.7. Others
12.7. IndiaMarket Size (US$ Mn) Forecast, byDeployment Model,2016–2026
12.7.1. Public
12.7.2. Dedicated
12.7.3. Private
12.8. JapanMarket Size (US$ Mn) Forecast, byApplication Type, 2016–2026
12.8.1. DevOps
12.8.2. Application services
12.8.3. Analytics
12.8.4. Watson
12.8.5. Mobile
12.8.6. IoT
12.8.7. Others
12.9. JapanMarket Size (US$ Mn) Forecast, byEnd-user,2016–2026
12.9.1. BFSI
12.9.2. IT & Telecom
12.9.3. Healthcare
12.9.4. Retail
12.9.5. Federal
12.9.6. Media & Entertainment
12.9.7. Others
12.10. JapanMarket Size (US$ Mn) Forecast, byDeployment Model,2016–2026
12.10.1. Public
12.10.2. Dedicated
12.10.3. Private
12.11. ChinaMarket Size (US$ Mn) Forecast, byApplication Type, 2016–2026
12.11.1. DevOps
12.11.2. Application services
12.11.3. Analytics
12.11.4. Watson
12.11.5. Mobile
12.11.6. IoT
12.11.7. Others
12.12. ChinaMarket Size (US$ Mn) Forecast, byEnd-user,2016–2026
12.12.1. BFSI
12.12.2. IT & Telecom
12.12.3. Healthcare
12.12.4. Retail
12.12.5. Federal
12.12.6. Media & Entertainment
12.12.7. Others
12.13. ChinaMarket Size (US$ Mn) Forecast, byDeployment Model,2016–2026
12.13.1. Public
12.13.2. Dedicated
12.13.3. Private
12.14. Rest of Asia PacificMarket Size (US$ Mn) Forecast, byApplication Type, 2016–2026
12.14.1. DevOps
12.14.2. Application services
12.14.3. Analytics
12.14.4. Watson
12.14.5. Mobile
12.14.6. IoT
12.14.7. Others
12.15. Rest of Asia PacificMarket Size (US$ Mn) Forecast, byEnd-user,2016–2026
12.15.1. BFSI
12.15.2. IT & Telecom
12.15.3. Healthcare
12.15.4. Retail
12.15.5. Federal
12.15.6. Media & Entertainment
12.15.7. Others
12.16. Rest of Asia Pacific Market Size (US$ Mn) Forecast, byDeployment Model,2016–2026
12.16.1. Public
12.16.2. Dedicated
12.16.3. Private
12.17. Market Attractiveness Analysis
12.17.1. ByApplication Type
12.17.2. ByEnd-user
12.17.3. By Deployment Model
12.17.4. By Country
13. Middle East & Africa (MEA) IBM Bluemix Services Market Analysis and Forecast
13.1. Market Size (US$ Mn) Forecast, byApplication Type, 2016–2026
13.1.1. DevOps
13.1.2. Application services
13.1.3. Analytics
13.1.4. Watson
13.1.5. Mobile
13.1.6. IoT
13.1.7. Others
13.2. Market Size (US$ Mn) Forecast, byEnd-user,2016–2026
13.2.1. BFSI
13.2.2. IT & Telecom
13.2.3. Healthcare
13.2.4. Retail
13.2.5. Federal
13.2.6. Media & Entertainment
13.2.7. Others
13.3. Market Size (US$ Mn) Forecast, byDeployment Model,2016–2026
13.3.1. Public
13.3.2. Dedicated
13.3.3. Private
13.4. Market Size (US$ Mn) Forecast, by Country, 2016–2026
13.4.1. GCC Countries
13.4.2. South Africa
13.4.3. Rest of Middle East & Africa
13.5. GCC Countries Market Size (US$ Mn) Forecast, byApplication Type, 2016–2026
13.5.1. DevOps
13.5.2. Application services
13.5.3. Analytics
13.5.4. Watson
13.5.5. Mobile
13.5.6. IoT
13.5.7. Others
13.6. GCC CountriesMarket Size (US$ Mn) Forecast, byEnd-user,2016–2026
13.6.1. BFSI
13.6.2. IT & Telecom
13.6.3. Healthcare
13.6.4. Retail
13.6.5. Federal
13.6.6. Media & Entertainment
13.6.7. Others
13.7. GCC CountriesMarket Size (US$ Mn) Forecast, byDeployment Model,2016–2026
13.7.1. Public
13.7.2. Dedicated
13.7.3. Private
13.8. South AfricaMarket Size (US$ Mn) Forecast, byApplication Type, 2016–2026
13.8.1. DevOps
13.8.2. Application services
13.8.3. Analytics
13.8.4. Watson
13.8.5. Mobile
13.8.6. IoT
13.8.7. Others
13.9. South AfricaMarket Size (US$ Mn) Forecast, byEnd-user,2016–2026
13.9.1. BFSI
13.9.2. IT & Telecom
13.9.3. Healthcare
13.9.4. Retail
13.9.5. Federal
13.9.6. Media & Entertainment
13.9.7. Others
13.10. South AfricaMarket Size (US$ Mn) Forecast, byDeployment Model,2016–2026
13.10.1. Public
13.10.2. Dedicated
13.10.3. Private
13.11. Rest of Middle East & Africa Market Size (US$ Mn) Forecast, byApplication Type, 2016–2026
13.11.1. DevOps
13.11.2. Application services
13.11.3. Analytics
13.11.4. Watson
13.11.5. Mobile
13.11.6. IoT
13.11.7. Others
13.12. Rest of Middle East & Africa Market Size (US$ Mn) Forecast, byEnd-user, 2016–2026
13.12.1. BFSI
13.12.2. IT & Telecom
13.12.3. Healthcare
13.12.4. Retail
13.12.5. Federal
13.12.6. Media & Entertainment
13.12.7. Others
13.13. Rest of Middle East & Africa Market Size (US$ Mn) Forecast, byDeployment Model,2016–2026
13.13.1. Public
13.13.2. Dedicated
13.13.3. Private
13.14. Market Attractiveness Analysis
13.14.1. ByApplication Type
13.14.2. ByEnd-user
13.14.3. By Deployment Model
13.14.4. By Country
14. South America IBM Bluemix Services Market Analysis and Forecast
14.1. Market Size (US$ Mn) Forecast, byApplication Type, 2016–2026
14.1.1. DevOps
14.1.2. Application services
14.1.3. Analytics
14.1.4. Watson
14.1.5. Mobile
14.1.6. IoT
14.1.7. Others
14.2. Market Size (US$ Mn) Forecast, byEnd-user,2016–2026
14.2.1. BFSI
14.2.2. IT & Telecom
14.2.3. Healthcare
14.2.4. Retail
14.2.5. Federal
14.2.6. Media & Entertainment
14.2.7. Others
14.3. Market Size (US$ Mn) Forecast, byDeployment Model,2016–2026
14.3.1. Public
14.3.2. Dedicated
14.3.3. Private
14.4. Market Size (US$ Mn) Forecast, by Country, 2016–2026
14.4.1. Brazil
14.4.2. Rest of South America
14.5. Brazil Market Size (US$ Mn) Forecast, byApplication Type, 2016–2026
14.5.1. DevOps
14.5.2. Application services
14.5.3. Analytics
14.5.4. Watson
14.5.5. Mobile
14.5.6. IoT
14.5.7. Others
14.6. Brazil Market Size (US$ Mn) Forecast, byEnd-user,2016–2026
14.6.1. BFSI
14.6.2. IT & Telecom
14.6.3. Healthcare
14.6.4. Retail
14.6.5. Federal
14.6.6. Media & Entertainment
14.6.7. Others
14.7. Brazil Market Size (US$ Mn) Forecast, byDeployment Model,2016–2026
14.7.1. Public
14.7.2. Dedicated
14.7.3. Private
14.8. Rest of South America Market Size (US$ Mn) Forecast, byApplication Type, 2016–2026
14.8.1. DevOps
14.8.2. Application services
14.8.3. Analytics
14.8.4. Watson
14.8.5. Mobile
14.8.6. IoT
14.8.7. Others
14.9. Rest of South America Market Size (US$ Mn) Forecast, byEnd-user,2016–2026
14.9.1. BFSI
14.9.2. IT & Telecom
14.9.3. Healthcare
14.9.4. Retail
14.9.5. Federal
14.9.6. Media & Entertainment
14.9.7. Others
14.10. Rest of South America Market Size (US$ Mn) Forecast, byDeployment Model,2016–2026
14.10.1. Public
14.10.2. Dedicated
14.10.3. Private
14.11. Market Attractiveness Analysis
14.11.1. ByApplication Type
14.11.2. ByEnd-user
14.11.3. ByDeployment Model
14.11.4. By Country
15. Competition Landscape
15.1. Market Player – Competition Matrix
15.2. Market Share Analysis by Company (2017)
15.3. Company Profiles (Details – Overview, Financials, Recent Developments, Strategy)
15.3.1. Tata Consultancy Services Limited
15.3.1.1. Market Presence, by Segment
15.3.1.2. Strategy
15.3.1.3. Revenue and Operating Profits
15.3.2. Infosys Limited
15.3.2.1. Market Presence, by Segment
15.3.2.2. Strategy
15.3.2.3. Revenue and Operating Profits
15.3.3. Capgemini
15.3.3.1. Market Presence, by Segment
15.3.3.2. Strategy
15.3.3.3. Revenue and Operating Profits
15.3.4. Robert Bosch GmbH
15.3.4.1. Market Presence, by Segment
15.3.4.2. Strategy
15.3.4.3. Revenue and Operating Profits
15.3.5. Datamato Technologies Pvt. Ltd.
15.3.5.1. Market Presence, by Segment
15.3.5.2. Strategy
15.3.5.3. Revenue and Operating Profits
15.3.6. Prolifics, Inc.
15.3.6.1. Market Presence, by Segment
15.3.6.2. Strategy
15.3.6.3. Revenue and Operating Profits
15.3.7. Tech Mahindra Limited
15.3.7.1. Market Presence, by Segment
15.3.7.2. Strategy
15.3.7.3. Revenue and Operating Profits
15.3.8. DXC Technology Limited
15.3.8.1. Market Presence, by Segment
15.3.8.2. Strategy
15.3.8.3. Revenue and Operating Profits
15.3.9. Perficient Inc.
15.3.9.1. Market Presence, by Segment
15.3.9.2. Strategy
15.3.9.3. Revenue and Operating Profits
15.3.10. Wipro Limited
15.3.10.1. Market Presence, by Segment
15.3.10.2. Strategy
15.3.10.3. Revenue and Operating Profits
16. Key Takeaways
List of Tables
Table 01: Global IBM Bluemix Services Market Size (US$ Mn) Forecast, By Application Type, 2016–2026
Table 02: Global IBM Bluemix Services Market Size (US$ Mn) Forecast, By End-User, 2016–2026
Table 03: Global IBM Bluemix Services Market Size (US$ Mn) Forecast, By Deployment Model, 2016–2026
Table 04: Global IBM Bluemix Services Market Size (US$ Mn) Forecast, By Region, 2016–2026
Table 05: North America IBM Bluemix Services Market Size (US$ Mn) Forecast, By Application Type, 2016–2026
Table 06: North America IBM Bluemix Services Market Size (US$ Mn) Forecast, By End-User, 2016–2026
Table 07: North America IBM Bluemix Services Market Size (US$ Mn) Forecast, By Deployment Model, 2016–2026
Table 08: North America IBM Bluemix Services Market Size (US$ Mn) Forecast, By Country, 2016–2026
Table 09: The U.S. IBM Bluemix Services Market Size (US$ Mn) Forecast, By Application Type, 2016–2026
Table 10: The U.S. IBM Bluemix Services Market Size (US$ Mn) Forecast, By End-User, 2016–2026
Table 11: The U.S. IBM Bluemix Services Market Size (US$ Mn) Forecast, By Deployment Model, 2016–2026
Table 12: Canada IBM Bluemix Services Market Size (US$ Mn) Forecast, By Application Type, 2016–2026
Table 13: Canada IBM Bluemix Services Market Size (US$ Mn) Forecast, By End-User, 2016–2026
Table 14: Canada IBM Bluemix Services Market Size (US$ Mn) Forecast, By Deployment Model, 2016–2026
Table 15: Rest of North America IBM Bluemix Services Market Size (US$ Mn) Forecast, By Application Type, 2016–2026
Table 16: Rest of North America IBM Bluemix Services Market Size (US$ Mn) Forecast, By End-User, 2016–2026
Table 17: Rest of North America IBM Bluemix Services Market Size (US$ Mn) Forecast, By Deployment Model, 2016–2026
Table 18: Europe IBM Bluemix Services Market Size (US$ Mn) Forecast, By Application Type, 2016–2026
Table 19: Europe IBM Bluemix Services Market Size (US$ Mn) Forecast, By End-User, 2016–2026
Table 20: Europe IBM Bluemix Services Market Size (US$ Mn) Forecast, By Deployment Model, 2016–2026
Table 21: Europe IBM Bluemix Services Market Size (US$ Mn) Forecast, By Country, 2016–2026
Table 22: The U.K. IBM Bluemix Services Market Size (US$ Mn) Forecast, By Application Type, 2016–2026
Table 23: The U.K. IBM Bluemix Services Market Size (US$ Mn) Forecast, By End-User, 2016–2026
Table 24: The U.K. IBM Bluemix Services Market Size (US$ Mn) Forecast, By Deployment Model, 2016–2026
Table 25: Germany IBM Bluemix Services Market Size (US$ Mn) Forecast, By Application Type, 2016–2026
Table 26: Germany IBM Bluemix Services Market Size (US$ Mn) Forecast, By End-User, 2016–2026
Table 27: Germany IBM Bluemix Services Market Size (US$ Mn) Forecast, By Deployment Model, 2016–2026
Table 28: France IBM Bluemix Services Market Size (US$ Mn) Forecast, By Application Type, 2016–2026
Table 29: France IBM Bluemix Services Market Size (US$ Mn) Forecast, By End-User, 2016–2026
Table 30: France IBM Bluemix Services Market Size (US$ Mn) Forecast, By Deployment Model, 2016–2026
Table 31: Rest of Europe IBM Bluemix Services Market Size (US$ Mn) Forecast, By Application Type, 2016–2026
Table 32: Rest of Europe IBM Bluemix Services Market Size (US$ Mn) Forecast, By End-User, 2016–2026
Table 33: Rest of Europe IBM Bluemix Services Market Size (US$ Mn) Forecast, By Deployment Model, 2016–2026
Table 34: Asia Pacific IBM Bluemix Services Market Size (US$ Mn) Forecast, By Application Type, 2016–2026
Table 35: Asia Pacific IBM Bluemix Services Market Size (US$ Mn) Forecast, By End-User, 2016–2026
Table 36: Asia Pacific IBM Bluemix Services Market Size (US$ Mn) Forecast, By Deployment Model, 2016–2026
Table 37: Asia Pacific IBM Bluemix Services Market Size (US$ Mn) Forecast, By Country, 2016–2026
Table 38: India IBM Bluemix Services Market Size (US$ Mn) Forecast, By Application Type, 2016–2026
Table 39: India IBM Bluemix Services Market Size (US$ Mn) Forecast, By End-User, 2016–2026
Table 40: India IBM Bluemix Services Market Size (US$ Mn) Forecast, By Deployment Model, 2016–2026
Table 41: Japan IBM Bluemix Services Market Size (US$ Mn) Forecast, By Application Type, 2016–2026
Table 42: Japan IBM Bluemix Services Market Size (US$ Mn) Forecast, By End-User, 2016–2026
Table 43: Japan IBM Bluemix Services Market Size (US$ Mn) Forecast, By Deployment Model, 2016–2026
Table 44: China IBM Bluemix Services Market Size (US$ Mn) Forecast, By Application Type, 2016–2026
Table 45: Rest of Asia Pacific IBM Bluemix Services Market Size (US$ Mn) Forecast, By End-User, 2016–2026
Table 46: China IBM Bluemix Services Market Size (US$ Mn) Forecast, By Deployment Model, 2016–2026
Table 47: Rest of Asia Pacific IBM Bluemix Services Market Size (US$ Mn) Forecast, By Application Type, 2016–2026
Table 48: Rest of Asia Pacific IBM Bluemix Services Market Size (US$ Mn) Forecast, By End-User, 2016–2026
Table 49: Rest of Asia Pacific IBM Bluemix Services Market Size (US$ Mn) Forecast, By Deployment Model, 2016–2026
Table 50: Middle East & Africa IBM Bluemix Services Market Size (US$ Mn) Forecast, By Application Type, 2016–2026
Table 51: Middle East & Africa IBM Bluemix Services Market Size (US$ Mn) Forecast, By End-User, 2016–2026
List of Figures
Figure 01: Market Revenue (US$ Mn) Growth Analysis By Application Type, 2018-2026
Figure 02: Market Revenue (US$ Mn) Growth Analysis By End-User, 2018-2026
Figure 03: Market Revenue (US$ Mn) Growth Analysis By Deployment Model, 2018-2026
Figure 04: Market Revenue (US$ Mn) Growth Analysis By Region, 2018-2026
Figure 05: Global IBM Bluemix Services Market Size (US$ Mn) Forecast, 2016 - 2026
Figure 06: Global IBM Bluemix Services Market Y-o-Y Growth (Value %) Forecast, 2016 - 2026
Figure 07: Global IBM Bluemix Services Market Revenue Share Analysis, By Application Type, 2018 and 2026
Figure 08: Global IBM Bluemix Services Market Revenue (US$ Mn) Growth Analysis By Application Type, 2018-2026
Figure 09: Global IBM Bluemix Services Market Attractiveness Analysis By Application Type
Figure 10: Global IBM Bluemix Services Market Value Share Analysis, By End-User, 2018 and 2026
Figure 11: Global IBM Bluemix Services Market Revenue (US$ Mn) Growth Analysis By End-User, 2018-2026
Figure 12: Global IBM Bluemix Services Market Attractiveness Analysis By End-User
Figure 13: Global IBM Bluemix Services Market Value Share Analysis, By Deployment Model, 2018 and 2026
Figure 14: Global IBM Bluemix Services Market Revenue (US$ Mn) Growth Analysis By Deployment Model, 2018-2026
Figure 15: Global IBM Bluemix Services Market Attractiveness Analysis By Deployment Model
Figure 16: Global IBM Bluemix Services Market Revenue (US$ Mn) Growth Analysis By Region, 2018-2026
Figure 17: Global IBM Bluemix Services Market Attractiveness Analysis By Region
Figure 18: North America IBM Bluemix Services Market Size (US$ Mn) Forecast, 2016–2026
Figure 19: North America IBM Bluemix Services Market Size Y-o-Y Growth Projections, 2016–2026
Figure 20: North America IBM Bluemix Services Market Revenue Share Analysis, By Application Type, 2018 and 2026
Figure 21: North America IBM Bluemix Services Market Revenue Share Analysis, By End-User, 2018 and 2026
Figure 22: North America IBM Bluemix Services Market Revenue Share Analysis, By Deployment Model, 2018 and 2026
Figure 23: North America IBM Bluemix Services Market Revenue Share Analysis, By Country, 2018 and 2026
Figure 24: North America IBM Bluemix Services Market Revenue (US$ Mn) Growth Analysis By Application Type, 2018-2026
Figure 25: North America IBM Bluemix Services Market Revenue (US$ Mn) Growth Analysis By End-User, 2018-2026
Figure 26: North America IBM Bluemix Services Market Revenue share (%) Analysis By Deployment Model, 2018-2026
Figure 27: North America IBM Bluemix Services Market Revenue (US$ Mn) Growth Analysis By Country, 2018-2026
Figure 28: The U.S. IBM Bluemix Services Market Revenue Share Analysis, By Application Type, 2018 and 2026
Figure 29: The U.S. IBM Bluemix Services Market Revenue Share Analysis, By End-User, 2018 and 2026
Figure 30: The U.S. IBM Bluemix Services Market Revenue Share Analysis, By Deployment Model, 2018 and 2026
Figure 31: Canada IBM Bluemix Services Market Revenue Share Analysis, By Application Type, 2018 and 2026
Figure 32: Canada IBM Bluemix Services Market Revenue Share Analysis, By End-User, 2018 and 2026
Figure 33: Canada IBM Bluemix Services Market Revenue Share Analysis, By Deployment Model, 2018 and 2026
Figure 34: North America IBM Bluemix Services Market Attractiveness Analysis By Application Type
Figure 35: North America IBM Bluemix Services Market Attractiveness Analysis By End-User
Figure 36: North America IBM Bluemix Services Market Attractiveness Analysis By Deployment Model
Figure 37: North America IBM Bluemix Services Market Attractiveness Analysis By Country
Figure 38: Europe IBM Bluemix Services Market Size (US$ Mn) Forecast, 2016–2026
Figure 39: Europe IBM Bluemix Services Market Size Y-o-Y Growth Projections, 2016–2026
Figure 40: Europe IBM Bluemix Services Market Revenue Share Analysis, By Application Type, 2018 and 2026
Figure 41: Europe IBM Bluemix Services Market Revenue Share Analysis, By End-User, 2018 and 2026
Figure 42: Europe IBM Bluemix Services Market Revenue Share Analysis, By Deployment Model, 2018 and 2026
Figure 43: Europe IBM Bluemix Services Market Revenue Share Analysis, By Country, 2018 and 2026
Figure 44: Europe IBM Bluemix Services Market Revenue (US$ Mn) Growth Analysis By Application Type, 2018-2026
Figure 45: Europe IBM Bluemix Services Market Revenue (US$ Mn) Growth Analysis By End-User, 2018-2026
Figure 46: Europe IBM Bluemix Services Market Revenue share (%) Analysis By Deployment Model, 2018-2026
Figure 47: Europe IBM Bluemix Services Market Revenue (US$ Mn) Growth Analysis By Country, 2018-2026
Figure 48: The U.K. IBM Bluemix Services Market Revenue Share Analysis, By Application Type, 2018 and 2026
Figure 49: The U.K. IBM Bluemix Services Market Revenue Share Analysis, By End-User, 2018 and 2026
Figure 50: The U.K. IBM Bluemix Services Market Revenue Share Analysis, By Deployment Model, 2018 and 2026
Figure 51: Germany IBM Bluemix Services Market Revenue Share Analysis, By Application Type, 2018 and 2026
Figure 52: Germany IBM Bluemix Services Market Revenue Share Analysis, By End-User, 2018 and 2026
Figure 53: Germany IBM Bluemix Services Market Revenue Share Analysis, By Deployment Model, 2018 and 2026
Figure 54: France IBM Bluemix Services Market Revenue Share Analysis, By Application Type, 2018 and 2026
Figure 55: France IBM Bluemix Services Market Revenue Share Analysis, By End-User, 2018 and 2026
Figure 56: France IBM Bluemix Services Market Revenue Share Analysis, By Deployment Model, 2018 and 2026
Figure 57: Europe IBM Bluemix Services Market Attractiveness Analysis By Application Type
Figure 58: Europe IBM Bluemix Services Market Attractiveness Analysis By End-User
Figure 59: Europe IBM Bluemix Services Market Attractiveness Analysis By Deployment Model
Figure 60: Europe IBM Bluemix Services Market Attractiveness Analysis, By Countries
Figure 61: Asia Pacific IBM Bluemix Services Market Size (US$ Mn) Forecast, 2016–2026
Figure 62: Asia Pacific IBM Bluemix Services Market Size Y-o-Y Growth Projections, 2016–2026
Figure 63: Asia Pacific IBM Bluemix Services Market Revenue Share Analysis, By Application Type, 2018 and 2026
Figure 64: Asia Pacific IBM Bluemix Services Market Revenue Share Analysis, By End-User, 2018 and 2026
Figure 65: Asia Pacific IBM Bluemix Services Market Revenue Share Analysis, By Deployment Model, 2018 and 2026
Figure 66: Asia Pacific IBM Bluemix Services Market Revenue Share Analysis, By Country, 2018 and 2026
Figure 67: Asia Pacific IBM Bluemix Services Market Revenue (US$ Mn) Growth Analysis By Application Type, 2018-2026
Figure 68: Asia Pacific IBM Bluemix Services Market Revenue (US$ Mn) Growth Analysis By End-User, 2018-2026
Figure 69: Asia Pacific IBM Bluemix Services Market Revenue share (%) Analysis By Deployment Model, 2018-2026
Figure 70: Asia Pacific IBM Bluemix Services Market Revenue (US$ Mn) Growth Analysis By Country, 2018-2026
Figure 71: India IBM Bluemix Services Market Revenue Share Analysis, By Application Type, 2018 and 2026
Figure 72: India IBM Bluemix Services Market Revenue Share Analysis, By End-User, 2018 and 2026
Figure 73: India IBM Bluemix Services Market Revenue Share Analysis, By Deployment Model, 2018 and 2026
Figure 74: Japan IBM Bluemix Services Market Revenue Share Analysis, By Application Type, 2018 and 2026
Figure 75: Japan IBM Bluemix Services Market Revenue Share Analysis, By End-User, 2018 and 2026
Figure 76: Japan IBM Bluemix Services Market Revenue Share Analysis, By Deployment Model, 2018 and 2026
Figure 77: China IBM Bluemix Services Market Revenue Share Analysis, By Application Type, 2018 and 2026
Figure 78: China IBM Bluemix Services Market Revenue Share Analysis, By End-User, 2018 and 2026
Figure 79: China IBM Bluemix Services Market Revenue Share Analysis, By Deployment Model, 2018 and 2026
Figure 80: Asia Pacific IBM Bluemix Services Market Attractiveness Analysis By Application Type
Figure 81: Asia Pacific IBM Bluemix Services Market Attractiveness Analysis By End-User
Figure 82: Asia Pacific IBM Bluemix Services Market Attractiveness Analysis By Deployment Model
Figure 83: Asia Pacific IBM Bluemix Services Market Attractiveness Analysis, By Country
Figure 84: Middle East & Africa IBM Bluemix Services Market Size (US$ Mn) Forecast, 2016–2026
Figure 85: Middle East & Africa IBM Bluemix Services Market Size Y-o-Y Growth Projections, 2016–2026
Figure 86: Middle East & Africa IBM Bluemix Services Market Revenue Share Analysis, By Application Type, 2018 and 2026
Figure 87: Middle East & Africa IBM Bluemix Services Market Revenue Share Analysis, By End-User, 2018 and 2026
Figure 88: Middle East & Africa IBM Bluemix Services Market Revenue Share Analysis, By Deployment Model, 2018 and 2026
Figure 89: Middle East & Africa IBM Bluemix Services Market Revenue Share Analysis, By Country, 2018 and 2026
Figure 90: Middle East & Africa IBM Bluemix Services Market Revenue (US$ Mn) Growth Analysis By Application Type, 2018-2026
Figure 91: Middle East & Africa IBM Bluemix Services Market Revenue (US$ Mn) Growth Analysis By End-User, 2018-2026
Copyright © Transparency Market Research, Inc. All Rights reserved
Trust Online

IBM Bluemix Services Market Insights, 2018 - 2026