
Reports
Reports
Global Hyper Spectral Imaging System Market: Snapshot
The hyper spectral imaging system (HIS) involves collection and processing of data which is collected across an electromagnetic spectrum. Hyper spectral imaging systems enable obtaining spectrum for every pixel in a particular image or a sequence of images. Information provided by hyper spectral imaging systems has huge data access, which facilitates in the identification of an object. The hyper spectral imaging system are used to find shortwave infra-red (SWIR) spectrum region for providing in-depth information about the composition of a medicine. This is not possible with the help of normal or standard imaging processes.
Considering benefits this technology provides, there is growing adoption of hyper spectral imaging system in the healthcare and medicine industry. The system assists in the diagnosis of numerous life-threatening diseases. Besides this, it is used in detecting oral medical complicacies without drilling or X-rays. While the global hyper spectral imaging system market is forecast to continue benefiting from benefits the system provides across diverse industrial verticals, the cost of acquiring these systems will remain a major bottleneck.
Nevertheless, with technological innovations, reduction is price can be achieved. Price reduction will create lucrative opportunities for the market’s expansion in the near future, especially in agriculture and food processing industries. Given the scenario, Transparency Market Research (TMR) projects the global hyper spectral imaging system market to exhibit a CAGR of 8.4% between 2016 and 2024. At this pace, the market’s valuation will reach US$18.88 bn in 2024, from US$9.12 bn in 2015.
Demand for Outdoor Imaging Systems to Rise at Positive Pace
Based on systems, PC Base, outdoor camera, airborne, and others constitute the key segments in the global hyper spectral imaging market. Of these, the outdoor hyper spectral imaging systems segment emerged dominant in 2015 with a valuation of US$1.61 bn. These systems can be portable tripod mounted or fixed and are considered more rugged than other types of HIS systems. The outdoor camera hyper spectral imaging systems cover 350 to 1700 nm spectral range and are widely preferred in field and defense applications. During the course of the forecast period, the segment is likely to exhibit robust growth.
In terms of end-use industry, the global market has been segmented into military surveillance and homeland security, industrial, medical diagnostics, food processing, mineralogy, astronomy, and others. There is growing preference in usage of hyper spectral imaging systems in the medical diagnostic sector. This will create considerable opportunities for the hyper spectral imaging system market over the next few years. The hyper spectral imaging system enables early detection and treatment of life threatening medical conditions. Furthermore, the increasing application of hyper spectral imaging system in dentistry for the detection of tooth decay and other dental conditions will aid the market’s expansion in the coming years.
Asia Pacific Hyper Spectral Imaging System Market to Growth at Greater Pace
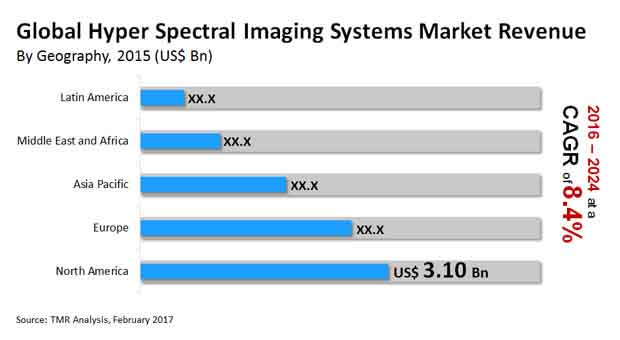
Regionally, the global hyper spectral imaging system market can be broadly classified into North America, Asia Pacific, Europe, the Middle East and Africa, and Latin America. Among these regions, North America accounted for the largest market share in the market in 2015, followed by Europe. However, as per TMR Asia Pacific is expected to grow at the fastest rate over the forecast period. Hyper spectral imaging system is finding a wide range of application across a diverse sectors in Asia Pacific. Many leading companies are setting up their manufacturing facilities in the region due to availability of raw material and cheap labor in the region. This is expected to drive the hyper spectral imaging system market in Asia Pacific.
Some of the key players in the hyper spectral imaging (HSI) systems market are Norsk Elektro Optikk (Norway), Corning Incorporated (U.S.), Applied Spectral Imaging, Inc. (U.S.), Specim Spectral Imaging Ltd. (Finland), Resonon Inc. (U.S.), Telops Inc. (Canada), Surface Optics Corporation (U.S.), Chemimage Corporation (U.S.), BaySpec Inc. (U.S.), Headwall Photonics, Inc. (U.S.), FLIR Systems (U.S.), Teledyne Technologies International Corp (U.S.), and Thermo Fisher Scientific (U.S.).
Chapter 1 Preface
1.1 Research Scope
1.2 Market Segmentation
1.3 Research Objectives
1.4 Key Question Answered
Chapter 2 Assumptions and Research Methodology
2.1 Report Assuptions and Acronyms Used
2.2 Research Methodolgy
Chapter 3 Executive Summary
Chapter 4 Global Hyper Spectral Imaging System Marke Dynamics
4.1 Introduction
4.2 Market Dynamics Drivers and Restraints Snapshot Analysis
4.2.1 Market Drivers
4.2.2 Market Restraints
4.2.3 Market Opportunities
4.3 Competitive Landscape
4.4.1 Market Attractiveness Analysis
4.4.2 Competitive Strategy adopted by leading players
4.4 Market Positioning of Key Players, 2015
Chapter 5 Global Hyper Spectral Imaging System Market Analysis By Systems
5.1 Key Findings
5.2 Introduction
5.3 Global Hyper Spectral Imaging Systems Market Size (US$ Bn) Forecast, By Systems, 2015–2024
5.4 Hyper Spectral Imaging Systems Market Analysis, By Systems, 2015–2024
Chapter 6 Global Hyper Spectral Imaging System Market Analysis, By End Use Industry
6.1 KeyFindings
6.2 Introduction
6.3 Global Hyper Spectral Imaging Systems Market Size (US$ Bn) Forecast, By End Use Industry, 2015–2024
6.4 Hyper Spectral Imaging Systems Market Analysis, By End Use Industry, 2015–2024
Chapter 7 Hyper Spectral Imaging System Market Analysis, By Region
7.1 Global Revenue Share Scenario, By Geography in 2015
7.2 Hyper Spectral Imaging Systems Market Forecast, by Region, By Systems
7.3 Hyper Spectral Imaging Systems Market Forecast, by Region End Use Industry
Section 8 North America Hyper Spectral Imaging System Market Analysis
8.1 Key Findings
8.2 North America Hyper Spectral Imaging System Market, Size (US$ Bn) Forecast, by Systems, 2015-2024
8.3 North America Hyper Spectral Imaging System Market, Size (US$ Bn) Forecast, By End Use Industry, 2015–2024
8.4 North America Hyper Spectral Imaging System Market, Analysis, by Country
Section 9 Europe Hyper Spectral Imaging System Market Analysis
9.1 Key Findings
9.2 Europe Hyper Spectral Imaging System Market, Size (US$ Bn) Forecast, by Systems, 2015-2024
9.3 Europe Hyper Spectral Imaging System Market, Size (US$ Bn) Forecast, By End Use Industry, 2015–2024
9.4 Europe Hyper Spectral Imaging System Market, Analysis, by Country
Section 10 Asia Pacific Hyper Spectral Imaging System Market Analysis
10.1 Key Findings
10.2 Asia Pacific Hyper Spectral Imaging System Market, Size (US$ Bn) Forecast, By Systems, 2015-2024
10.3 Asia Pacific Hyper Spectral Imaging System Market, Size (US$ Bn) Forecast, By End Use Industry, 2015–2024
10.4 Asia Pacific Hyper Spectral Imaging System Market, Analysis, By Country
Section 11 Middle East and Africa Hyper Spectral Imaging System Market Analysis
11.1 Key Findings
11.2 Middle East and Africa Hyper Spectral Imaging System Market, Size (US$ Bn) Forecast, By Systems, 2015-2024
11.3 Middle East and Africa Hyper Spectral Imaging System Market, Size (US$ Bn) Forecast, By End Use Industry, 2015–2024
11.4 Middle East and Africa Hyper Spectral Imaging System Market, Analysis, By Country
Section 12 Latin America Hyper Spectral Imaging System Market Analysis
12.1 Key Findings
12.2 Latin Amrica Hyper Spectral Imaging System Market, Size (US$ Bn) Forecast, By Systems, 2015-2024
12.3 Latin America Hyper Spectral Imaging System Market, Size (US$ Bn) Forecast, By End Use Industry, 2015–2024
12.4 Latin America Hyper Spectral Imaging System Market, Analysis, By Country
Chapter 13 Company Profiles
13.1 Headwall Photonics Inc.
13.1.1. Company Details
13.1.2. Company Description
13.1.3. Business Overview
13.1.4. SWOT Analysis
13.1.5. Financial Overview
13.1.6. Strategic Overview
13.2 Corning Incorporated
13.2.1. Company Details
13.2.2. Company Description
13.2.3. Business Overview
13.2.4. SWOT Analysis
13.2.5. Financial Overview
13.2.6. Strategic Overview
13.3 Norsk Elektro Optikk AS
13.3.1. Company Details
13.3.2. Company Description
13.3.3. Business Overview
13.3.4. SWOT Analysis
13.3.5. Financial Overview
13.3.6. Strategic Overview
13.4 Applied Spectral Imaging
13.4.1. Company Details
13.4.2. Company Description
13.4.3. Business Overview
13.4.4. SWOT Analysis
13.4.5. Financial Overview
13.4.6. Strategic Overview
13.5 Specim, Spectral Imaging Ltd
13.5.1. Company Details
13.5.2. Company Description
13.5.3. Business Overview
13.5.4. SWOT Analysis
13.5.5. Financial Overview
13.5.6. Strategic Overview
13.6 Resonon Inc.
13.6.1. Company Details
13.6.2. Company Description
13.6.3. Business Overview
13.6.4. SWOT Analysis
13.6.5. Financial Overview
13.6.6. Strategic Overview
13.7 Surface Optics Corporation
13.7.1. Company Details
13.7.2. Company Description
13.7.3. Business Overview
13.7.4. SWOT Analysis
13.7.5. Financial Overview
13.7.6. Strategic Overview
13.8 Telops Inc.
13.8.1. Company Details
13.8.2. Company Description
13.8.3. Business Overview
13.8.4. SWOT Analysis
13.8.5. Financial Overview
13.8.6 Strategic Overview
13.9 Chemimage Corporation
13.9.1. Company Details
13.9.2. Company Description
13.9.3. Business Overview
13.9.4. SWOT Analysis
13.9.5. Financial Overview
13.9.6 Strategic Overview
13.10 BaySpec Inc.
13.10.1. Company Details
13.10.2. Company Description
13.10.3. Business Overview
13.10.4. SWOT Analysis
13.10.5. Financial Overview
13.10.6 Strategic Overview
13.11 Teledyne Technologies
13.11.1. Company Details
13.11.2. Company Description
13.11.3. Business Overview
13.11.4. SWOT Analysis
13.11.5. Financial Overview
13.11.6 Strategic Overview
13.12 FLIR Systems Inc.
13.12.1. Company Details
13.12.2. Company Description
13.12.3. Business Overview
13.12.4. SWOT Analysis
13.12.5. Financial Overview
13.12.6 Strategic Overview
13.13 Thermo Fisher Scientific
13.13.1. Company Details
13.13.2. Company Description
13.13.3. Business Overview
13.13.4. SWOT Analysis
13.13.5. Financial Overview
13.13.6 Strategic Overview
List of Tables
TABLE 1 Global Hyper Spectral Imaging Systems Market Size (US$ Bn) Forecast, By Systems, 2015–2024
TABLE 2 Global Hyper Spectral Imaging Systems Market Size (US$ Bn) Forecast, By End Use Industry, 2015–2024
TABLE 3 Global Hyper Spectral Imaging Systems Market Size (US$ Bn) Forecast, By Systems, 2015–2024
TABLE 4 Global Hyper Spectral Imaging Systems Market Size (US$ Bn) Forecast, End Use Industry, 2015–2024
TABLE 5 North America Hyper Spectral Imaging Systems Market Size (US$ Bn) Forecast, by Systems, 2015–2024
TABLE 6 North America Hyper Spectral Imaging Systems Market Size (US$ Bn) Forecast, by End Use Industry, 2015–2024
TABLE 7 Europe Hyper Spectral Imaging Systems Market Size (US$ Mn) Forecast, by systems, 2015–2024
TABLE 8 Europe Hyper Spectral Imaging Systems Market Size (US$ Mn) Forecast, by systems, 2015–2024
TABLE 9 Asia Pacific Hyper Spectral Imaging Systems Market Size (US$ Mn) Forecast, by Systems, 2015–2024
TABLE 10 Asia Pacific Hyper Spectral Imaging Systems Market Size (US$ Mn) Forecast, by End Use Industry, 2015–2024
TABLE 11 Middle East and Africa Hyper Spectral Imaging Systems Market Size (US$ Mn) Forecast, by Systems, 2015–2024
TABLE 12 Middle East and Africa Hyper Spectral Imaging Systems Market Size (US$ Mn) Forecast, by End Use Industry, 2015–2024
TABLE 13 Latin America Hyper Spectral Imaging Systems Market Size (US$ Mn) Forecast, by Systems, 2015–2024
TABLE 14 Latin America Hyper Spectral Imaging Systems Market Size (US$ Mn) Forecast, by End Use Industry, 2015–2024
List of Figures
FIG. 1 Market Attractiveness Analysis, By Devices, 2015
FIG. 2 Market Share of key players, (%),2015
FIG. 3 Global PC Based Hyper Spectral Imaging Systems Market Revenue (USD Bn), 2015–2024
FIG. 4 Global Outdoor Camera Hyper Spectral Imaging Systems Market Revenue (USD Bn), 2015–2024
FIG. 5 Global Airborne Hyper Spectral Imaging Systems Market Revenue (USD Bn), 2015–2024
FIG. 6 Global Others Camera Hyper Spectral Imaging Systems Market Revenue (USD Bn), 2015–2024
FIG. 7 Global Military Surveillance Hyper Spectral Imaging Systems Market Revenue (USD Bn), 2015–2024
FIG. 8 Global Industrial Hyper Spectral Imaging Systems Market Revenue (USD Bn), 2015–2024
FIG. 9 Global Food Processing Hyper Spectral Imaging Systems Market Revenue (USD Bn), 2015–2024
FIG. 10 Global Food Processing Hyper Spectral Imaging Systems Market Revenue (USD Bn), 2015–2024
FIG. 11 Global Mineralogy Hyper Spectral Imaging Systems Market Revenue (USD Bn), 2015–2024
FIG. 12 Global Astronomy Hyper Spectral Imaging Systems Market Revenue (USD Bn), 2015–2024
FIG. 13 Global Others Hyper Spectral Imaging Systems Market Revenue (USD Bn), 2015–2024
FIG. 14 U.S. Hyper Spectral Imaging Systems Market Analysis, Revenue
FIG. 15 Canada Hyper Spectral Imaging Systems Market Analysis, Revenue
FIG. 16 Mexico Hyper Spectral Imaging Systems Market Analysis, Revenue
FIG. 17 The U.K. Hyper Spectral Imaging Systems Market Analysis, Revenue
FIG. 18 Germany Hyper Spectral Imaging Systems Market Analysis, Revenue
FIG. 19 The Netherland Hyper Spectral Imaging Systems Market Analysis, Revenue
FIG. 20 Rest of Europe Hyper Spectral Imaging Systems Market Analysis, Revenue
FIG. 21 China Hyper Spectral Imaging Systems Market Analysis, Revenue
FIG. 22 India Hyper Spectral Imaging Systems Market Analysis, Revenue
FIG. 23 Japan Hyper Spectral Imaging Systems Market Analysis, Revenue
FIG. 24 Oceania Hyper Spectral Imaging Systems Market Analysis, Revenue
FIG. 25 Rest of Asia Pacific Hyper Spectral Imaging Systems Market Analysis, Revenue
FIG. 26 UAE Hyper Spectral Imaging Systems Market Analysis, Revenue
FIG. 27 Saudi Arabia Hyper Spectral Imaging Systems Market Analysis, Revenue
FIG. 28 South Africa Hyper Spectral Imaging Systems Market Analysis, Revenue
FIG. 29 Others Hyper Spectral Imaging Systems Market Analysis, Revenue
FIG. 30 Brazil Hyper Spectral Imaging Systems Market Analysis, Revenue
FIG. 31 Argentina Hyper Spectral Imaging Systems Market Analysis, Revenue
FIG. 32 Others Hyper Spectral Imaging Systems Market Analysis, Revenue
Copyright © Transparency Market Research, Inc. All Rights reserved
Trust Online

Hyper Spectral Imaging System Market