
Reports
Reports
Hydrogenated Nitrile Butadiene Rubber (HNBR) Market: Broadened Scope of Application to Underpin Growth
Shifts in the preference from nitrile butadiene rubber (NBR) to hydrogenated nitrile butadiene rubber (HNBR) has led to HNBR becoming one of the fast growing raw materials in the production of rubber articles. The perpetual rise in consumer preference for high-quality rubber calls for a change in the production process of rubber. Due to its physical strength and splendid retention properties, hydrogenated nitrile butadiene rubber finds center stage in numerous automotive, construction, oil and gas, and machinery applications. The automotive industry alone accounted for 47% share in the hydrogenated nitrile butadiene rubber market in 2018.
Considering the popularity of hydrogenated nitrile butadiene rubber in numerous industrial applications, and its contribution to the growth of the synthetic rubber industry, manufacturers are vying towards increasing their production capacities for HNBR. Sensing the high demand for hydrogenated nitrile butadiene rubber in the end-use sector and the volatility in the prices of natural rubber leading to a shift towards synthetic rubber, TMR has conducted extensive research on the hydrogenated nitrile butadiene rubber market. In its new study, TMR lays bare the key trends in the hydrogenated nitrile butadiene rubber market, and explains how the change in opportunities has impacted the key strategies of stakeholders in the HNBR market space.
Evolutionary Landscape of the HNBR Market
The synthetic rubber market is a key example of how volatility promotes growth. The synthetic rubber market came into the picture when the economic slowdown and low prices started hampering the natural rubber industry. It has now become an important commodity catering to the rising demand due to industrialization. Among the numerous synthetic rubbers in the market, hydrogenated nitrile butadiene rubber finds extensive application across a number of industries. The global hydrogenated nitrile butadiene rubber is projected to be valued at ~ US $ 63 Mn by the end of 2027, states TMR.
HNBR got its very own eminence because of the rising global competition in the automotive industry. New trends in engine designs called for the need to incorporate high-performance material in developing timing belts. To address this need, automotive manufacturers started moving away from polychloroprene to replace it with HNBR as the key raw material for timing belts.
Not just automotive manufacturers, but giants in the oil and gas industry eyed hydrogenated nitrile butadiene rubber for numerous oilfield applications such as sealing, gaskets, down-hole packers, and others. Although the risk of substitution continues to be a longstanding challenge for partakers in the hydrogenated nitrile butadiene rubber market, it presents an opportunity for the development of products with enhanced properties.
Key Trends Transitioning the Market
Governments Providing Assistance for Rubber Production
The governments of numerous leading rubber producing countries such as Thailand, India, Indonesia, and Sri Lanka are providing economic assistance to rubber manufacturers in the form of subsidies, tax breaks, as custom duty waivers. For instance, the Indian government has helped the rubber growers and manufacturers through various efforts such as trade fairs and buyer-seller meets.
Similarly, in Thailand, the government supported the rubber industry by establishing a free trade agreement with rubber importing countries such as New Zealand and Australia. These efforts stem from rising rubber exports from these countries to different parts of the world, and the building of pressure to enhance the production of rubber. In a bid to reduce the transportation costs for raw materials and increase revenue outcomes, leading tire manufacturers in North America and Europe are outsourcing their operations to rubber producing countries such as China and India.
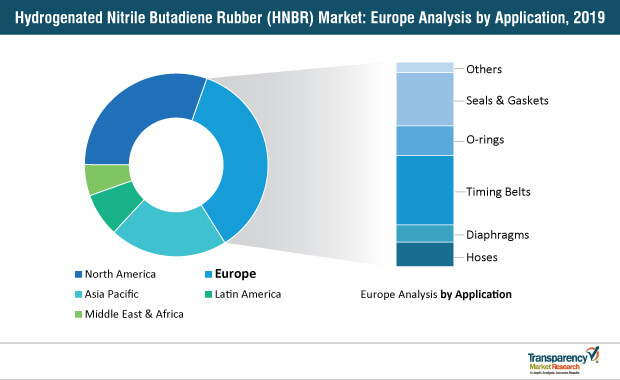
Rise in Demand for Seals and Gaskets
The seals and gaskets segment displays an upward trajectory, as it remains to be the preferred choice for the transportation and automotive industry. With the emergence of 3D printing techniques in the manufacturing sector, there has been considerable reduction in the turnaround time for the production of seals and gaskets. Capitalizing on the high demand and smooth manufacturing process for seals and gaskets, manufacturers are increasing their production capacities to stay ahead of the game in the hydrogenated nitrile butadiene rubber market.
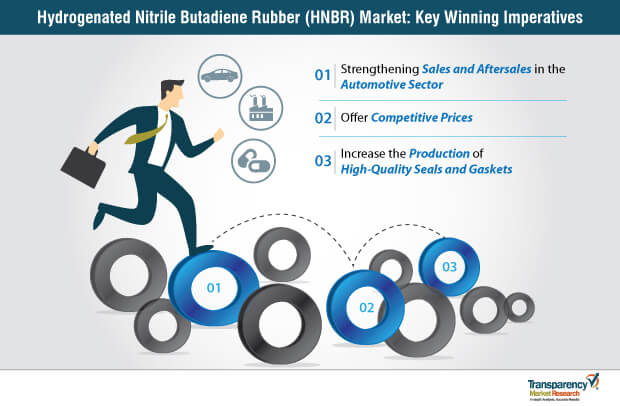
HNBR Market: Key Winning Strategies
Product Diversification to Remain Imperative
One of the key winning strategies deployed by leading manufacturers in the hydrogenated nitrile butadiene rubber market is product diversification to cater to a wide range of applications. Key players are foraying towards capitalizing on the high demand from different end-use industries such as oil and gas, automotive, construction, medical, and machinery. They are essentially tapping into the opportune potential of widening applications of hydrogenated nitrile butadiene rubber. For instance, Ge Mao Rubber Industrial Co., Ltd. manufactures products used in a pool of industries such as automotive, semiconductor, medical, drinking water, food & drug equipment, sanitary, and other applications. Similarly, Rahco Rubber, Inc. caters to industries such as plumbing, agriculture, energy, appliances, food service, transportation, marine, and municipal.
Variable Pricing to Align with Market Fluctuations
The rubber industry is highly dynamic in nature, with production fluctuation depending upon user trends and demand from the end-use industry. Leading manufacturers in the hydrogenated nitrile butadiene rubber industry are setting the prices of products with respect to market conditions in order to gain a competitive advantage over other players. They are essentially anticipating the changing trends in end-use industries and the economic conditions to set up suitable prices for HNBR products. This strategy has helped players cope with the volatility of the synthetic rubber industry.
Analysis of the Competitive Landscape
The global hydrogenated nitrile butadiene rubber market features a highly consolidated market landscape, with two major players - Zeon Chemical L.P. and ARLANXEO - accounting for 80% market share in 2018. Other key companies manufacturing HNBR include
Increasing production capacities and expansion of production units in developing countries remains a key strategy for players to expand their global footprints in the hydrogenated nitrile butadiene rubber market. For instance, in July 2015, KACO GmbH + Co. KG established a new plant in Ningguo City in the Anhui province, aimed at manufacturing dynamic sealing parts and supplying them to local and international automobile industries.
Players are resorting to online channels and websites to connect with a large base of customers and suppliers. In addition to this, they are striving to expand their frontiers in regional markets to leverage the untapped revenue pockets in these regions. They are participating in international conferences, tradeshows, and events to create a presence and build a strong brand image. Apart from these strategies, strategic mergers and acquisitions remain a preferred winning imperative for key market players to gain access to a large consumer base across the world.
Analysts’ Viewpoint on the HNBR Market
Authors of the report have an optimistic outlook on the future growth of the global hydrogenated nitrile butadiene rubber market. Developing countries are likely to remain lucrative markets, owing to the presence of numerous end-use industries. However, cost plays a key role in the hydrogenated nitrile butadiene rubber market because of the volatility in the synthetic rubber industry. Players responding quickly to the key changes in the industry will remain at the forefront, while the ones shying away from them may bear the brunt of losses.
Players are likely to increase the production of HNBR products used in the automotive industry, considering the contribution of this sector to the market’s success. Apart from this, mergers and acquisitions are likely to alter the market shares of companies during the forecast period. Overall, consolidation of the hydrogenated nitrile butadiene rubber market is likely to reduce over the forecast period, owing to the broadened scope application of HNBR and the lucrativeness of the market.
Hydrogenated Nitrile Butadiene Rubber (HNBR) Market Description
Key Growth Drivers of the Hydrogenated Nitrile Butadiene Rubber Market
Major Challenges for the Hydrogenated Nitrile Butadiene Rubber Market
Lucrative Opportunities for the Global Hydrogenated Nitrile Butadiene Rubber Market
Asia Pacific Prominent in the Hydrogenated Nitrile Butadiene Rubber Market
North America Also Offers Growth Opportunities
Automotive Segment to Account for a Prominent Share
Leading Players Actively Engage in Joint Ventures and R&D Activities
These companies are engaged in expansions, mergers & acquisitions, and joint ventures in order to increase their share in the global hydrogenated nitrile butadiene rubber market.
Zeon Corp. is expected to increase its production capacity for hydrogenated nitrile butadiene rubber at its manufacturing plant in Kawasaki, Japan, by the end of 2019. Currently, the production capacity of high-performance Zetpol at the Kawasaki plant stands at 500 tons per year.
1. Preface
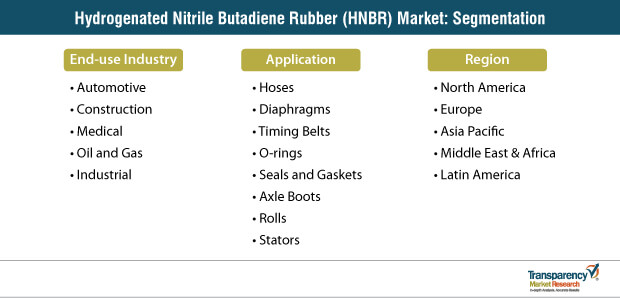
1.1. Market Definition and Scope
1.2. Market Segmentation
1.3. Key Research Objectives
1.4. Research Highlights
2. Assumptions and Research Methodology
2.1. Report Assumption
2.2. Acronyms Used
3. Executive Summary: Global Hydrogenated Nitrile Butadiene Rubber Market
4. Market Overview
4.1. Introduction
4.2. Key Industry Developments
4.3. Market Indicators
4.4. Market Dynamics
4.4.1. Drivers
4.4.2. Restraints
4.4.3. Opportunities
4.5. Global Hydrogenated Nitrile Butadiene Rubber Market Analysis and Forecast, 2018–2027
4.5.1. Global Hydrogenated Nitrile Butadiene Rubber Market Volume (Tons)
4.5.2. Global Hydrogenated Nitrile Butadiene Rubber Market Value (US$ Thousand)
4.6. Porters Five Forces Analysis
4.7. Value Chain Analysis
4.8. Pricing Analysis 2018-2027 (Benchmarking), by Region
5. Global Hydrogenated Nitrile Butadiene Rubber Market Analysis and Forecast, by End-use Industry
5.1. Introduction
5.2. Key Findings
5.3. Global Hydrogenated Nitrile Butadiene Rubber Market Volume (Tons) and Value (US$ Thousand) Forecast, by End-use Industry, 2019–2027
5.3.1. Automotive
5.3.2. Machinery
5.3.3. Oil & Gas
5.3.4. Construction
5.3.5. Medical
5.3.6. Others
5.4. Global Hydrogenated Nitrile Butadiene Rubber Market Attractiveness, by End-use Industry, 2018
6. Global Hydrogenated Nitrile Butadiene Rubber Market Analysis and Forecast, by Application
6.1. Introduction
6.2. Key Findings
6.3. Global Hydrogenated Nitrile Butadiene Rubber Market Volume (Tons) and Value (US$ Thousand) Forecast, by Application, 2019–2027
6.3.1. Hoses
6.3.2. Diaphragms
6.3.3. Timing Belts
6.3.4. O-rings
6.3.5. Seals & Gaskets
6.3.6. Others
6.4. Global Hydrogenated Nitrile Butadiene Rubber Market Attractiveness, by Application, 2018
7. Global Hydrogenated Nitrile Butadiene Rubber Market Analysis and Forecast, by Region
7.1. Key Findings
7.2. Global Hydrogenated Nitrile Butadiene Rubber Market Volume (Tons) and Value (US$ Thousand) Forecast, by Region, 2018–2027
7.2.1. North America
7.2.2. Europe
7.2.3. Asia Pacific
7.2.4. Latin America
7.2.5. Middle East & Africa
7.3. Global Hydrogenated Nitrile Butadiene Rubber Market Attractiveness, by Region, 2018
8. North America Hydrogenated Nitrile Butadiene Rubber Market Analysis and Forecast
8.1. Key Findings
8.2. North America Hydrogenated Nitrile Butadiene Rubber Market Forecast, by End-use Industry, 2018–2027
8.3. North America Hydrogenated Nitrile Butadiene Rubber Market Forecast, by Application, 2018–2027
8.4. North America Hydrogenated Nitrile Butadiene Rubber Market Forecast, by Country, 2018–2027
8.4.1. U.S. Hydrogenated Nitrile Butadiene Rubber Market Volume (Tons) and Value (US$ Thousand) Forecast, by End-use Industry, 2018–2027
8.4.2. U.S. Hydrogenated Nitrile Butadiene Rubber Market Volume (Tons) and Value (US$ Thousand) Forecast, by Application, 2018–2027
8.4.3. Canada Hydrogenated Nitrile Butadiene Rubber Market Volume (Tons) and Value (US$ Thousand) Forecast, by End-use Industry, 2018–2027
8.4.4. Canada Hydrogenated Nitrile Butadiene Rubber Market Volume (Tons) and Value (US$ Thousand) Forecast, by Application, 2018–2027
8.5 North America Hydrogenated Nitrile Butadiene Rubber Market Attractiveness Analysis, 2018
9. Europe Hydrogenated Nitrile Butadiene Rubber Market Analysis and Forecast
9.1. Key Findings
9.2. Europe Hydrogenated Nitrile Butadiene Rubber Market Forecast, by End-use Industry, 2018–2027
9.3. Europe Hydrogenated Nitrile Butadiene Rubber Market Forecast, by Application, 2018–2027
9.4. Europe Hydrogenated Nitrile Butadiene Rubber Market Forecast, by Country and Sub-region, 2018–2027
9.4.1. Germany Hydrogenated Nitrile Butadiene Rubber Market Volume (Tons) and Value (US$ Thousand) Forecast, by End-use Industry, 2018–2027
9.4.2. Germany Hydrogenated Nitrile Butadiene Rubber Market Volume (Tons) and Value (US$ Thousand) Forecast, by Application, 2018–2027
9.4.3. France Hydrogenated Nitrile Butadiene Rubber Market Volume (Tons) and Value (US$ Thousand) Forecast, by End-use Industry, 2018–2027
9.4.4. France Hydrogenated Nitrile Butadiene Rubber Market Volume (Tons) and Value (US$ Thousand) Forecast, by Application, 2018–2027
9.4.5. U.K. Hydrogenated Nitrile Butadiene Rubber Market Volume (Tons) and Value (US$ Thousand) Forecast, by End-use Industry, 2018–2027
9.4.6. U.K. Hydrogenated Nitrile Butadiene Rubber Market Volume (Tons) and Value (US$ Thousand) Forecast, by Application, 2018–2027
9.4.7. Italy Hydrogenated Nitrile Butadiene Rubber Market Volume (Tons) and Value (US$ Thousand) Forecast, by End-use Industry, 2018–2027
9.4.8. Italy Hydrogenated Nitrile Butadiene Rubber Market Volume (Tons) and Value (US$ Thousand) Forecast, by Application, 2018–2027
9.4.9. Spain Hydrogenated Nitrile Butadiene Rubber Market Volume (Tons) and Value (US$ Thousand) Forecast, by End-use Industry, 2018–2027
9.4.10. Spain Hydrogenated Nitrile Butadiene Rubber Market Volume (Tons) and Value (US$ Thousand) Forecast, by Application, 2018–2027
9.4.11. Russia & CIS Hydrogenated Nitrile Butadiene Rubber Market Volume (Tons) and Value (US$ Thousand) Forecast, by End-use Industry, 2018–2027
9.4.12. Russia & CIS Hydrogenated Nitrile Butadiene Rubber Market Volume (Tons) and Value (US$ Thousand) Forecast, by Application, 2018–2027
9.4.13. Rest of Europe Hydrogenated Nitrile Butadiene Rubber Market Volume (Tons) and Value (US$ Thousand) Forecast, by End-use Industry, 2018–2027
9.4.14. Rest of Europe Hydrogenated Nitrile Butadiene Rubber Market Volume (Tons) and Value (US$ Thousand) Forecast, by Application, 2018–2027
9.5. Europe Hydrogenated Nitrile Butadiene Rubber Market Attractiveness Analysis, 2018
10. Asia Pacific Hydrogenated Nitrile Butadiene Rubber Market Analysis and Forecast
10.1. Key Findings
10.2. Asia Pacific Hydrogenated Nitrile Butadiene Rubber Market Forecast, by End-use Industry, 2018–2027
10.3. Asia Pacific Hydrogenated Nitrile Butadiene Rubber Market Forecast, by Application, 2018–2027
10.4. Asia Pacific Hydrogenated Nitrile Butadiene Rubber Market Forecast, by Country and Sub-region, 2018–2027
10.4.1. China Hydrogenated Nitrile Butadiene Rubber Market Volume (Tons) and Value (US$ Thousand) Forecast, by End-use Industry, 2018–2027
10.4.2. China Hydrogenated Nitrile Butadiene Rubber Market Volume (Tons) and Value (US$ Thousand) Forecast, by Application, 2018–2027
10.4.3. Japan Hydrogenated Nitrile Butadiene Rubber Market Volume (Tons) and Value (US$ Thousand) Forecast, by End-use Industry, 2018–2027
10.4.4. Japan Hydrogenated Nitrile Butadiene Rubber Market Volume (Tons) and Value (US$ Thousand) Forecast, by Application, 2018–2027
10.4.5. India Hydrogenated Nitrile Butadiene Rubber Market Volume (Tons) and Value (US$ Thousand) Forecast, by End-use Industry, 2018–2027
10.4.6. India Hydrogenated Nitrile Butadiene Rubber Market Volume (Tons) and Value (US$ Thousand) Forecast, by Application, 2018–2027
10.4.7. ASEAN Hydrogenated Nitrile Butadiene Rubber Market Volume (Tons) and Value (US$ Thousand) Forecast, by End-use Industry, 2018–2027
10.4.8. ASEAN Hydrogenated Nitrile Butadiene Rubber Market Volume (Tons) and Value (US$ Thousand) Forecast, by Application, 2018–2027
10.4.9. Rest of Asia Pacific Hydrogenated Nitrile Butadiene Rubber Market Volume (Tons) and Value (US$ Thousand) Forecast, by End-use Industry, 2018–2027
10.4.10. Rest of Asia Pacific Hydrogenated Nitrile Butadiene Rubber Market Volume (Tons) and Value (US$ Thousand) Forecast, by Application, 2018–2027
10.5. Asia Pacific Hydrogenated Nitrile Butadiene Rubber Market Attractiveness Analysis, 2018
11. Latin America Hydrogenated Nitrile Butadiene Rubber Market Analysis and Forecast
11.1. Key Findings
11.2. Latin America Hydrogenated Nitrile Butadiene Rubber Market Forecast, by End-use Industry, 2018–2027
11.3. Latin America Hydrogenated Nitrile Butadiene Rubber Market Forecast, by Application, 2018–2027
11.4. Latin America Hydrogenated Nitrile Butadiene Rubber Market Forecast, by Country and Sub-region, 2018–2027
11.4.1. Brazil Hydrogenated Nitrile Butadiene Rubber Market Volume (Tons) and Value (US$ Thousand) Forecast, by End-use Industry, 2018–2027
11.4.2. Brazil Hydrogenated Nitrile Butadiene Rubber Market Volume (Tons) and Value (US$ Thousand) Forecast, by Application, 2018–2027
11.4.3. Mexico Hydrogenated Nitrile Butadiene Rubber Market Volume (Tons) and Value (US$ Thousand) Forecast, by End-use Industry, 2018–2027
11.4.4. Mexico Hydrogenated Nitrile Butadiene Rubber Market Volume (Tons) and Value (US$ Thousand) Forecast, by Application, 2018–2027
11.4.5. Rest of Latin America Hydrogenated Nitrile Butadiene Rubber Market Volume (Tons) and Value (US$ Thousand) Forecast, by End-use Industry, 2018–2027
11.4.6. Rest of Latin America Hydrogenated Nitrile Butadiene Rubber Market Volume (Tons) and Value (US$ Thousand) Forecast, by Application, 2018–2027
11.5. Latin America Hydrogenated Nitrile Butadiene Rubber Market Attractiveness Analysis, 2018
12. Middle East & Africa Hydrogenated Nitrile Butadiene Rubber Market Analysis and Forecast
12.1. Key Findings
12.2. Middle East & Africa Hydrogenated Nitrile Butadiene Rubber Market Forecast, by End-use Industry, 2018–2027
12.3. Middle East & Africa Hydrogenated Nitrile Butadiene Rubber Market Forecast, by Application, 2018–2027
12.4. Middle East & Africa Hydrogenated Nitrile Butadiene Rubber Market Forecast, by Country and Sub-region, 2018–2027
12.4.1. GCC Hydrogenated Nitrile Butadiene Rubber Market Volume (Tons) and Value (US$ Thousand) Forecast, by End-use Industry, 2018–2027
12.4.2. GCC Hydrogenated Nitrile Butadiene Rubber Market Volume (Tons) and Value (US$ Thousand) Forecast, by Application, 2018–2027
12.4.3. South Africa Hydrogenated Nitrile Butadiene Rubber Market Volume (Tons) and Value (US$ Thousand) Forecast, by End-use Industry, 2018–2027
12.4.4. South Africa Hydrogenated Nitrile Butadiene Rubber Market Volume (Tons) and Value (US$ Thousand) Forecast, by Application, 2018–2027
12.4.5. Rest of Middle East & Africa Hydrogenated Nitrile Butadiene Rubber Market Volume (Tons) and Value (US$ Thousand) Forecast, by End-use Industry, 2018–2027
12.4.6. Rest of Middle East & Africa Hydrogenated Nitrile Butadiene Rubber Market Volume (Tons) and Value (US$ Thousand) Forecast, by Application, 2018–2027
12.5. Middle East & Africa Hydrogenated Nitrile Butadiene Rubber Market Attractiveness Analysis, 2018
13. Competition Landscape
13.1. Global Hydrogenated Nitrile Butadiene Rubber Market Share Analysis, by Company, 2018
13.2. Market Players-Competition Matrix
13.2.1. Parker Hannifin Corporation
13.2.2. ARLANXEO
13.2.3. Zeon Chemicals L.P.
13.2.4. KACO GmbH + Co. KG
13.3. Competitive Business Strategies
13.4. Company Profiles
13.4.1. Polycomp
13.4.1.1. Company Description
13.4.1.2. Business Overview
13.4.1.3. Strategic Overview
13.4.2. ARLANXEO
13.4.2.1. Company Description
13.4.2.2. Business Overview
13.4.2.3. Strategic Overview
13.4.3. Zeon Chemicals L.P.
13.4.3.1. Company Description
13.4.3.2. Business Overview
13.4.3.3. Strategic Overview
13.4.4. Rahco Rubber, Inc.
13.4.4.1. Company Description
13.4.4.2. Business Overview
13.4.4.3. Strategic Overview
13.4.5. Elastomer Engineering Limited
13.4.5.1. Company Description
13.4.5.2. Business Overview
13.4.5.3. Strategic Overview
13.4.6. Ge Mao Rubber Industrial Co., Ltd.
13.4.6.1. Company Description
13.4.6.2. Business Overview
13.4.6.3. Strategic Overview
13.4.7. KACO GmbH + Co. KG
13.4.7.1. Company Description
13.4.7.2. Business Overview
13.4.7.3. Strategic Overview
13.4.8. Parker Hannifin Corporation
13.4.8.1. Company Description
13.4.8.2. Business Overview
13.4.8.3. Strategic Overview
13.4.9. Seals Eastern, Inc.
13.4.9.1. Company Description
13.4.9.2. Business Overview
13.4.9.3. Strategic Overview
13.4.10. Superior Group Limited
13.4.10.1. Company Description
13.4.10.2. Business Overview
13.4.10.3. Strategic Overview
13.4.11. AirBoss of America Corp.
13.4.11.1. Company Description
13.4.11.2. Business Overview
13.4.11.3. Strategic Overview
13.4.12. Precision Associates, Inc.
13.4.12.1. Company Description
13.4.12.2. Business Overview
13.4.12.3. Strategic Overview
13.4.13. Mantaline
13.4.13.1. Company Description
13.4.13.2. Business Overview
13.4.13.3. Strategic Overview
13.4.14. MCM S.p.A.
13.4.14.1. Company Description
13.4.14.2. Business Overview
13.4.14.3. Strategic Overview
List of Tables
Table 1: Global Hydrogenated Nitrile Butadiene Rubber Market Volume (Tons) Forecast, by End-use Industry, 2018–2027
Table 2: Global Hydrogenated Nitrile Butadiene Rubber Market Value (US$ Thousand) Forecast, by End-use Industry, 2018–2027
Table 3: Global Hydrogenated Nitrile Butadiene Rubber Market Volume (Tons) Forecast, by Application, 2018–2027
Table 4: Global Hydrogenated Nitrile Butadiene Rubber Market Value (US$ Thousand) Forecast, by Application, 2018–2027
Table 5: Global Hydrogenated Nitrile Butadiene Rubber Market Volume (Tons) Forecast, by Region, 2018–2027
Table 6: Global Hydrogenated Nitrile Butadiene Rubber Market Value (US$ Thousand) Forecast, by Region, 2018–2027
Table 7: North America Hydrogenated Nitrile Butadiene Rubber Market Volume (Tons) Forecast, by End-use Industry, 2018–2027
Table 8: North America Hydrogenated Nitrile Butadiene Rubber Market Value (US$ Thousand) Forecast, by End-use Industry, 2018–2027
Table 9: North America Hydrogenated Nitrile Butadiene Rubber Market Volume (Tons) Forecast, by Application, 2018–2027
Table 10: North America Hydrogenated Nitrile Butadiene Rubber Market Value (US$ Thousand) Forecast, by Application, 2018–2027
Table 11: North America Hydrogenated Nitrile Butadiene Rubber Market Volume (Tons) Forecast, by Country, 2018–2027
Table 12: North America Hydrogenated Nitrile Butadiene Rubber Market Value (US$ Thousand) Forecast, by Country, 2018–2027
Table 13: U.S. Hydrogenated Nitrile Butadiene Rubber Market Volume (Tons) Forecast, by End-use Industry, 2018–2027
Table 14: U.S. Hydrogenated Nitrile Butadiene Rubber Market Value (US$ Thousand) Forecast, by End-use Industry, 2018–2027
Table 15: U.S. Hydrogenated Nitrile Butadiene Rubber Market Volume (Tons) Forecast, by Application, 2018–2027
Table 16: U.S. Hydrogenated Nitrile Butadiene Rubber Market Value (US$ Thousand) Forecast, by Application, 2018–2027
Table 17: Canada Hydrogenated Nitrile Butadiene Rubber Market Volume (Tons) Forecast, by End-use Industry, 2018–2027
Table 18: Canada Hydrogenated Nitrile Butadiene Rubber Market Value (US$ Thousand) Forecast, by End-use Industry, 2018–2027
Table 19: Canada Hydrogenated Nitrile Butadiene Rubber Market Volume (Tons) Forecast, by Application, 2018–2027
Table 20: Canada Hydrogenated Nitrile Butadiene Rubber Market Value (US$ Thousand) Forecast, by Application, 2018–2027
Table 21: Europe Hydrogenated Nitrile Butadiene Rubber Market Volume (Tons) Forecast, by End-use Industry, 2018–2027
Table 22: Europe Hydrogenated Nitrile Butadiene Rubber Market Value (US$ Thousand) Forecast, by End-use Industry, 2018–2027
Table 23: Europe Hydrogenated Nitrile Butadiene Rubber Market Volume (Tons) Forecast, by Application, 2018–2027
Table 24: Europe Hydrogenated Nitrile Butadiene Rubber Market Value (US$ Thousand) Forecast, by Application, 2018–2027
Table 25: Europe Hydrogenated Nitrile Butadiene Rubber Market Volume (Tons) Forecast, by Country and Sub-region, 2018–2027
Table 26: Europe Hydrogenated Nitrile Butadiene Rubber Market Value (US$ Thousand) Forecast, by Country and Sub-region, 2018–2027
Table 27: Germany Hydrogenated Nitrile Butadiene Rubber Market Volume (Tons) Forecast, by End-use Industry, 2018–2027
Table 28: Germany Hydrogenated Nitrile Butadiene Rubber Market Value (US$ Thousand) Forecast, by End-use Industry, 2018–2027
Table 29: Germany Hydrogenated Nitrile Butadiene Rubber Market Volume (Tons) Forecast, by Application, 2018–2027
Table 30: Germany Hydrogenated Nitrile Butadiene Rubber Market Value (US$ Thousand) Forecast, by Application, 2018–2027
Table 31: France Hydrogenated Nitrile Butadiene Rubber Market Volume (Tons) Forecast, by End-use Industry, 2018–2027
Table 32: France Hydrogenated Nitrile Butadiene Rubber Market Value (US$ Thousand) Forecast, by End-use Industry, 2018–2027
Table 33: France Hydrogenated Nitrile Butadiene Rubber Market Volume (Tons) Forecast, by Application, 2018–2027
Table 34: France Hydrogenated Nitrile Butadiene Rubber Market Value (US$ Thousand) Forecast, by Application, 2018–2027
Table 35: U.K. Hydrogenated Nitrile Butadiene Rubber Market Volume (Tons) Forecast, by End-use Industry, 2018–2027
Table 36: U.K. Hydrogenated Nitrile Butadiene Rubber Market Value (US$ Thousand) Forecast, by End-use Industry, 2018–2027
Table 37: U.K. Hydrogenated Nitrile Butadiene Rubber Market Volume (Tons) Forecast, by Application, 2018–2027
Table 38: U.K. Hydrogenated Nitrile Butadiene Rubber Market Value (US$ Thousand) Forecast, by Application, 2018–2027
Table 39: Italy Hydrogenated Nitrile Butadiene Rubber Market Volume (Tons) Forecast, by End-use Industry, 2018–2027
Table 40: Italy Hydrogenated Nitrile Butadiene Rubber Market Value (US$ Thousand) Forecast, by End-use Industry, 2018–2027
Table 41: Italy Hydrogenated Nitrile Butadiene Rubber Market Volume (Tons) Forecast, by Application, 2018–2027
Table 42: Italy Hydrogenated Nitrile Butadiene Rubber Market Value (US$ Thousand) Forecast, by Application, 2018–2027
Table 43: Spain Hydrogenated Nitrile Butadiene Rubber Market Volume (Tons) Forecast, by End-use Industry, 2018–2027
Table 44: Spain Hydrogenated Nitrile Butadiene Rubber Market Value (US$ Thousand) Forecast, by End-use Industry, 2018–2027
Table 45: Spain Hydrogenated Nitrile Butadiene Rubber Market Volume (Tons) Forecast, by Application, 2018–2027
Table 46: Spain Hydrogenated Nitrile Butadiene Rubber Market Value (US$ Thousand) Forecast, by Application, 2018–2027
Table 47: Russia & CIS Hydrogenated Nitrile Butadiene Rubber Market Volume (Tons) Forecast, by End-use Industry, 2018–2027
Table 48: Russia & CIS Hydrogenated Nitrile Butadiene Rubber Market Value (US$ Thousand) Forecast, by End-use Industry, 2018–2027
Table 49: Russia & CIS Hydrogenated Nitrile Butadiene Rubber Market Volume (Tons) Forecast, by Application, 2018–2027
Table 50: Russia & CIS Hydrogenated Nitrile Butadiene Rubber Market Value (US$ Thousand) Forecast, by Application, 2018–2027
Table 51: Rest of Europe Hydrogenated Nitrile Butadiene Rubber Market Volume (Tons) Forecast, by End-use Industry, 2018–2027
Table 52: Rest of Europe Hydrogenated Nitrile Butadiene Rubber Market Value (US$ Thousand) Forecast, by End-use Industry, 2018–2027
Table 53: Rest of Europe Hydrogenated Nitrile Butadiene Rubber Market Volume (Tons) Forecast, by Application, 2018–2027
Table 54: Rest of Europe Hydrogenated Nitrile Butadiene Rubber Market Value (US$ Thousand) Forecast, by Application, 2018–2027
Table 55: Asia Pacific Hydrogenated Nitrile Butadiene Rubber Market Volume (Tons) Forecast, by End-use Industry, 2018–2027
Table 56: Asia Pacific Hydrogenated Nitrile Butadiene Rubber Market Value (US$ Thousand) Forecast, by End-use Industry, 2018–2027
Table 57: Asia Pacific Hydrogenated Nitrile Butadiene Rubber Market Volume (Tons) Forecast, by Application, 2018–2027
Table 58: Asia Pacific Hydrogenated Nitrile Butadiene Rubber Market Value (US$ Thousand) Forecast, by Application, 2018–2027
Table 59: Asia Pacific Hydrogenated Nitrile Butadiene Rubber Market Volume (Tons) Forecast, by Country and Sub-region, 2018–2027
Table 60: Asia Pacific Hydrogenated Nitrile Butadiene Rubber Market Value (US$ Thousand) Forecast, by Country and Sub-region, 2018–2027
Table 61: China Hydrogenated Nitrile Butadiene Rubber Market Volume (Tons) Forecast, by End-use Industry, 2018–2027
Table 62: China Hydrogenated Nitrile Butadiene Rubber Market Value (US$ Thousand) Forecast, by End-use Industry, 2018–2027
Table 63: China Hydrogenated Nitrile Butadiene Rubber Market Volume (Tons) Forecast, by Application, 2018–2027
Table 64: China Hydrogenated Nitrile Butadiene Rubber Market Value (US$ Thousand) Forecast, by Application, 2018–2027
Table 65: Japan Hydrogenated Nitrile Butadiene Rubber Market Volume (Tons) Forecast, by End-use Industry, 2018–2027
Table 66: Japan Hydrogenated Nitrile Butadiene Rubber Market Value (US$ Thousand) Forecast, by End-use Industry, 2018–2027
Table 67: Japan Hydrogenated Nitrile Butadiene Rubber Market Volume (Tons) Forecast, by Application, 2018–2027
Table 68: Japan Hydrogenated Nitrile Butadiene Rubber Market Value (US$ Thousand) Forecast, by Application, 2018–2027
Table 69: India Hydrogenated Nitrile Butadiene Rubber Market Volume (Tons) Forecast, by End-use Industry, 2018–2027
Table 70: India Hydrogenated Nitrile Butadiene Rubber Market Value (US$ Thousand) Forecast, by End-use Industry, 2018–2027
Table 71: India Hydrogenated Nitrile Butadiene Rubber Market Volume (Tons) Forecast, by Application, 2018–2027
Table 72: India Hydrogenated Nitrile Butadiene Rubber Market Value (US$ Thousand) Forecast, by Application, 2018–2027
Table 73: ASEAN Hydrogenated Nitrile Butadiene Rubber Market Volume (Tons) Forecast, by End-use Industry, 2018–2027
Table 74: ASEAN Hydrogenated Nitrile Butadiene Rubber Market Value (US$ Thousand) Forecast, by End-use Industry, 2018–2027
Table 75: ASEAN Hydrogenated Nitrile Butadiene Rubber Market Volume (Tons) Forecast, by Application, 2018–2027
Table 76: ASEAN Hydrogenated Nitrile Butadiene Rubber Market Value (US$ Thousand) Forecast, by Application, 2018–2027
Table 77: Rest of Asia Pacific Hydrogenated Nitrile Butadiene Rubber Market Volume (Tons) Forecast, by End-use Industry, 2018–2027
Table 78: Rest of Asia Pacific Hydrogenated Nitrile Butadiene Rubber Market Value (US$ Thousand) Forecast, by End-use Industry, 2018–2027
Table 79: Rest of Asia Pacific Hydrogenated Nitrile Butadiene Rubber Market Volume (Tons) Forecast, by Application, 2018–2027
Table 80: Rest of Asia Pacific Hydrogenated Nitrile Butadiene Rubber Market Value (US$ Thousand) Forecast, by Application, 2018–2027
Table 81: Latin America Hydrogenated Nitrile Butadiene Rubber Market Volume (Tons) Forecast, by End-use Industry, 2018–2027
Table 82: Latin America Hydrogenated Nitrile Butadiene Rubber Market Value (US$ Thousand) Forecast, by End-use Industry, 2018–2027
Table 83: Latin America Hydrogenated Nitrile Butadiene Rubber Market Volume (Tons) Forecast, by Application, 2018–2027
Table 84: Latin America Hydrogenated Nitrile Butadiene Rubber Market Value (US$ Thousand) Forecast, by Application, 2018–2027
Table 85: Latin America Hydrogenated Nitrile Butadiene Rubber Market Volume (Tons) Forecast, by Country and Sub-region, 2018–2027
Table 86: Latin America Hydrogenated Nitrile Butadiene Rubber Market Value (US$ Thousand) Forecast, by Country and Sub-region, 2018–2027
Table 87: Brazil Hydrogenated Nitrile Butadiene Rubber Market Volume (Tons) Forecast, by End-use Industry, 2018–2027
Table 88: Brazil Hydrogenated Nitrile Butadiene Rubber Market Value (US$ Thousand) Forecast, by End-use Industry, 2018–2027
Table 89: Brazil Hydrogenated Nitrile Butadiene Rubber Market Volume (Tons) Forecast, by Application, 2018–2027
Table 90: Brazil Hydrogenated Nitrile Butadiene Rubber Market Value (US$ Thousand) Forecast, by Application, 2018–2027
Table 91: Mexico Hydrogenated Nitrile Butadiene Rubber Market Volume (Tons) Forecast, by End-use Industry, 2018–2027
Table 92: Mexico Hydrogenated Nitrile Butadiene Rubber Market Value (US$ Thousand) Forecast, by End-use Industry, 2018–2027
Table 93: Mexico Hydrogenated Nitrile Butadiene Rubber Market Volume (Tons) Forecast, by Application, 2018–2027
Table 94: Mexico Hydrogenated Nitrile Butadiene Rubber Market Value (US$ Thousand) Forecast, by Application, 2018–2027
Table 95: Rest of Latin America Hydrogenated Nitrile Butadiene Rubber Market Volume (Tons) Forecast, by End-use Industry, 2018–2027
Table 96: Rest of Latin America Hydrogenated Nitrile Butadiene Rubber Market Value (US$ Thousand) Forecast, by End-use Industry, 2018–2027
Table 97: Rest of Latin America Hydrogenated Nitrile Butadiene Rubber Market Volume (Tons) Forecast, by Application, 2018–2027
Table 98: Rest of Latin America Hydrogenated Nitrile Butadiene Rubber Market Value (US$ Thousand) Forecast, by Application, 2018–2027
Table 99: Middle East & Africa Hydrogenated Nitrile Butadiene Rubber Market Volume (Tons) Forecast, by End-use Industry, 2018–2027
Table 100: Middle East & Africa Hydrogenated Nitrile Butadiene Rubber Market Value (US$ Thousand) Forecast, by End-use Industry, 2018–2027
Table 101: Middle East & Africa Hydrogenated Nitrile Butadiene Rubber Market Volume (Tons) Forecast, by Application, 2018–2027
Table 102: Middle East & Africa Hydrogenated Nitrile Butadiene Rubber Market Value (US$ Thousand) Forecast, by Application, 2018–2027
Table 103: Middle East & Africa Hydrogenated Nitrile Butadiene Rubber Market Volume (Tons) Forecast, by Country and Sub-region, 2018–2027
Table 104: Middle East & Africa Hydrogenated Nitrile Butadiene Rubber Market Value (US$ Thousand) Forecast, by Country and Sub-region, 2018–2027
Table 105: GCC Hydrogenated Nitrile Butadiene Rubber Market Volume (Tons) Forecast, by End-use Industry, 2018–2027
Table 106: GCC Hydrogenated Nitrile Butadiene Rubber Market Value (US$ Thousand) Forecast, by End-use Industry, 2018–2027
Table 107: GCC Hydrogenated Nitrile Butadiene Rubber Market Volume (Tons) Forecast, by Application, 2018–2027
Table 108: GCC Hydrogenated Nitrile Butadiene Rubber Market Value (US$ Thousand) Forecast, by Application, 2018–2027
Table 109: South Africa Hydrogenated Nitrile Butadiene Rubber Market Volume (Tons) Forecast, by End-use Industry, 2018–2027
Table 110: South Africa Hydrogenated Nitrile Butadiene Rubber Market Value (US$ Thousand) Forecast, by End-use Industry, 2018–2027
Table 111: South Africa Hydrogenated Nitrile Butadiene Rubber Market Volume (Tons) Forecast, by Application, 2018–2027
Table 112: South Africa Hydrogenated Nitrile Butadiene Rubber Market Value (US$ Thousand) Forecast, by Application, 2018–2027
Table 113: Rest of Middle East & Africa Hydrogenated Nitrile Butadiene Rubber Market Volume (Tons) Forecast, by End-use Industry, 2018–2027
Table 114: Rest of Middle East & Africa Hydrogenated Nitrile Butadiene Rubber Market Value (US$ Thousand) Forecast, by End-use Industry, 2018–2027
Table 115: Rest of Middle East & Africa Hydrogenated Nitrile Butadiene Rubber Market Volume (Tons) Forecast, by Application, 2018–2027
Table 116: Rest of Middle East & Africa Hydrogenated Nitrile Butadiene Rubber Market Value (US$ Thousand) Forecast, by Application, 2018–2027
List of Figures
Figure 1: Global Hydrogenated Nitrile Butadiene Rubber Price Trend, 2018–2027 (US$/Ton)
Figure 2: Global Hydrogenated Nitrile Butadiene Rubber Market Volume (Tons) and Value (US$ Thousand) Forecast, 2019–2027
Figure 3: Global Hydrogenated Nitrile Butadiene Rubber Market Value Share, by End-use Industry, 2018 and 2027
Figure 4: Global Hydrogenated Nitrile Butadiene Rubber Market Attractiveness, by End-use Industry, 2018
Figure 5: Global Hydrogenated Nitrile Butadiene Rubber Market Value Share, by Application, 2018 and 2027
Figure 6: Global Hydrogenated Nitrile Butadiene Rubber Market Attractiveness, by Application, 2018
Figure 7: Global Hydrogenated Nitrile Butadiene Rubber Market Value Share, by Region, 2018 and 2027
Figure 8: Global Hydrogenated Nitrile Butadiene Rubber Market Attractiveness, by Region, 2018
Figure 9: North America Hydrogenated Nitrile Butadiene Rubber Market Volume (Tons) and Value (US$ Thousand) Forecast, 2019–2027
Figure 10: North America Hydrogenated Nitrile Butadiene Rubber Market Attractiveness, by Country, 2018
Figure 11: North America Hydrogenated Nitrile Butadiene Rubber Market Value Share, by End-use Industry, 2018 and 2027
Figure 12: North America Hydrogenated Nitrile Butadiene Rubber Market Value Share, by Application, 2018 and 2027
Figure 13: North America Hydrogenated Nitrile Butadiene Rubber Market Value Share, by Country, 2018 and 2027
Figure 14: North America Hydrogenated Nitrile Butadiene Rubber Market Attractiveness, by End-use Industry, 2018
Figure 15: North America Hydrogenated Nitrile Butadiene Rubber Market Attractiveness, by Application, 2018
Figure 16: Europe Hydrogenated Nitrile Butadiene Rubber Market Volume (Tons) and Value (US$ Thousand) Forecast, 2019–2027
Figure 17: Europe Hydrogenated Nitrile Butadiene Rubber Market Attractiveness, by Country and Sub-region, 2018
Figure 18: Europe Hydrogenated Nitrile Butadiene Rubber Market Value Share, by End-use Industry, 2018 and 2027
Figure 19: Europe Hydrogenated Nitrile Butadiene Rubber Market Value Share, by Application, 2018 and 2027
Figure 20: Europe Hydrogenated Nitrile Butadiene Rubber Market Value Share, by Country and Sub-region, 2018 and 2027
Figure 21: Europe Hydrogenated Nitrile Butadiene Rubber Market Attractiveness, by End-use Industry, 2018
Figure 22: Europe Hydrogenated Nitrile Butadiene Rubber Market Attractiveness, by Application, 2018
Figure 23: Asia Pacific Hydrogenated Nitrile Butadiene Rubber Market Volume (Tons) and Value (US$ Thousand) Forecast, 2019–2027
Figure 24: Asia Pacific Hydrogenated Nitrile Butadiene Rubber Market Attractiveness, by Country and Sub-region, 2018
Figure 25: Asia Pacific Hydrogenated Nitrile Butadiene Rubber Market Value Share, by End-use Industry, 2018 and 2027
Figure 26: Asia Pacific Hydrogenated Nitrile Butadiene Rubber Market Value Share, by Application, 2018 and 2027
Figure 27: Asia Pacific Hydrogenated Nitrile Butadiene Rubber Market Value Share, by Country and Sub-region, 2018 and 2027
Figure 28: Asia Pacific Hydrogenated Nitrile Butadiene Rubber Market Attractiveness, by End-use Industry, 2018
Figure 29: Asia Pacific Hydrogenated Nitrile Butadiene Rubber Market Attractiveness, by Application, 2018
Figure 30: Latin America Hydrogenated Nitrile Butadiene Rubber Market Volume (Tons) and Value (US$ Thousand) Forecast, 2019–2027
Figure 31: Latin America Hydrogenated Nitrile Butadiene Rubber Market Attractiveness, by Country and Sub-region, 2018
Figure 32: Latin America Hydrogenated Nitrile Butadiene Rubber Market Value Share, by End-use Industry, 2018 and 2027
Figure 33: Latin America Hydrogenated Nitrile Butadiene Rubber Market Value Share, by Application, 2018 and 2027
Figure 34: Latin America Hydrogenated Nitrile Butadiene Rubber Market Value Share, by Country and Sub-region, 2018 and 2027
Figure 35: Latin America Hydrogenated Nitrile Butadiene Rubber Market Attractiveness, by End-use Industry, 2018
Figure 36: Latin America Hydrogenated Nitrile Butadiene Rubber Market Attractiveness, by Application, 2018
Figure 37: Middle East & Africa Hydrogenated Nitrile Butadiene Rubber Market Volume (Tons) and Value (US$ Thousand) Forecast, 2019–2027
Figure 38: Middle East & Africa Hydrogenated Nitrile Butadiene Rubber Market Attractiveness, by Country and Sub-region, 2018
Figure 39: Middle East & Africa Hydrogenated Nitrile Butadiene Rubber Market Value Share, by End-use Industry, 2018 and 2027
Figure 40: Middle East & Africa Hydrogenated Nitrile Butadiene Rubber Market Value Share, by Application, 2018 and 2027
Figure 41: Middle East & Africa Hydrogenated Nitrile Butadiene Rubber Market Value Share, by Country and Sub-region, 2018 and 2027
Figure 42: Middle East & Africa Hydrogenated Nitrile Butadiene Rubber Market Attractiveness, by End-use Industry, 2018
Figure 43: Middle East & Africa Hydrogenated Nitrile Butadiene Rubber Market Attractiveness, by Application, 2018
Figure 44: Global Hydrogenated Nitrile Butadiene Rubber Market Share Analysis, by Company, 2018
Copyright © Transparency Market Research, Inc. All Rights reserved
Trust Online

Hydrogenated Nitrile Butadiene Rubber (HNBR) Market